THG Unveils New LCD Benchmarking Method
How To Interpret The Graph
The calibration gives us a DeltaE graph of the monitors. This value corresponds to the measured difference between the requested color and the color actually reproduced. A DeltaE less than or equal to 1 represents a perfect calibration: there is no perceptible difference between the original color and the reproduced one. Starting at DeltaE = 3, the human eye can detect the difference in shade.
On the X-axis: the values go from black (0) to white (100). On the Y-axis is the DeltaE.
Applied to the graph of our Prophetview 920 Pro, this means that:
- DeltaE < 2 = 94% of the colors displayed, from dark gray to white, are correct.
- DeltaE < 1 = 76% of the colors are reproduced perfectly.
- DeltaE > 3 = 4% of the colors displayed are not accurate. This is the case mostly with dark colors on TFT monitors.
This test also shows:
- Contrast level with the calibration adjustments.
- Black depth, with a measurement of black brightness displayed with the same adjustments.
- Brightness under test conditions.
So, using these results, you can judge the "static" quality of the monitors - that is, their ability to display still images precisely. But what about latency?
Measuring Latency
The System
The complete system for measuring latency consists of:
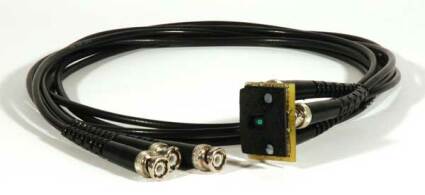
- An optical sensor that converts light intensity into voltage.
- A linear laboratory power supply to power the sensor.
- A digital oscilloscope.
- Stimulation software.
Since this is a specially developed system, we should describe how it operates and performs, in order to rule out any doubts as to the validity of our measurements.
Get Tom's Hardware's best news and in-depth reviews, straight to your inbox.
