AMD's Trinity APU Efficiency: Undervolted And Overclocked
We've been playing with AMD's Trinity APUs for four months, and they're just now being rolled out to the channel. This time, we take a look at the architecture's efficiency compared to a pair of Ivy Bridge-based Core i3s. Can A10 and A8 stand up to Intel?
Power Consumption
We didn’t have an opportunity to compare the power profiles of Intel’s 65 W Core i3-2100 and AMD’s Trinity-based APUs in our preview stories. However, now we have Core i3-3000-series chips to include instead.
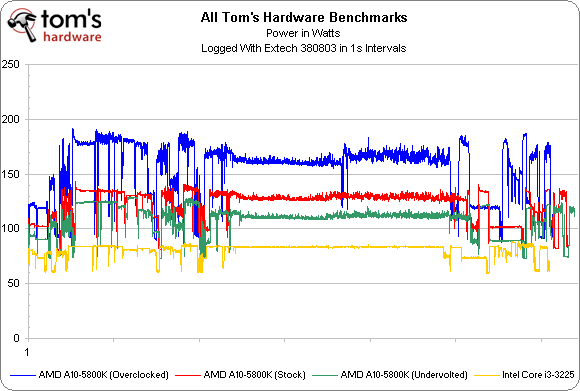
The following chart is a power log of our entire test suite, which is scripted. That long stretch of fairly constant consumption in the middle is our Visual Basic 2010 benchmark, which lasts for almost an hour. Normally we’d have Blender and PCMark 7 as part of this capture, but stability issues on the Trinity-based system forced us to rem them from our batch file.
Here’s where AMD gets hammered. This power chart from June’s Trinity preview showed that, although the new architecture is effectively able to idle at lower power than Llano, it still butts right up to its 100 W thermal ceiling under load. That's a problem because AMD's competition is rated for 55 W.
Now, when we put A10-5800K overclocked, at its stock settings, and undervolted in the same chart as a Core i3-3225, we come away with a couple of different observations.
First, there’s an almost 50 W difference in average system power between the overclocked and undervolted A10-based configurations. That’s a greater-than 43% jump in overall consumption. Did performance increase commensurately? We doubt it, but we’ll get an exact answer on the next page.
Second, Intel’s advantage in manufacturing technology translates directly to its rated thermal design power, and we can see the result of that in an average system power consumption of 80 W. This says nothing of efficiency, of course, which involves a performance component. However, given what we now know about power (and what we saw on the preceding benchmark pages), it’d be almost impossible for AMD to catch up in the applications we’re testing today.
Get Tom's Hardware's best news and in-depth reviews, straight to your inbox.
-
esrever Most PC are idle or semi idle when people have them on. 90% of the time I use my PC, I do web surfing or watch video or a text editor for work, my pc is not loaded with benchmarks 24/7. If you look at idle power consumption, the trinity APUs are amazing. They easily beat out intels offerings. If you are looking at the power consumption over a month, the trinity will be much more energy efficient than the i3 for most people.Reply
-
tacoslave man getting this in a 17inch laptop with a 12 cell battery would make it an instabuyReply -
mayankleoboy1 ReplyIn the end, then, both Intel and AMD are offering you an experience. Which one do you pick?
At this price point, i would choose AMD Trinity. -
cangelini esreverMost PC are idle or semi idle when people have them on. 90% of the time I use my PC, I do web surfing or watch video or a text editor for work, my pc is not loaded with benchmarks 24/7. If you look at idle power consumption, the trinity APUs are amazing. They easily beat out intels offerings. If you are looking at the power consumption over a month, the trinity will be much more energy efficient than the i3 for most people.Happy to set a couple of systems up and let you know what I find.Reply -
mayankleoboy1 AMD should team up with developer of 7zip to accelerate it on APU's. That will make Trinity look better. A lot of people use 7zip. And most of the installation setup exe files are compressed using LZMA algorithm.Reply -
mayankleoboy1 Chris, it would be great to see some benchmarks of applications that uses the new FMA3 instructions of the Piledriver.Reply -
cangelini esreverMost PC are idle or semi idle when people have them on. 90% of the time I use my PC, I do web surfing or watch video or a text editor for work, my pc is not loaded with benchmarks 24/7. If you look at idle power consumption, the trinity APUs are amazing. They easily beat out intels offerings. If you are looking at the power consumption over a month, the trinity will be much more energy efficient than the i3 for most people.So, it's probable that we're seeing a difference in configuration. It looks like Anand is using the Gigabyte A85X board and perhaps an older driver version. I'm on the MSI board and Cat 12.8, with a different Intel setup as well. On the Windows desktop, after 10 minutes on each config, I get 59 W for Intel and 67 W for AMD at idle.Reply -
techcurious Chris, for the sake of completeness, any chance you could undervolt the i3-3225 at stock speeds and run the power consumption/efficiency tests on it? ;) ...to reveal how low the i3 can be pushed with some tweaking as well, and create the opportunity for a more fair comparison with the undervolted Trinity results.Reply -
sarinaide Thanks Chris, another great article to pass time over. You really need to comment on the forums more and more so to help out against the blatent belligerence against what AMD are trying to achieve and how they are looking to achieve it.Reply
Hopefully this articale can start to filter around particularly for the budget users which A-series is premised to target.

