AMD vs Nvidia: Whose Driver Updates Improve Performance More?
Metro: Last Light Redux (2014, DX11)
Technically, Metro: Last Light was introduced in 2013. But the Redux version we’re testing today came out a year later. Its built-in and highly configurable benchmarking tool makes Metro popular for generating repeatable data. Case in point: tests run two years apart on entirely different platforms fall within 1 FPS of each other thanks to a heavy dependence on graphics performance.
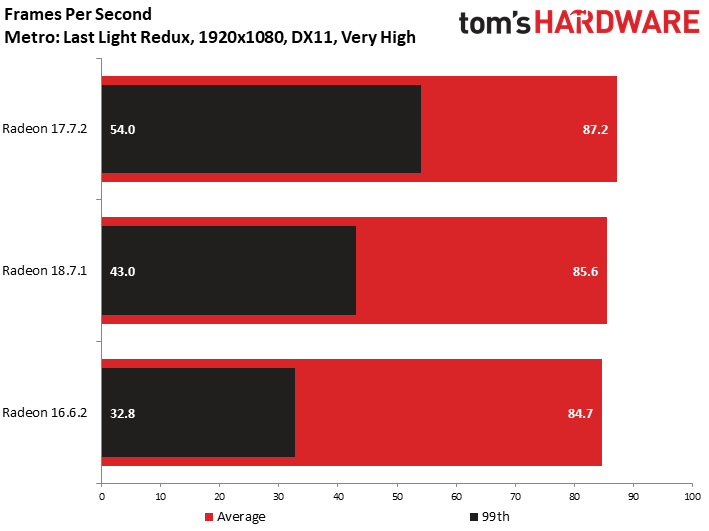
Based on our average frame rate results, the Radeon RX 480’s profile did change over time in Metro, improving 1% from 16.6.2 to 18.7.1.
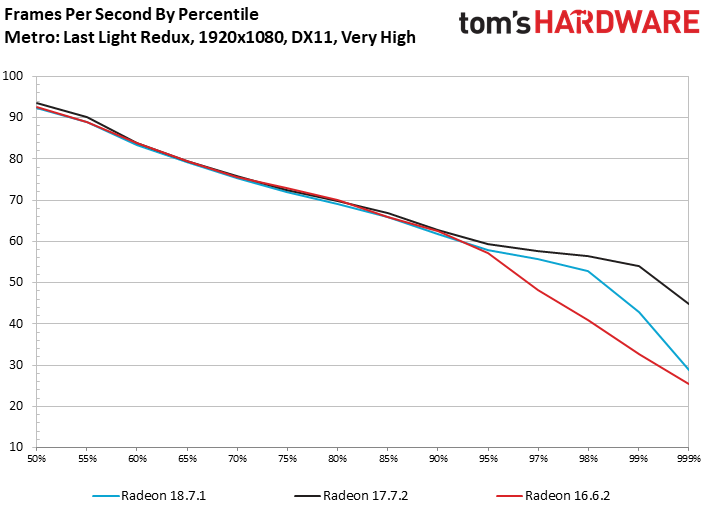
Those 99th percentile numbers are far more interesting, though. Breaking frame rate down by percentile also shows that the slowest five percent of frames are quite different from one driver build to another. AMD’s newest package isn’t even the best. As we saw in the Battlefield games, last year’s 17.7.2 version offered the best performance. But 17.7.2 and 18.7.1 are both dramatic improvements over 16.6.2.
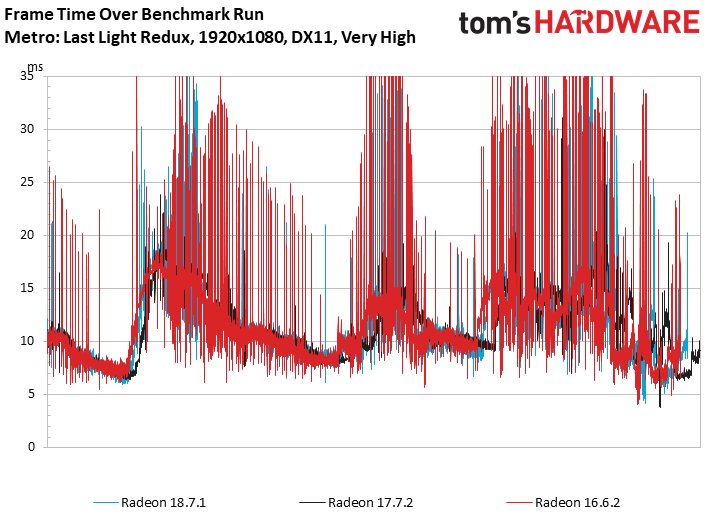
Need proof? Check out the frame times across our test sequence. All of those red spikes correspond to frames that take tens of milliseconds longer to display than the thicker trendline down below. The resulting animation appears less smooth. Fortunately, AMD addressed the issue through its drivers. The 17.7.2 line, in black, suffers the least amount of variance, while 18.7.1 isn’t quite as tight.
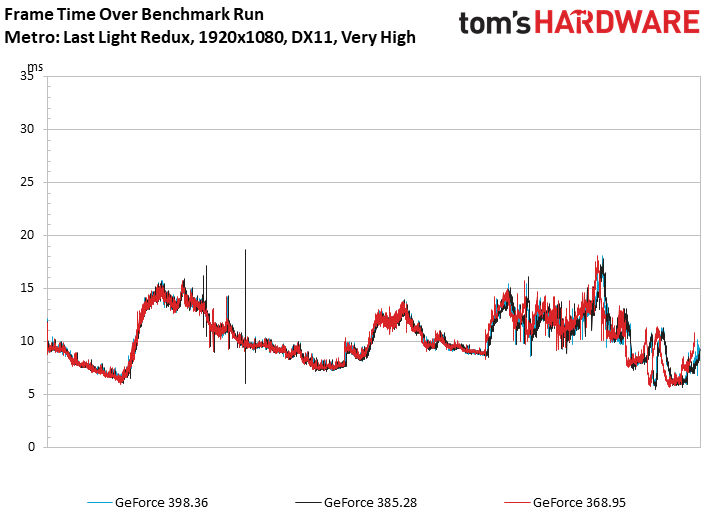
Flip right over to Nvidia’s frame time chart and observe the difference. Three thick trend lines convey fluid animation. A handful of spikes from the 385.28 build stand out, but only because the other two versions demonstrate ideal behavior.
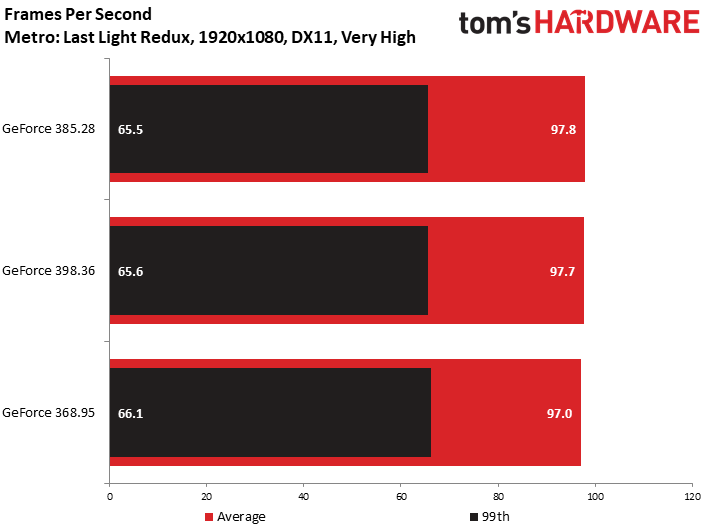
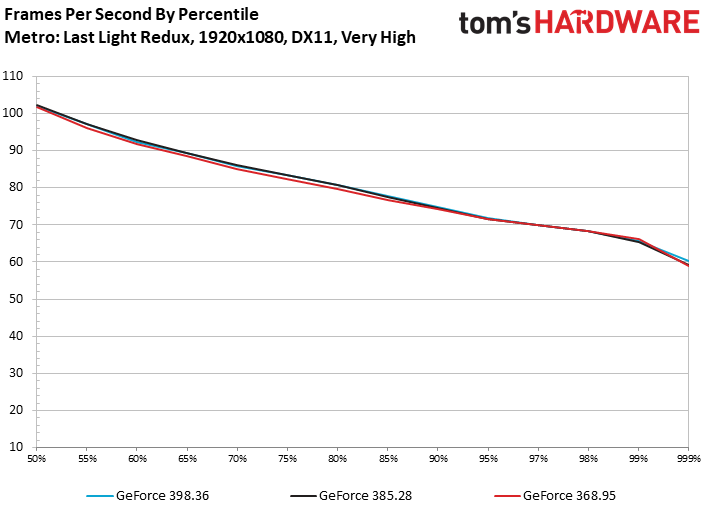
Back to GeForce GTX 1060’s average frame rate, there's a mere 0.7% improvement from 368.95 to 398.36, and no real drama to speak of in the slowest 1% of frames.
Despite minimal improvement over time, Nvidia’s card still ends up 14% faster than the Radeon in Metro: Last Light Redux at 1920x1080 using the Very High preset.
Get Tom's Hardware's best news and in-depth reviews, straight to your inbox.
MORE: Best Graphics Cards
MORE: Desktop GPU Performance Hierarchy Table
MORE: All Graphics Content
Current page: Metro: Last Light Redux (2014, DX11)
Prev Page Battlefield 4 (2013, DX11) Next Page Grand Theft Auto V (2015, DX11)-
Tmanishere If you compare the cost of Freesync monitor vs G-sync monitor, AMD usually edges over Nvidia in terms of performance vs cost.Reply -
bloodroses A comparison of cards a couple generations old would be a good article as well since these cards are still considered current. It's a pretty common myth that AMD has better support long term whereas Nvidia either drops decent (or even cripples) support on any hardware that isn't current gen. It would be interesting to see the validity in it.Reply -
jimmysmitty Reply21214234 said:i still go for AMD to keep a competitor alive
Only if the price is right. I can't even understand anyone who bought an AMD card when the crypto-currencies were inflating the price to insane levels.
21214277 said:If you compare the cost of Freesync monitor vs G-sync monitor, AMD usually edges over Nvidia in terms of performance vs cost.
True but then the monitor isn't part of the GPU nor is affected by drivers. If thats an important metric for someone then yes it helps. However it doesn't help AMD perform better.
21214328 said:A comparison of cards a couple generations old would be a good article as well since these cards are still considered current. It's a pretty common myth that AMD has better support long term whereas Nvidia either drops decent (or even cripples) support on any hardware that isn't current gen. It would be interesting to see the validity in it.
I don't think there is any validity to it. Its probably came about when new GPUs get released newer drivers sometimes rarely have updates for older hardware. This isn't exclusive to nVidia. I ran ATI then AMD GPUs for 10 years and plenty of times new drivers would come out and performance gains would only apply to new GPUs and not my 1 or 2 gen old GPU.
I do think nVidia has more driver releases than AMD. However driver updates and performance gains all depend. It depends on which games each company focuses on. That might be why some gains are better for each in some games. -
Peter Martin oh yeah, I only buy on good deals.. lol, I don't understand anyone always having to have the latest either. I can wait a few yrs to play video games affordably.Reply -
Johnny Baker I will always favor AMD over Nividia any day. I am not impressed at all by what people claim to be facts. All I can tell you: I'm and AMD freak, always will be, and proud of it.Reply -
derekullo This article reminded me of a quote in another article from a decade ago.Reply
"AMD and Nvidia release numerous driver builds every year. If each of these drivers were to increase 3D speed by 10 percent, the graphics cards would double their performance in a few months. "
https://www.tomshardware.com/reviews/GeForce-Catalyst-overclocking,2037.html
They backtrack a little bit, but I still laugh when I see Nvidia/AMD report an increase of 10% on every little driver update.
For a trip down memory lane and a display of how the chart making skills at Tom's has improved let me reintroduce;
https://www.tomshardware.com/reviews/GeForce-Catalyst-overclocking,2037-14.html -
Matt_550 Should've opted just for the 580X vs 1060 comp since the 480X had to be nurfed because of the failure of its power delivery system that was upgraded for the 580X.Reply -
jimmysmitty Reply21214551 said:This article reminded me of a quote in another article from a decade ago.
"AMD and Nvidia release numerous driver builds every year. If each of these drivers were to increase 3D speed by 10 percent, the graphics cards would double their performance in a few months. "
https://www.tomshardware.com/reviews/GeForce-Catalyst-overclocking,2037.html
They backtrack a little bit, but I still laugh when I see Nvidia/AMD report an increase of 10% on every little driver update.
For a trip down memory lane and a display of how the chart making skills at Tom's has improved let me reintroduce;
https://www.tomshardware.com/reviews/GeForce-Catalyst-overclocking,2037-14.html
Those 10% though ar enot for the same game every time. If you read driver notes they typically state what performance gains you might see on what game and what hardware.
There is very rarely a just generic across the board performance improvement for all games. Now if the companies could focus on say just the API and improve the performance on DX12 then that could apply to DX12 titles but it still does not work that way unfortunately.
