Why you can trust Tom's Hardware
Protection Features
Check out our PSUs 101 article to learn more about PSU protection features.
|
Protection Features | |
|
OCP |
12V1: 36.6A (203.33%), 11.815V |
|
OPP |
866.56W (133.32%) |
|
OTP |
✓ (174°C @ 12V heat sink) |
|
SCP |
12V: ✓ |
|
PWR_OK |
Proper Operation |
|
NLO |
✓ |
|
SIP |
Surge: MOV |
The OCP triggering points are sky-high in all +12V rails, most likely to be able to cope with power spikes. This defeats the purpose, though, of protecting against high currents, which can melt the cables and the connectors. The OCP triggering points are high on the minor rails, as well, and there is absolutely no reason for this because these rails are only lightly used. On the other hand, the OPP is set at a reasonable level, close to 130%, while OTP is a bit on the high side.
DC Power Sequencing
According to Intel’s most recent Power Supply Design Guide (revision 1.4), the +12V and 5V outputs must be equal to or greater than the 3.3V rail at all times. Unfortunately, Intel doesn't mention why it is so important to always keep the 3.3V rail's voltage lower than the levels of the other two outputs.
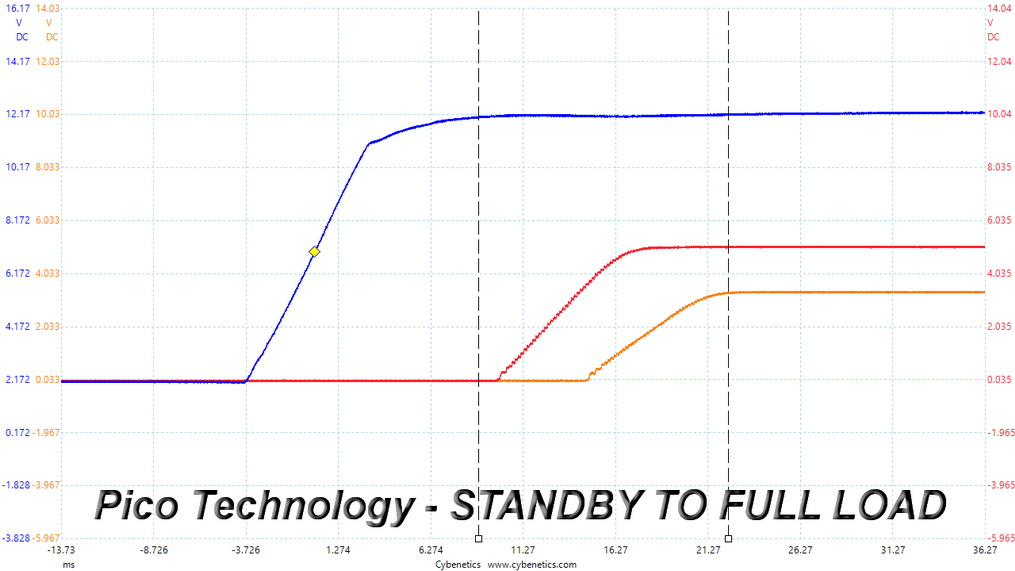
DC Power Sequencing Scope Shots
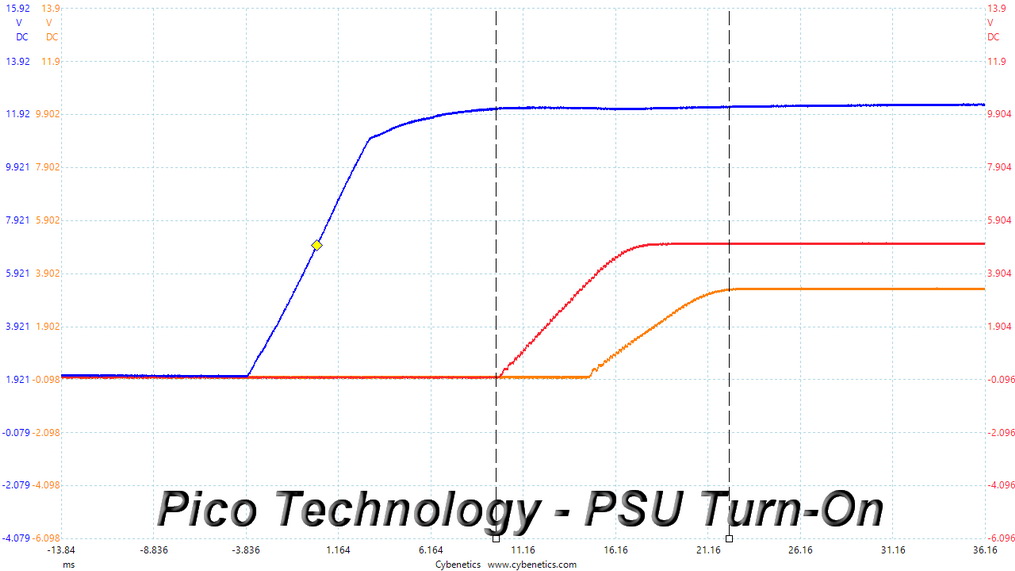
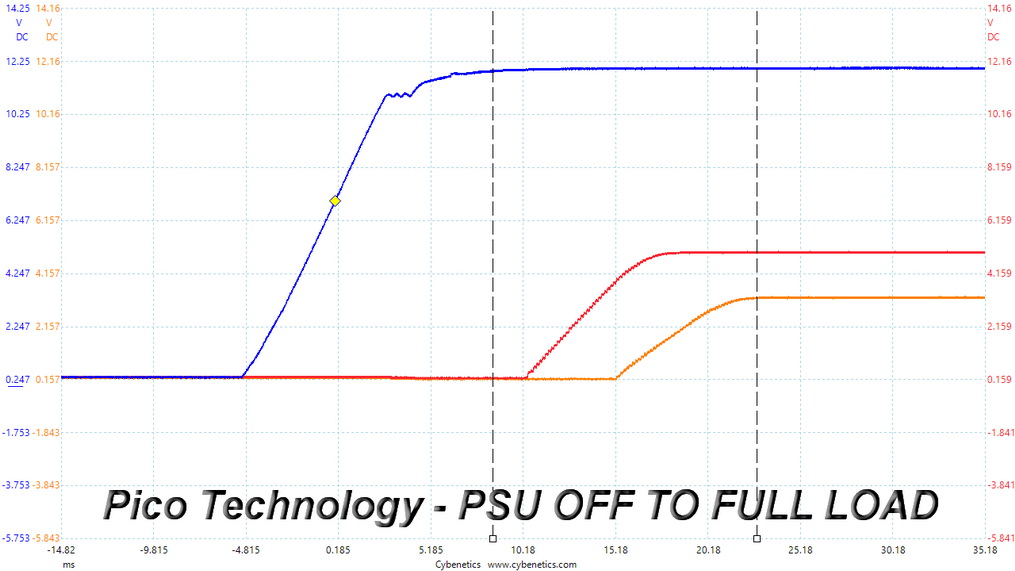
In all cases, the 3.3V rail is lower than the other two, so everything is fine here.
Cross Load Tests
To generate the following charts, we set our loaders to auto mode through custom-made software before trying more than 25,000 possible load combinations with the +12V, 5V, and 3.3V rails. The deviations in each of the charts below are calculated by taking the nominal values of the rails (12V, 5V, and 3.3V) as point zero. The ambient temperature during testing was between 30 to 32 degrees Celsius (86 to 89.6 degrees Fahrenheit).
Load Regulation Charts
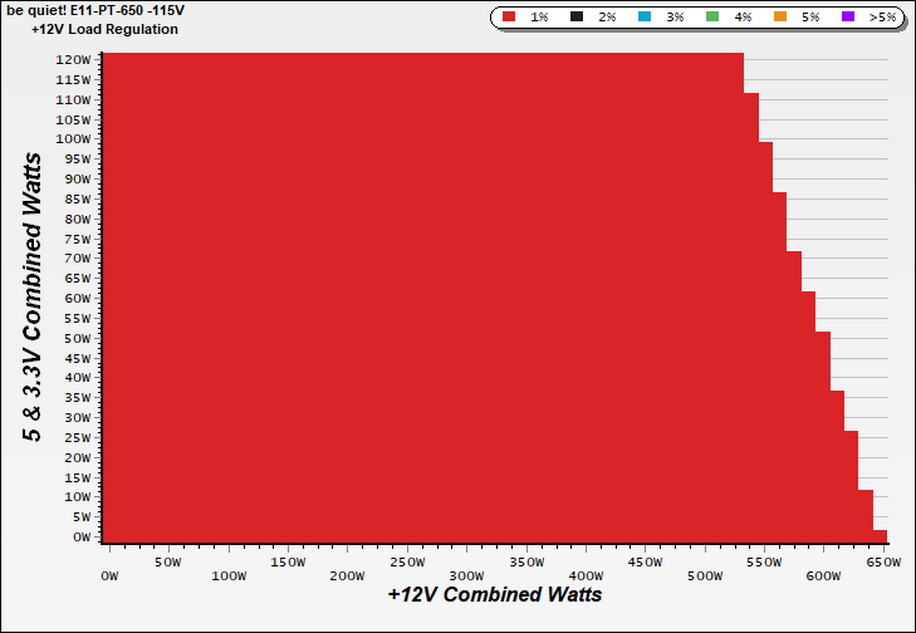
Load Regulation Charts
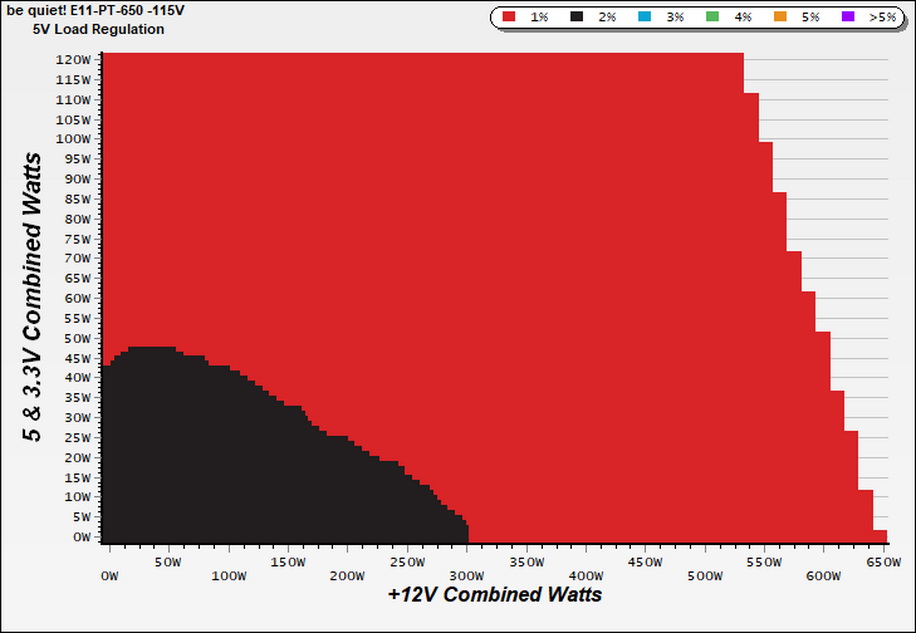
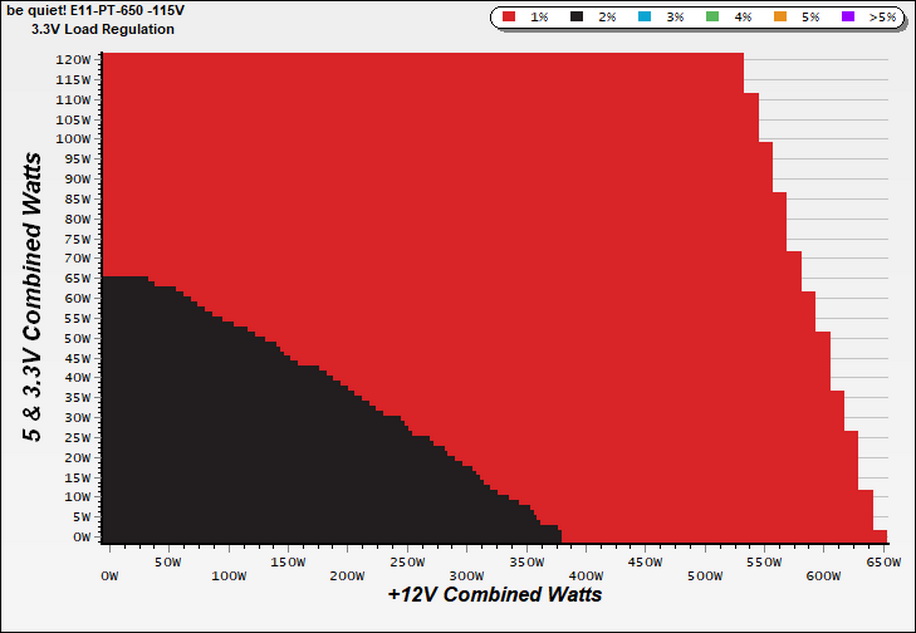
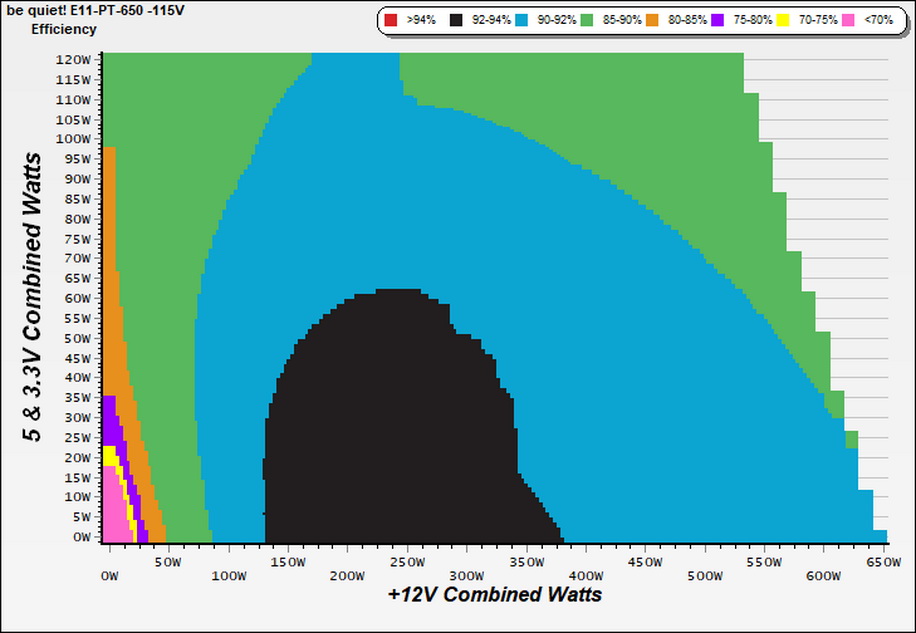
Efficiency Chart
Ripple Charts
The lower the power supply's ripple, the more stable the system will be and less stress will also be applied to its components.
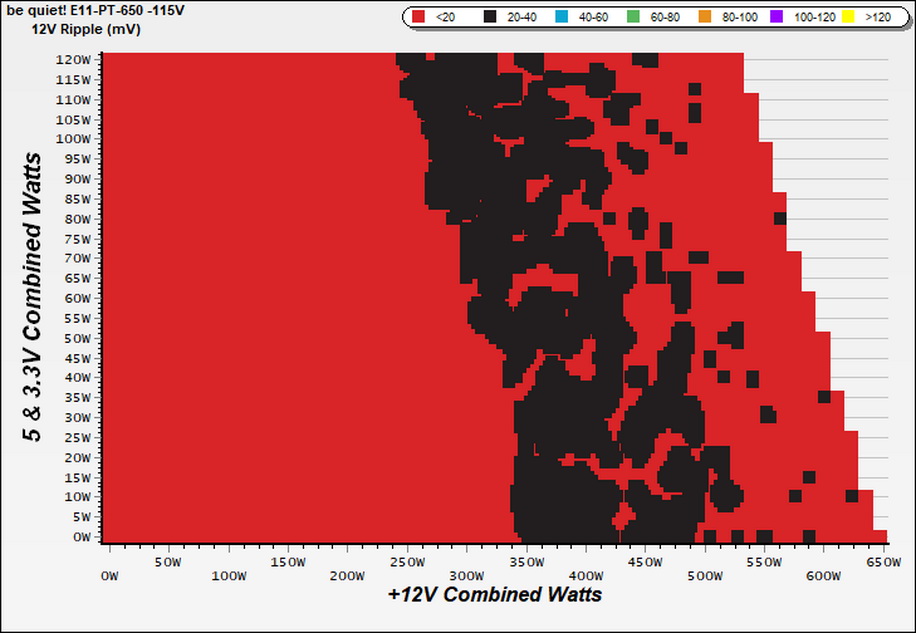
Ripple Suppression Charts
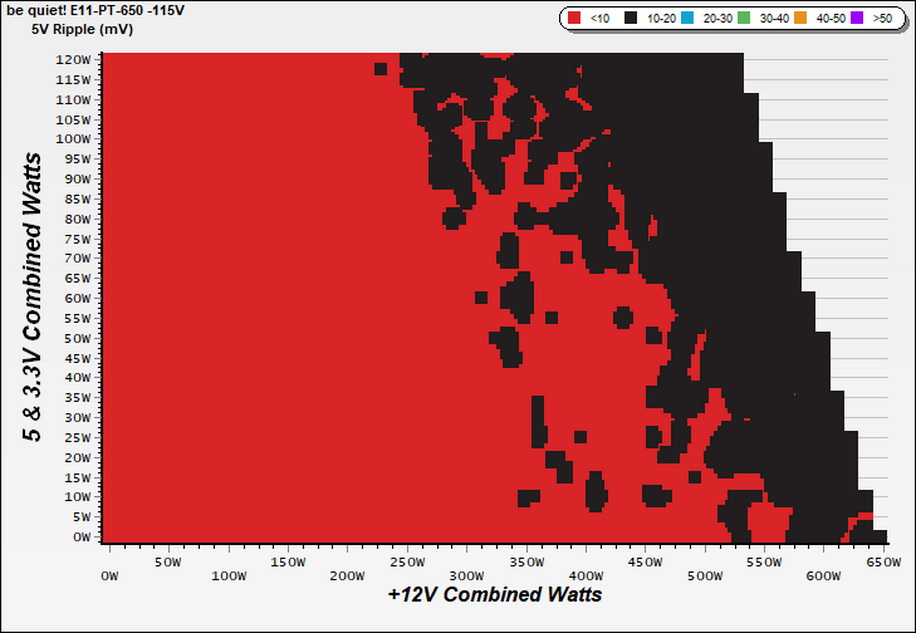
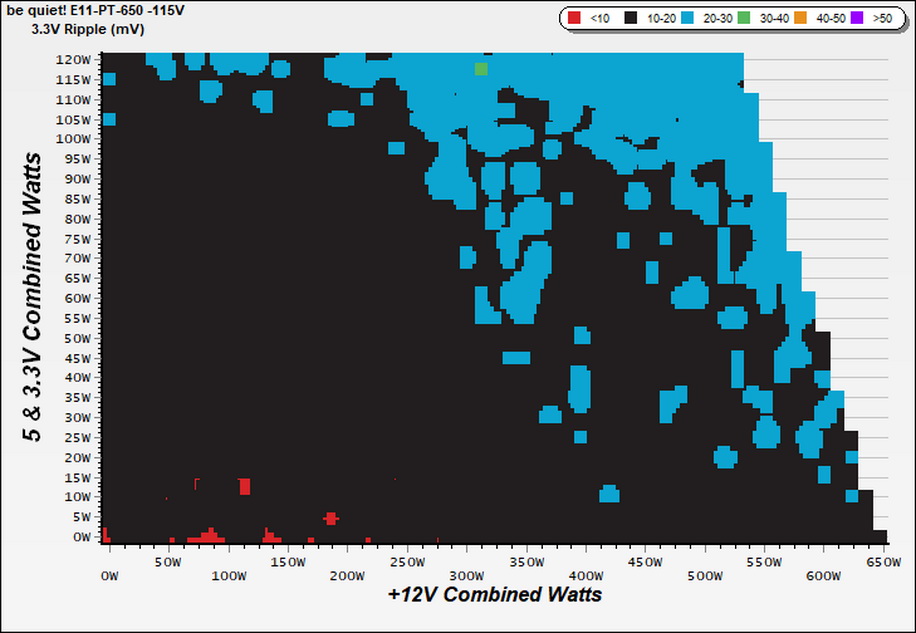
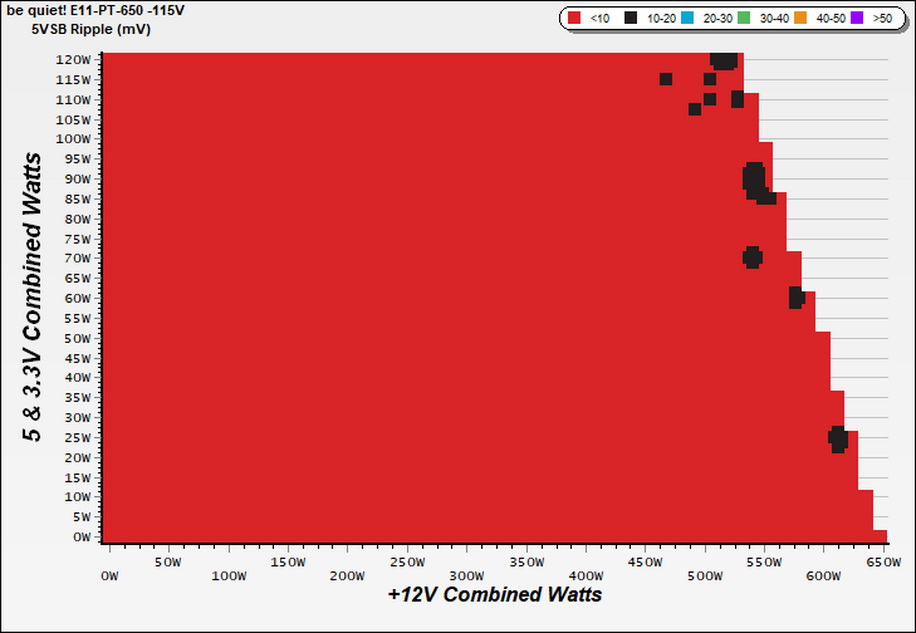
Infrared Images
We apply a half-load for 10 minutes with the PSU's top cover and cooling fan removed before taking photos with a modified FLIR E4 camera able to deliver an IR resolution of 320x240 (76,800 pixels).
Get Tom's Hardware's best news and in-depth reviews, straight to your inbox.
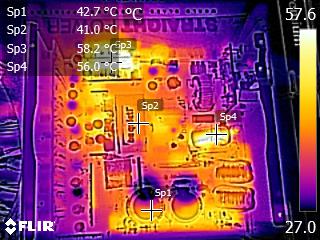
IR Images
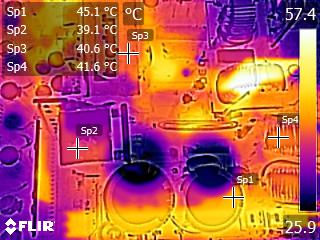
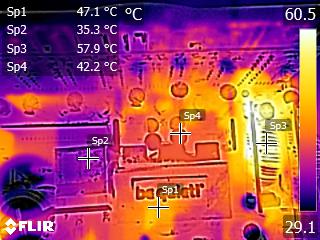
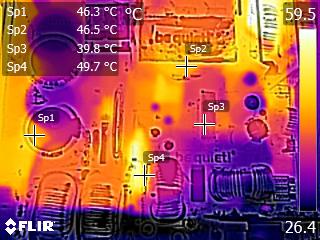
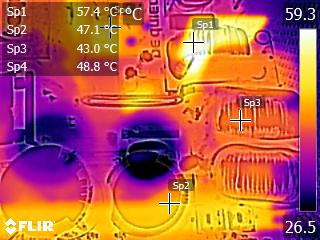
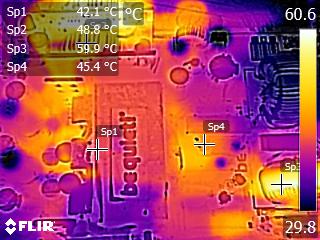
The temperatures are kept at normal levels, given the applied conditions.
MORE: Best Power Supplies
MORE: How We Test Power Supplies
MORE: All Power Supply Content
Current page: Protection Features, DC Power Sequencing, Cross-Load Tests and Infrared Images
Prev Page Load Regulation, Hold-Up Time, Inrush Current, Efficiency and Noise Next Page Transient Response Tests, Timing Tests, Ripple Measurements and EMC Pre-Compliance Testing
Aris Mpitziopoulos is a contributing editor at Tom's Hardware, covering PSUs.
-
emgarf Please consider providing sequencing and transient graphs for power-down as well as power-up. They are equally important.Reply
