System Builder Marathon, Dec. 2011: System Value Compared
Average Performance And Efficiency
Efficiency compares energy to work, and the easiest way to combine different units of work, such as frames per second (games), to seconds per frame (3ds Max) is to use a percent scale. The “slowest” configuration sets the baseline.
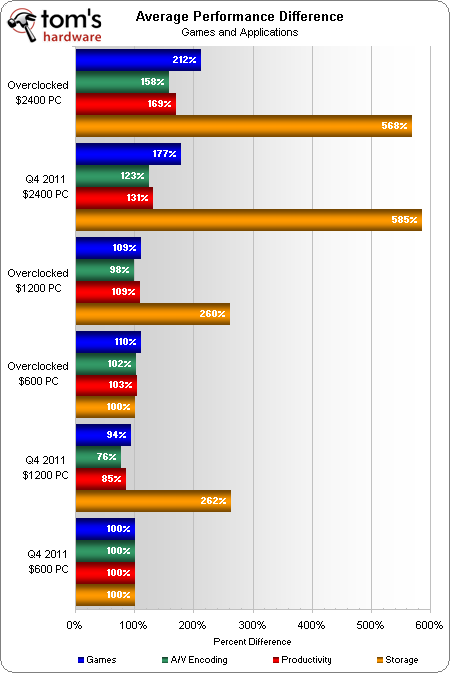
Almost incredibly, good storage performance is the only thing that prevents the $1200 PC from falling behind the $600 build at stock settings!
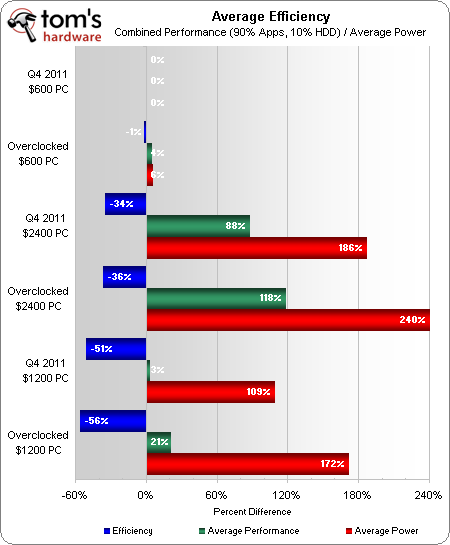
Most users benefit less quantifiably from a fast drive than a fast CPU or graphics card, so we weighed the above average scores in an overall performance calculation that gave storage 10 percent of the total. Encoding, games, and productivity suites comprise the other 90%. The resulting performance comparison is shown in the center (green) bar of our efficiency chart, with the baseline zeroed by subtracting 100% from every configuration.
Using the weakest configuration as the baseline for both performance and power calculations and dividing those results shows how much more or less efficient the other configurations turn out to be. We again zeroed out the chart by subtracting 100% from each calculation.
At 118% above baseline performance, the most powerful overclocked $2400 PC consumes 240% more power that its weakest rival, for a 36% loss in efficiency. It appears that an increase in memory voltage alone was enough to push down the efficiency of the overclocked $600 PC, which we actually expected to go up.
Current page: Average Performance And Efficiency
Prev Page Power And Heat Next Page Which One Of These Builds Is For You?Get Tom's Hardware's best news and in-depth reviews, straight to your inbox.
-
Darkerson I dont even know what to say about how screwed up the Bulldozer build is. The fact that a build that cost half as much can spank it in most regards is just sad. I hope AMD is able to save some face when the revised Bulldozers come out, but sadly, it will be too late for me.Reply
Edit: Fixed typo. Oops :p -
Dacatak DarkersonI dont even know what to say about how screwed up the Bulldozer build is. The fact that a build that cost half as much cant spank it in most regards is just sad. I hope AMD is able to save some face when the revised Bulldozers come out, but sadly, it will be too late for me.Reply
I'm guessing you meant "can" spank.
And spank it does. -
Darkerson Reply
Yeah, thats what i meant.9524931 said:I'm guessing you meant "can" spank.
And spank it does. -
zloginet Just curious how 2x 6950s loose to a 580.... My AMD 1100t @ 4.2 with a MSI R6970 Twin FrozrIII isn't much behind a 580... This is a joke.Reply -
zloginet zloginetJust curious how 2x 6950s loose to a 580.... My AMD 1100t @ 4.2 with a MSI R6970 Twin FrozrIII isn't much behind a 580... This is a joke.Reply
NM, the original part of the thread I thought I read 1x 580, now I see 2x... -
zloginet zloginetNM, the original part of the thread I thought I read 1x 580, now I see 2x...Reply
I need to reply once more... 2x 6950s and a extremely overclocking BD 6100 with only a 650watt ps? These fuggen builds suck
-
slicedtoad Reply
whats the matter with 650W?9524937 said:I need to reply once more... 2x 6950s and a extremely overclocking BD 6100 with only a 650watt ps? These fuggen builds suck
gaming tdp of 6950s = max 160 * 2 = 320
bd 6100 95W officially.
320 + 160 = 480
overclocking won't need more than an extra 100W max.
nothing else uses much power. These are budget builds, they're not made for upgradeability.
EDIT: LOL, I just looked at your profile. Your system has a 1200W PSU for one 6970.
I'm laughing, yet cringing at the waste of money. -
silverblue There is something horribly wrong with putting multiple GPUs on Bulldozer. I've seen time and time again that a single GPU is generally the faster option. Probably would've made more sense to have the FX6100 build as the $600 one and elevated the $600 build to a dual-GPU config as the CPU can actually cope.Reply
I think we need a single/multiple GPU article to find out if there's anything that can be rescued from this. Throw in a couple of different motherboards, that sort of thing. Does memory speed make a big difference? Would Windows 8 Beta help in any way?


