System Builder Marathon: Performance & Value
Conclusion
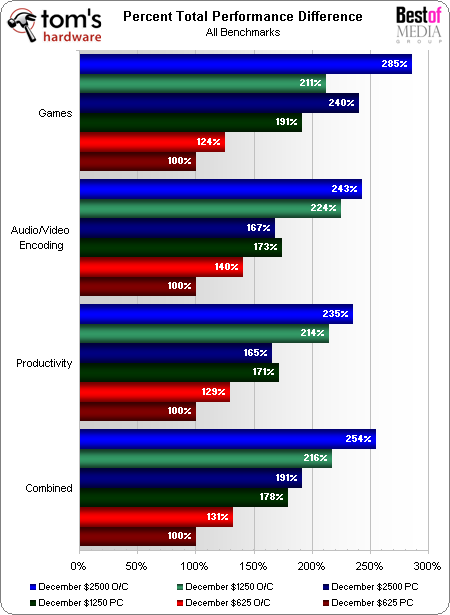
Combining applications by type allows us to easily assess the relative performance of each system in a single chart.
As we’d hoped, performance scales directly to dollars spent, but not proportionally. Performance increases are almost linear whereas build-cost increases are exponential. Doubling our $625 PC budget produced a 78% performance gain in the $1,250 PC, but doubling the $1,250 budget gave our $2,500 PC only a measly 13% gain. Overclocking helped the $2,500 PC more than the rest, but the value of high-end systems is always somewhat questionable.
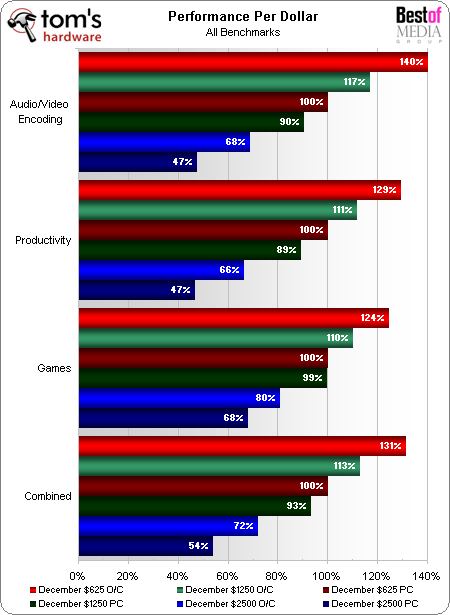
Using our $625 system at stock speed for the basis of comparison, we calculated performance per dollar spent for each configuration.
While our performance chart clearly shows nearly-linear performance boosts as a function of exponential cost increases, everything is turned upside with our value chart, in which the hierarchy is now in reverse order and the cheaper machines dominate. Overclocking improved our $625 PC’s value by 31%. Meanwhile, our $1,250 PC started with only 93% of the $625 system’s value and only reached 113% of that value when overclocked. Worse still, our $2,500 PC had only 54% of the $650 system’s value at stock speed and climbed to a final value score of only 72% when overclocked.
The $625 system is a great choice for true value-seekers on extremely tight budgets. While its gaming performance is barely adequate in many of our tests, we’re certain that choosing lower details will help owners to justify the ratio of performance lost to money saved.
With 94% of the value of the cheapest system, our $1,250 PC appears to be the best solution for performance seekers with medium budgets-–builders who can’t quite afford it could justify waiting a few weeks to save up for the parts, while those with slightly larger budgets can happily put the left-over money into other projects.
We saw huge performance leads in many benchmarks from our $2,500 PC, but none of those gains were large enough to offset its enormous price tag. Still, we’re sure that there are a few gamers who will appreciate the added performance of its 3-way SLI configuration, a system that beat two HD 4870 X2 graphics cards in most games at resolutions up to 1920x1200 pixels.
But what about the 2560x1600 resolution for which our previous $4,500 PC was designed? We've already seen how value further suffers in our comparison of $2,500 and $4,500 builds. An overwhelming number of readers demanded an enthusiast-level system they could actually afford, and we simply didn't have enough time or money to add a fourth PC to this month's comparison. Each month Tom's Hardware reconsiders its budgets based on reader feedback, and our highest-priced system budget is the most flexible. We’d love to do another "elite-enthusiast" build, so don't be afraid to voice your opinion.
Get Tom's Hardware's best news and in-depth reviews, straight to your inbox.
-
one-shot My e6750 @ 3.7Ghz and ATI 4850 look kind of slow compared to these i7 based systems. :(Reply -
skora Taken from Dec $625 SBM conclusion:Reply
Those who don’t want to go back and compare old charts will need to wait for the Performance Analysis to see how the two systems compare in straight-out gaming performance.
Last line of the Dec $625 SBM:
All that’s left now is to see how this system compares directly to last month's build and also to the other two more-expensive systems.
So where is the head to head Dec vs Nov $625 analysis?
-
Crashman Reply9467210 said:Taken from Dec $625 SBM conclusion:
Those who don’t want to go back and compare old charts will need to wait for the Performance Analysis to see how the two systems compare in straight-out gaming performance.
Last line of the Dec $625 SBM:
All that’s left now is to see how this system compares directly to last month's build and also to the other two more-expensive systems.
So where is the head to head Dec vs Nov $625 analysis?
Great question. The answer is unfortunate: There was a miscommunication between the $625 system editor and all the other editors. -
SirSuperSouthern ReplyThe GTX 260 Core 216 triple threat allowed our $2,500 monster to chew through frames even at our highest setting.
No it didn’t. Both Crysis and Supreme Commander were unplayable at 25x16 (TRUE highest setting), whereas they both had acceptable FPS in October’s build that paired two 4870X2s. The proof is sitting in this month’s $2,500 article, where the same group of games was compared to October’s “high-end” build @ 25x16. The final conclusion is simply not accurate as a result.
Real conclusion:
GPUs are currently experiencing an awkward, gangly teenage phase. They still desperately need to bulk up on GDDR5 RAM before they can be taken seriously, as evidenced by the one set of benchmarks brave enough to tell the embarrassing truth.
Gaming @ 25x16 with 4xAA puts enormous strain on the GPUs RAM, which is why the 4870X2s were playable at that resolution while the 260s were not. The 260s GPU is obviously not the problem, it’s a good chip; but it only has 896MB of GDDR3 RAM which is completely inadequate for moving such a large payload. Its like trying to fit a bowling ball inside a garden hose.
That said, spending $1,000 on two 4870X2s is not a very attractive option either. The next round of cards will have a minimum of 2GB GDDR5 RAM, possibly even 4, we’ll have to wait and see. You’ll be able to get better performance from one while at the same time saving a good deal of power.
The bottom line is that if your goal is to run the most demanding games @ 25x16 with AA cranked, you best move is, sadly, to wait. I don’t like using that four-letter-word, but I thinks its appropriate in this case. Not only is the current line-up of GPUs RAM deficient, but Intel is coming out with a proper socket for its new LGA 1366 CPUs mid-’09. By that time prices will have dropped on not only the CPUs, RAM and motherboards, but the ABS Canyon 695 PC case might drop a few hundred dollars as well…
-
V3NOM ReplyThe dreaded power consumption test will surely disappoint fans of Intel's new Core i7, as these new processors are extremely power-hungry when overclocked.
-
coopchennick SirSuperSouthern,Reply
I've read through all of your posts on the other articles and while I do agree with you that the best option now is probably just to wait, I don't really see an immediate solution from you. In the mean time, the articles must be made. I enjoy reading through these articles each month and I think THW did pretty much the best they could do -of course except for the RAM- at this particular time with the given budget marks (which have been chosen due to popular demand).
Another thing is that the 4870's GDDR5 isn't benefiting the card any more than a 280's GDDR3 because of the narrower bus. Your bowling ball analogy works better for the 4870 - what must be limiting the 260 at 2560x1600 more so (as you pointed out) is the amount of memory.
Overall, I enjoyed this set of articles - toying with the i7 and whatnot. Though we could have been a little more "mature" (supersouthern v crashman), I like to see these discussions flare up.
Next month, screw the benchmarks and go with x64.
I kind of like these price points how they are. Maybe I'm nuts but I don't find it as exciting to spend as much money as you can on each and every component rather than sticking to a (somewhat high for the "enthusiast" build) budget and seeing what type of performance I can get out of that. With the insano-crazy expensive builds, it always seems to me that they are just a little bit unimpressive considering the money spent, and totally impractical for gaining any knowledge for the majority of discerning computer builders who visit this site.
Thanks for the articles


