Corsair HX1000 PSU Review
Why you can trust Tom's Hardware
Cross-Load Tests & Infrared Images
Our cross-load tests are described in detail here.
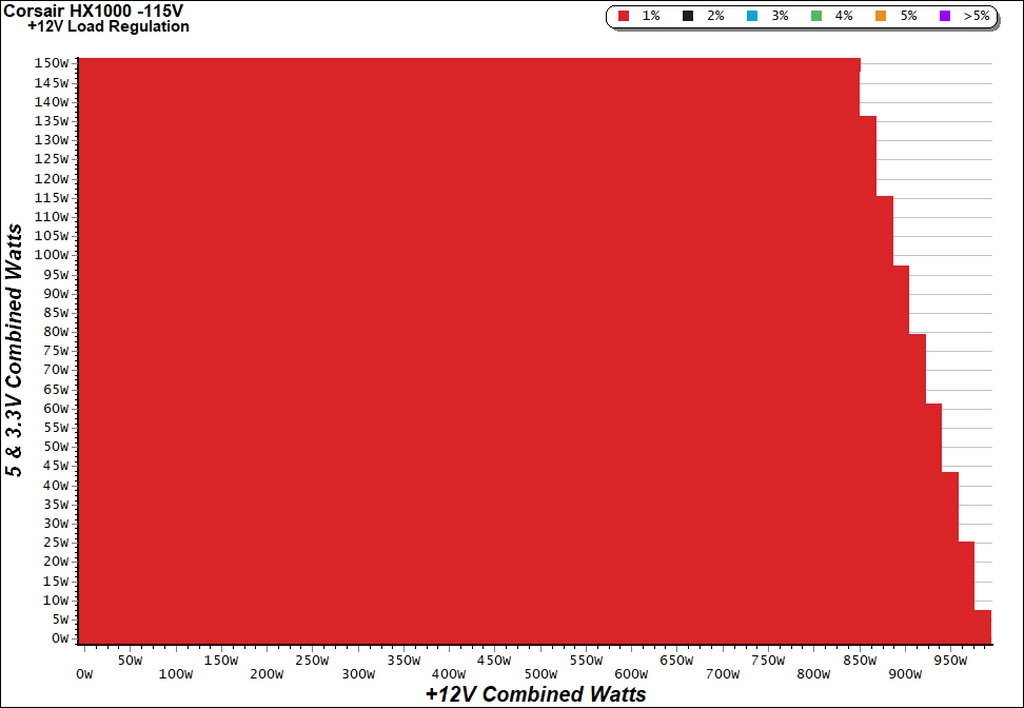
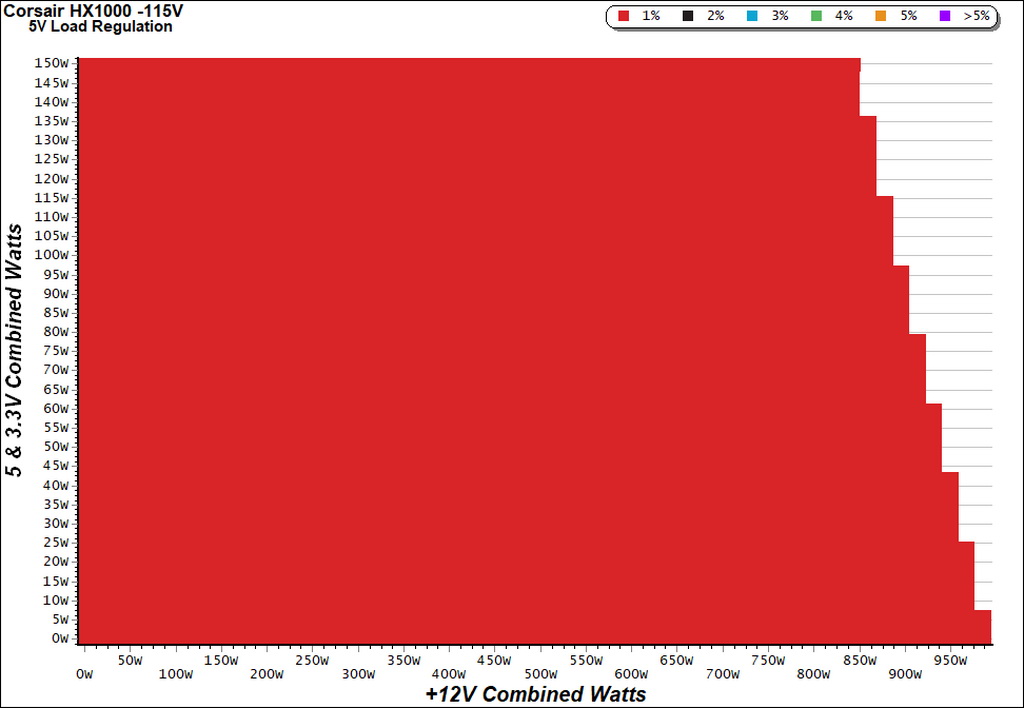
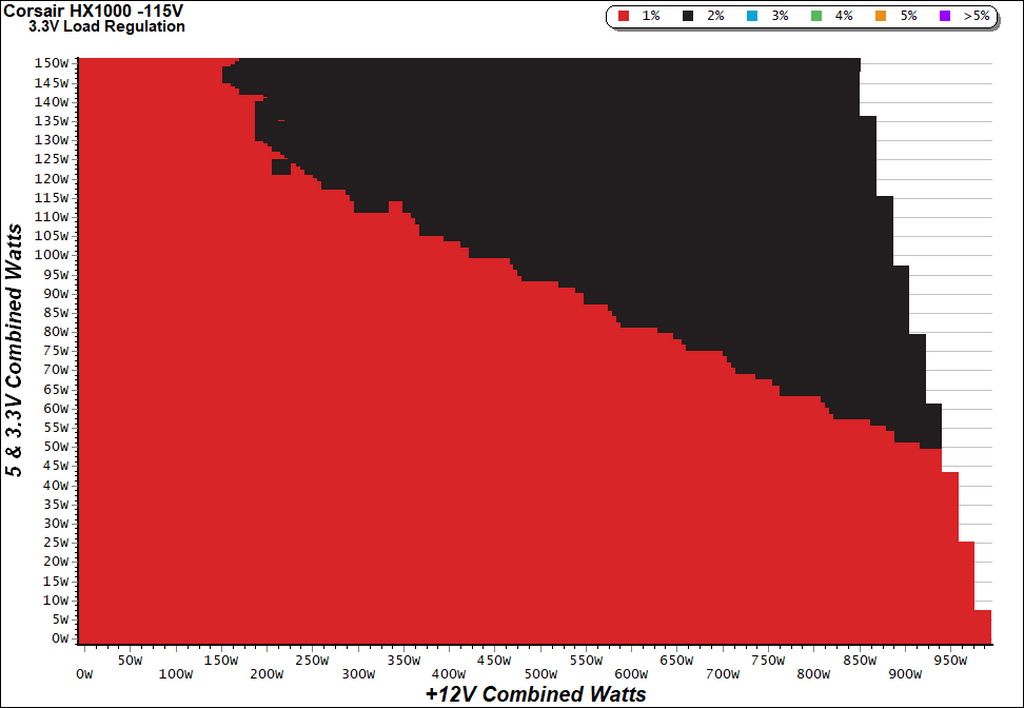
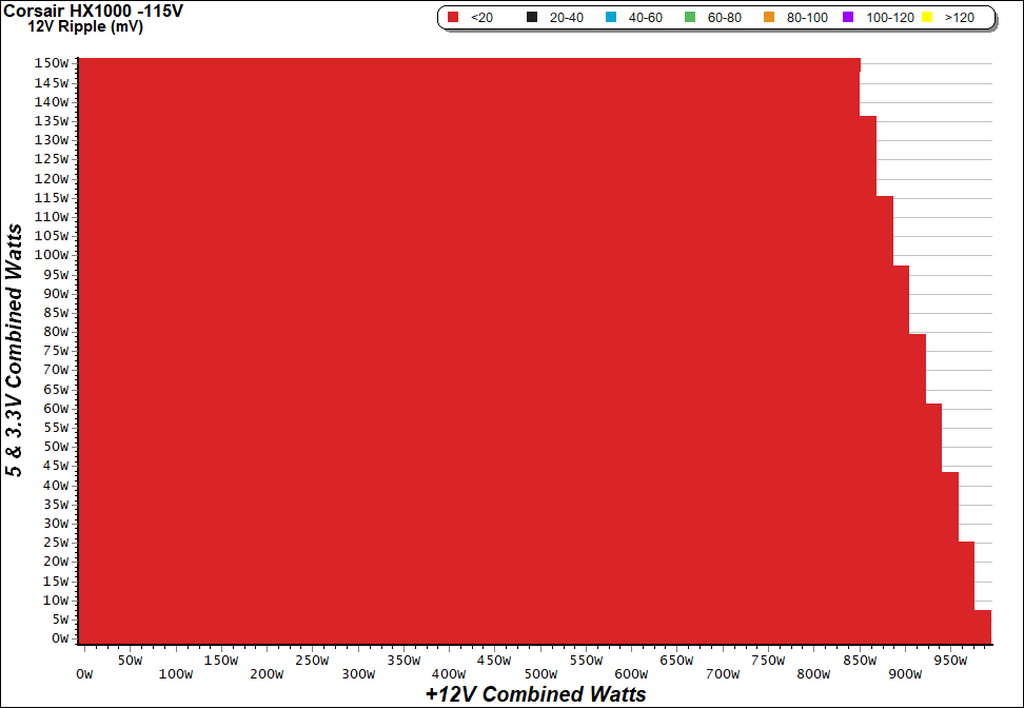
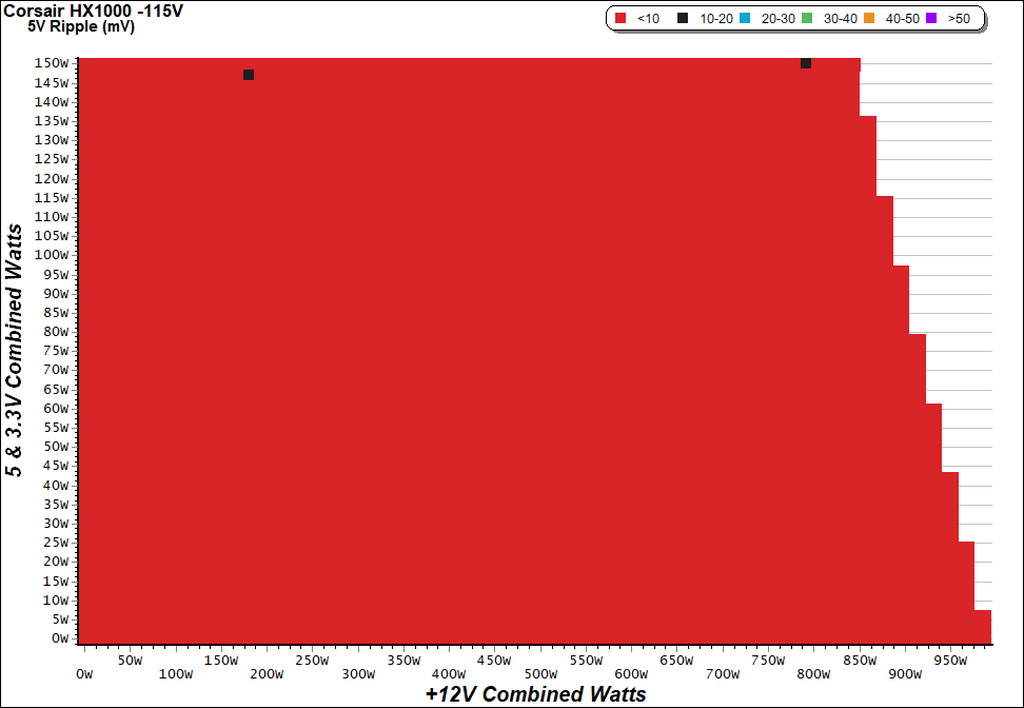
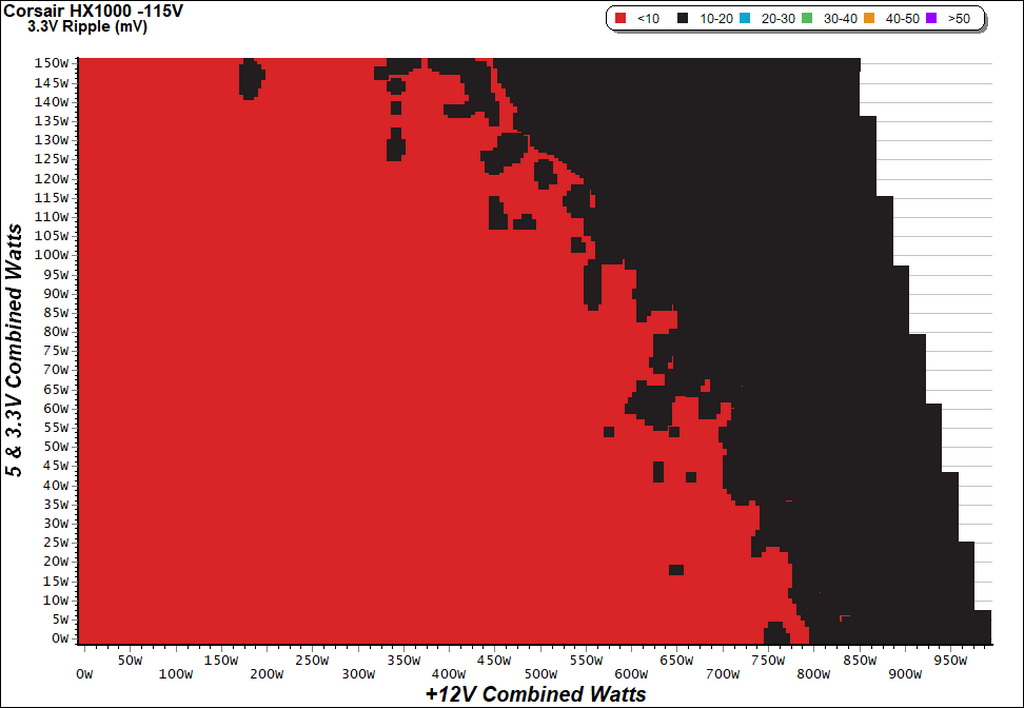
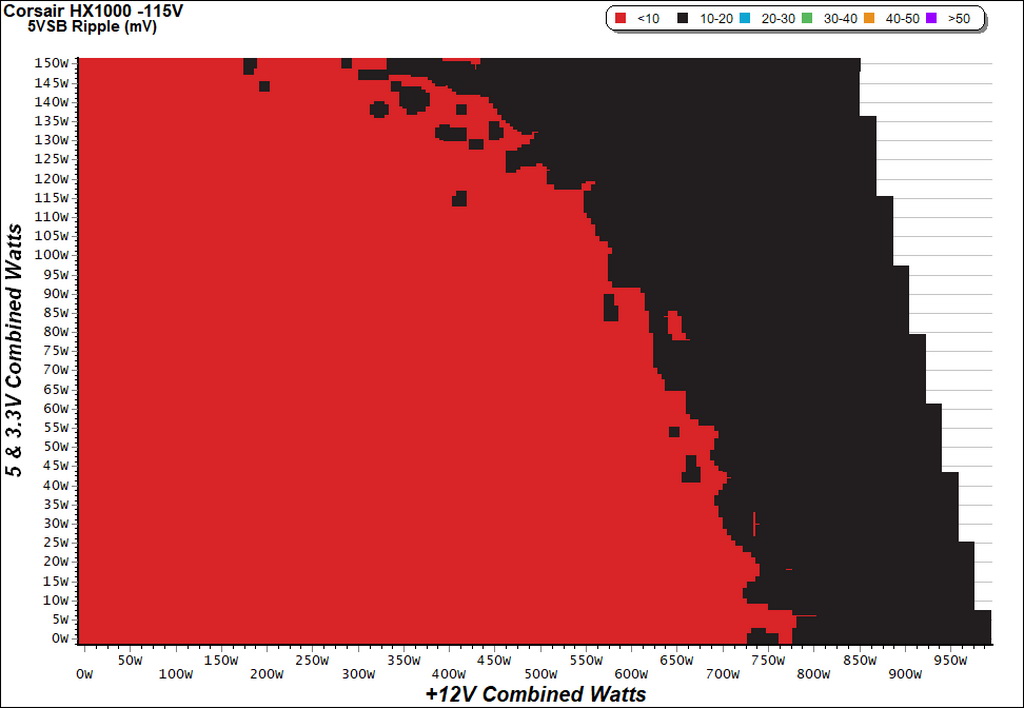
To generate the following charts, we set our loaders to auto mode through our custom-made software before trying more than 25,000 possible load combinations with the +12V, 5V and 3.3V rails. The load regulation deviations in each of the charts below were calculated by taking the nominal values of the rails (12V, 5V and 3.3V) as point zero. The ambient temperature was between at 30°C (86°F) to 32°C (89.6°F).
Load Regulation Charts
Efficiency Chart
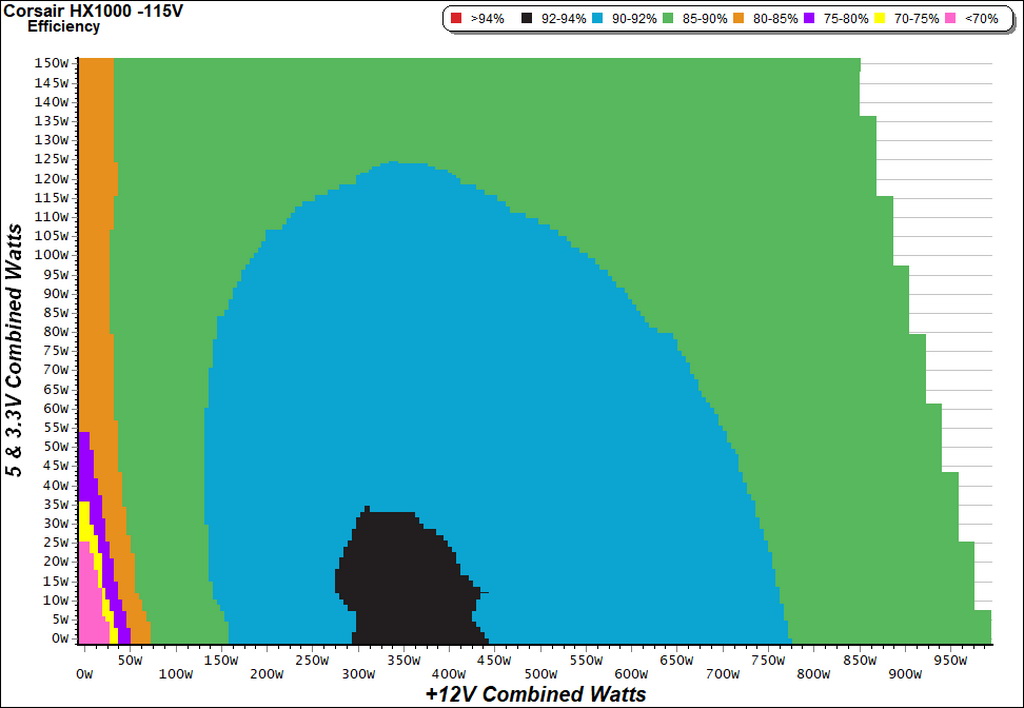
For a small part of the PSU's operating range, its efficiency levels land between 92-94%. The second large area on the efficiency map depicts a 90-92% range, while the green region, which is pretty large as well, indicates efficiency from 85-90%.
Ripple Charts
Infrared Images
We applied half-load for 10 minutes with the PSU's top cover, along with its cooling fan, removed before taking photos with our modified FLIR E4 camera that delivers 320x240 IR resolution (76,800 pixels).
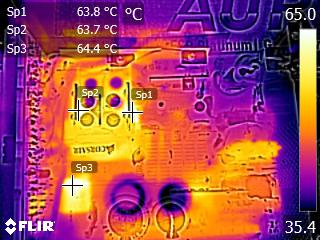
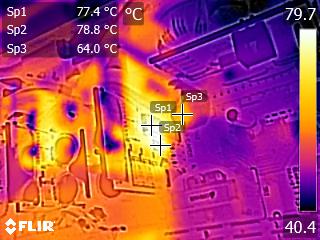
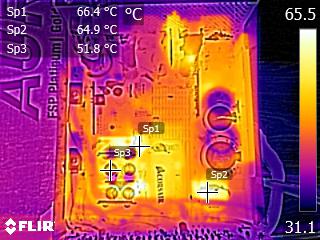
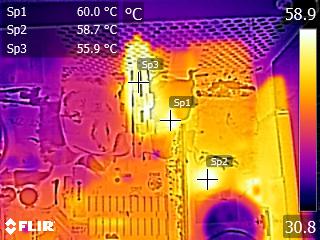
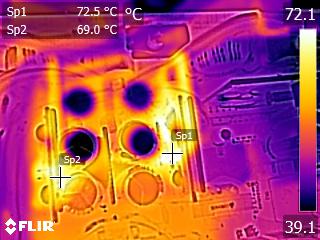
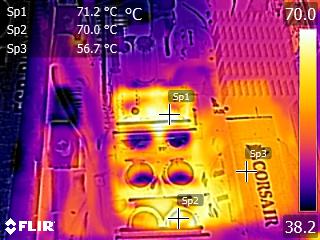
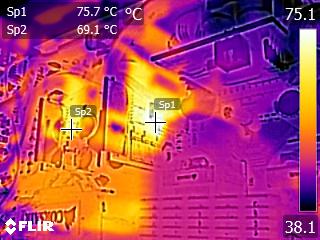
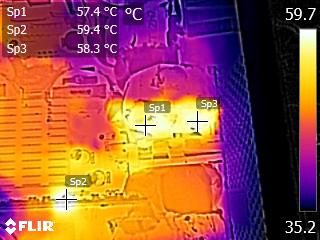
The +12V FETs get as warm as 76°C, so apparently those bus bars on the vertical boards do a good job maintaining reasonable operating temperatures. The filtering caps between the two boards with the +12V FETs, however, endure a bit more thermal stress. It's only when the fan is spinning that they avoid heat build-up.
MORE: Best Power Supplies
MORE: How We Test Power Supplies
Get Tom's Hardware's best news and in-depth reviews, straight to your inbox.
MORE: All Power Supply Content
Current page: Cross-Load Tests & Infrared Images
Prev Page Protection Features Next Page Transient Response Tests
Aris Mpitziopoulos is a contributing editor at Tom's Hardware, covering PSUs.
-
samer.forums Can any one explain to me why we need such high end expensive power supplies for PCs ?Reply
I Overclock my PC fully , and I moved from (seasonic) Bronze grade power supply to Tier one expensive Titanium power supply and I did not gain anything in real life , nothing, Zero. the same performance and the same electric bill and both power supplies never failed.
Sure the better power supply on paper will give better results .. but they are way above the requirement of the PC hardware.
-
turkey3_scratch Reply20248574 said:Can any one explain to me why we need such high end expensive power supplies for PCs ?
I Overclock my PC fully , and I moved from (seasonic) Bronze grade power supply to Tier one expensive Titanium power supply and I did not gain anything in real life , nothing, Zero. the same performance and the same electric bill and both power supplies never failed.
Sure the better power supply on paper will give better results .. but they are way above the requirement of the PC hardware.
Overclocking the CPU is mostly dependent on the motherboard. It can be helped by having a better PSU, because in turn that makes it easier on the motherboard, but I wouldn't expect any major gains from getting a new power supply. I think it also depends on how much your CPU can overclock. People who are really pushing their CPUs to the maximum, they won the lottery and are really pushing it, they may benefit from a better PSU.
Your electric bill is only going to change depending on a lot of factors. Air conditioning and home appliances are going to take up 90% of your electric bill, and because the percentage of that bill making up your computer is so small it can almost be ignored at times. The change is so small that it is not distinguishable between your other household appliances most likely.
And getting a good PSU is not just for trying to help overclocking; a PSU with good performance will usually increase the lifespan of the rest of the computer, and one with bad performance will decrease the lifespan of the hardware. So if you plan on having your computer for many many years a good PSU is a good idea. If you plan on swapping parts every 1-2 years then PSU performance may be a lot less important to you.
Still, expensive PSUs have better build quality so the PSUs themselves are going to last longer, and if they're designed properly like this one they can be very quiet. Cheap PSUs can be loud. -
dstarr3 Reply20248805 said:20248574 said:Can any one explain to me why we need such high end expensive power supplies for PCs ?
I Overclock my PC fully , and I moved from (seasonic) Bronze grade power supply to Tier one expensive Titanium power supply and I did not gain anything in real life , nothing, Zero. the same performance and the same electric bill and both power supplies never failed.
Sure the better power supply on paper will give better results .. but they are way above the requirement of the PC hardware.
Overclocking the CPU is mostly dependent on the motherboard. It can be helped by having a better PSU, because in turn that makes it easier on the motherboard, but I wouldn't expect any major gains from getting a new power supply. I think it also depends on how much your CPU can overclock. People who are really pushing their CPUs to the maximum, they won the lottery and are really pushing it, they may benefit from a better PSU.
Your electric bill is only going to change depending on a lot of factors. Air conditioning and home appliances are going to take up 90% of your electric bill, and because the percentage of that bill making up your computer is so small it can almost be ignored at times. The change is so small that it is not distinguishable between your other household appliances most likely.
And getting a good PSU is not just for trying to help overclocking; a PSU with good performance will usually increase the lifespan of the rest of the computer, and one with bad performance will decrease the lifespan of the hardware. So if you plan on having your computer for many many years a good PSU is a good idea. If you plan on swapping parts every 1-2 years then PSU performance may be a lot less important to you.
Still, expensive PSUs have better build quality so the PSUs themselves are going to last longer, and if they're designed properly like this one they can be very quiet. Cheap PSUs can be loud.
That explains why one would buy high-quality PSUs, sure. But it doesn't explain why one would buy such high-wattage PSUs. Buying a 1000W PSU isn't going to benefit your machine if it only needs 500W on full load.
Now that 3- and 4-way SLI is on the outs, I can only assume it's just the miners that need so much wattage anymore. -
turkey3_scratch Reply20248811 said:That explains why one would buy high-quality PSUs, sure. But it doesn't explain why one would buy such high-wattage PSUs. Buying a 1000W PSU isn't going to benefit your machine if it only needs 500W on full load.
Now that 3- and 4-way SLI is on the outs, I can only assume it's just the miners that need so much wattage anymore.
Well you could take two overclocked 1080Tis, together those can be about 500W. Then if you have one of Intel or AMD's highest-end CPUs overclocked really well, that can be up to 150W probably if they have really good overclocks. Account for other stuff, probably around 725W under load. So in this case some people may buy a 1000W PSU, I don't know. But yeah, I see very few instances where someone would need one.
And some people do believe that buying a bit higher of a wattage will help it last longer. Whether true or not probably depends on a lot of factors like how the fan behaves and efficiency and other stuff.
But usually I like to get a PSU with better build quality and lower wattage than one with slightly less good build quality and higher wattage. -
padrescout It's the same reason Johnny Everyman buys a Dodge Hellcat. Nobody needs a 700 horsepower car to tool around town in. But some people like the image of having it. It implies things without saying anything and generally reflects positively on the owner in their social tribe.Reply
But mostly because a lot of people have more money than brains. -
turkey3_scratch Reply20249162 said:It's the same reason Johnny Everyman buys a Dodge Hellcat. Nobody needs a 700 horsepower car to tool around town in. But some people like the image of having it. It implies things without saying anything and generally reflects positively on the owner in their social tribe.
But mostly because a lot of people have more money than brains.
Assuming everybody buys something for the same reason isn't very reasonable. -
samer.forums Reply20248805 said:20248574 said:Can any one explain to me why we need such high end expensive power supplies for PCs ?
I Overclock my PC fully , and I moved from (seasonic) Bronze grade power supply to Tier one expensive Titanium power supply and I did not gain anything in real life , nothing, Zero. the same performance and the same electric bill and both power supplies never failed.
Sure the better power supply on paper will give better results .. but they are way above the requirement of the PC hardware.
Overclocking the CPU is mostly dependent on the motherboard. It can be helped by having a better PSU, because in turn that makes it easier on the motherboard, but I wouldn't expect any major gains from getting a new power supply. I think it also depends on how much your CPU can overclock. People who are really pushing their CPUs to the maximum, they won the lottery and are really pushing it, they may benefit from a better PSU.
Your electric bill is only going to change depending on a lot of factors. Air conditioning and home appliances are going to take up 90% of your electric bill, and because the percentage of that bill making up your computer is so small it can almost be ignored at times. The change is so small that it is not distinguishable between your other household appliances most likely.
And getting a good PSU is not just for trying to help overclocking; a PSU with good performance will usually increase the lifespan of the rest of the computer, and one with bad performance will decrease the lifespan of the hardware. So if you plan on having your computer for many many years a good PSU is a good idea. If you plan on swapping parts every 1-2 years then PSU performance may be a lot less important to you.
Still, expensive PSUs have better build quality so the PSUs themselves are going to last longer, and if they're designed properly like this one they can be very quiet. Cheap PSUs can be loud.
I never had any power supply fails all my life ... last time I changed a power supply was for low voltage haswell issue and not because my old one died.
Even one of my Plus 80 (below bronze) powersupply lasted 7 years without any issues, I only buy Seasonic by the way and Corsair.
and for motherboards parts , they never failed as well
Life span is not a big deal when you buy a good brand that follow the standard specifications for the pc parts.
I still need a valid reason to convince me that buying an expensive powersupply is better in real life and not on paper. -
turkey3_scratch The original Seasonic-made Corsair HX power supplies from 2008, i.e. one like this, had RMA rated above 10% they were so unreliable (I received this info on the Jonnyguru forums a while back). So really you can't just go by brand. And you may have not had failures personally, but other people have. Personal experience does not dictate the broader spectrum.Reply -
samer.forums Reply20249230 said:The original Seasonic-made Corsair HX power supplies from 2008, i.e. one like this, had RMA rated above 10% they were so unreliable (I received this info on the Jonnyguru forums a while back). So really you can't just go by brand. And you may have not had failures personally, but other people have. Personal experience does not dictate the broader spectrum.
I am not talking about fail rate . I am talking about what I get for paying for high end powersupply and I want to see if they are overkill and not needed at all or not. fail rate is something else. you can get a cheap Bronze powersupply with low fail rate . -
Larmo-Ct For "future proofing", I always buy 1200 Watt PSUs.. As Tim the "Tool Man Taylor" in the old Home Improvement TV show, use to say.. "Mooore poowwerr!! Awh.. Awh..!" :-)Reply
