Crucial BX200 SSD Review
Micron announced its 16nm TLC flash five months ago, and Crucial's BX200 is the first product to take advantage of the extra bit per cell. Is this late-comer competitive, or is it overwhelmed in a sea of superior solid-state storage?
Why you can trust Tom's Hardware
Mixed Workload & Steady State
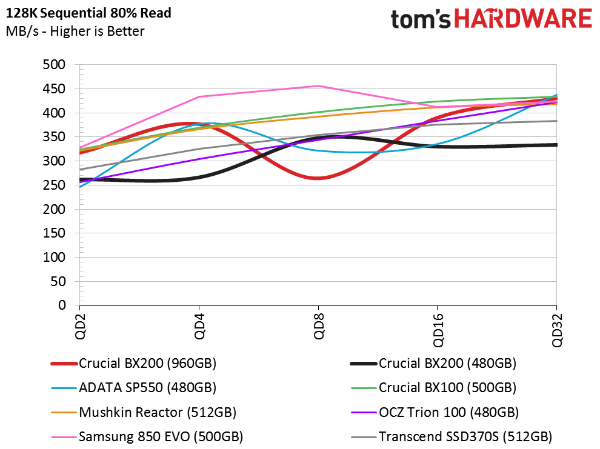
80 Percent Sequential Mixed Workload
The mixed workload results are more definitive than the 100 percent read and write tests. Rarely will you ever just read or just write data without mixing up the operations. According to an Intel document we have, an 80% read workload represents normal client use. So, we stick to that for measuring our blended test.
Again, the 480GB BX200 lands at the low end of our chart, with the SLC buffer causing performance variability.
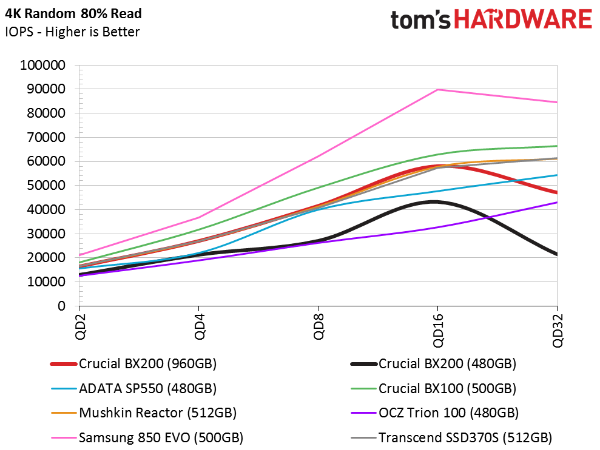
80 Percent Random Mixed Workload
Mixed random data yields similar results from the 480GB BX200, and the 960GB drive posts numbers that look a lot like the lower-capacity drives we tested.
Sequential Steady State
Our mixed sequential steady state tests tell us a lot about performance when the drives are nearly full. Without a lot of spare area to keep cells clean, the drive must perform more read/modify/write cycles. Nearly all of the TLC-based drives lose a lot of sequential write performance.
Random Write Steady State
While combing through the results, I looked at our random steady state numbers and was shocked to see the BX200 writing 4KB data at rates as low as 300 IOPS. We have 7200 RPM mechanical disks in the lab that fare better. None of us will ever get an SSD into steady state using random operations, but we use this metric to evaluate a drive's suitability in RAID. If the line is steady across the x-axis, there's less variation under load. Needless to say, though, Crucial's BX200 isn't a good choice for your next array.
Get Tom's Hardware's best news and in-depth reviews, straight to your inbox.
Current page: Mixed Workload & Steady State
Prev Page Four-Corner Testing Next Page Real-World Software Performance Testing
Chris Ramseyer was a senior contributing editor for Tom's Hardware. He tested and reviewed consumer storage.
-
SylentVyper These drives better come in a decent amount under the suggested price. The 850 Evo is constantly hitting those price points (or less) and prices have only been dropping. The 850 Evo is slightly faster on the sequential side, but far better with random read/write IOPS. You also get a better warranty, too.Reply -
mapesdhs Atm I don't see any reason to buy anything other than the 850 EVO atm in that budget range, they are priced so well. Bought a 250GB this week for my brother, it was only 63 UKP total from Amazon. Bought two 500GB units for myself for 117 each. Other vendors will have to move a lot in order to compete even on price, never mind performance & warranty.Reply
-
AndrewJacksonZA Did you duplicate the latency histogram pie charts for the BX200 960GB and the BX100 500GB? They're exactly the same.Reply
Thanks -
daglesj I love it when a manufacturer replaces a older model with a model that performs far worse. Time to snap up those excellent BX100's on clearance sales! How do companies screw up like this? Doesn't anyone do product testing and benchmarking before release anymore?Reply -
nforce4max I for once I almost no interest in current generation SSDs as I do not like TLC nand and not impressed with the performance in general. Just something to avoid when buying SSDs especially when it comes to the cheaper low capacity models for my projects. Last thing that I need is having to re-write everything every few months or suffer spinner level or worse performance (problem with planar TLC nand).Reply
For those who have been out of the loop or haven't bough their first SSD yet just avoid SSDs that use TLC unless it is 3D (stacked) and just pay a little more for MLC. -
Chris Droste Kinda Ridiculous when you can get the MX100 512GB w/ MLC NAND for $149. unless they're planning on making the 480gig a sub-$100 drive by the holidays this is a non-starter.Reply -
CRamseyer ReplyDid you duplicate the latency histogram pie charts for the BX200 960GB and the BX100 500GB? They're exactly the same.
Thanks
It's not a duplicate. The latency distribution is just the same for both. I'm working on fine tuning those charts a bit.
Also, you will notice that the bars on the side are different sizes even though it's still 0%. Data has fallen into those buckets but not more than 1%.
-
George Phillips Crucial's products are usually good, pretty fast, and very reliable. This one is an exception.Reply

