System Builder Marathon, Q4 2012: System Value Compared
Energy And Efficiency
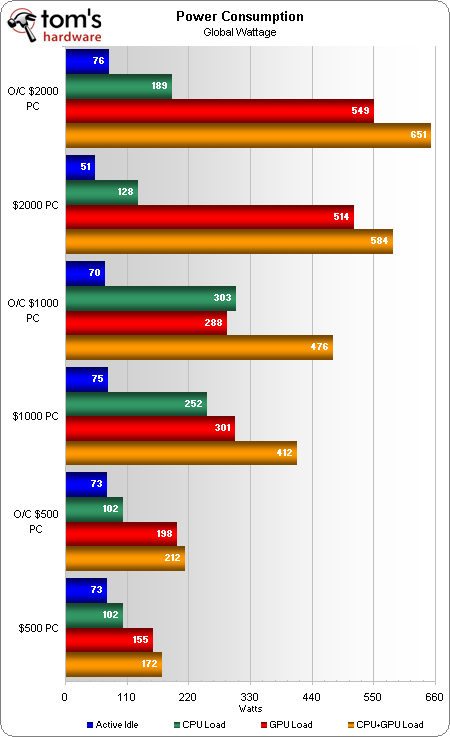
I’m always amazed when charted values create an almost linear evolution from our most affordable to our most expensive builds, even when that progression happens in power consumption.
Priced nearly four times as high as the $500 build, my $2,000 PC draws a little less than four times its power.
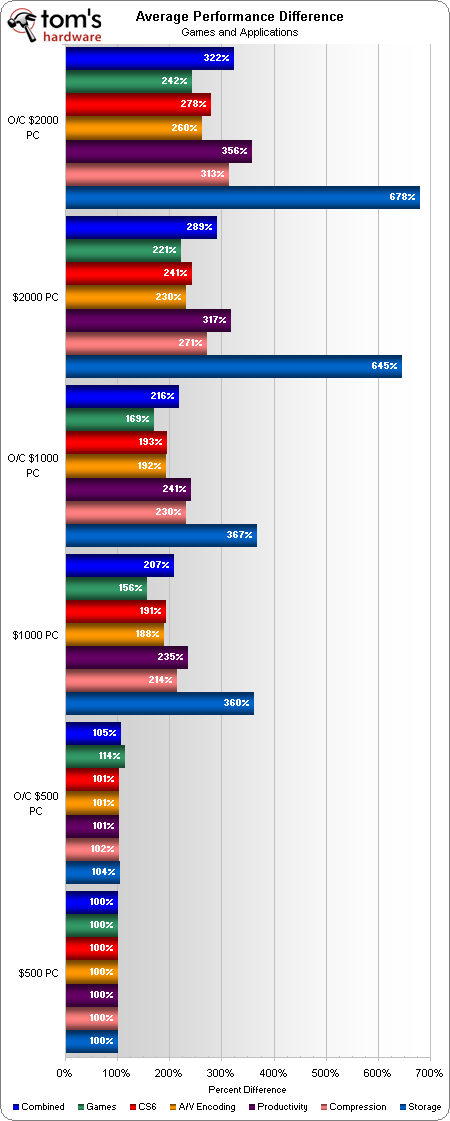
The big question on our efficiency page is how much extra performance we get for a given increase in power. To figure that out, we first calculate the average performance difference. Our combined performance bar is weighted as 30% games, 60% other applications, and 10% hard drive performance.
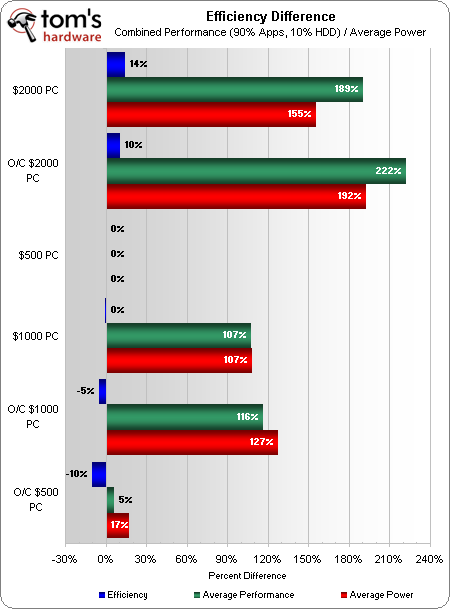
Efficiency is easy to calculate when we rely on average power and average performance to compare energy and work, but the results from those calculations normally center around a baseline of 100%. Since nothing can be more than 100% efficient, we normalize the results by subtracting 100%. The chart shows how much more or less efficient each PC is, compared to our lowest-power configuration.
The $2,000 PC’s performance advantage overwhelms all of the extra power two Radeon HD 7970s in CrossFire consume, and it's able to top the baseline $500 build's efficiency by 14%.
Meanwhile, overclocking the $500 box's graphics card increases power use more than it helps performance. And Don's $1,000 setup is never able to outperform power draw compared to the Pentium-based reference point.
Get Tom's Hardware's best news and in-depth reviews, straight to your inbox.
Current page: Energy And Efficiency
Prev Page Benchmark Results: File Compression Next Page Value Conclusion-
lengcaifai actually the piledriver based build is more all-rounded, it can be a decent workstation and a decent gaming desktop for those who have tight budgetReply -
stickmansam The piledriver build should have had some parts swapped out for cheaper ones to reflect the changes in pricing changes from last Quarter. That would have been a more fair comparison to the $1000 build from last quarter.Reply -
mayankleoboy1 For the $500 build, why would it have 60% of its value calculated by apps, when it was build for gaming purpose ?Reply
Just a thought, but shouldnt the percentwise distribution of value for each built based on the purpose for which it was built ?
Something like : games, apps, storage.
$500 build : 80%, 15%, 5% (cheapest best gaming with lots of cheap storage. )
$1000 build : 50%, 40%, 10% (slightly better games over apps. Great apps. fast storage for boot)
$2000 build. : 42.5%, 42.5%, 15% (equally good games and apps. fast storage should be plenty and fast) -
mohit9206 wow its unbelievable to see a $500 gaming pc achieve 50+ fps in Battlefield 3 at 1080p on ultra settings.Reply
goes to show how even a $500 pc can thrash and destroy xbox 360 and ps3. -
the1kingbob lengcaifaiactually the piledriver based build is more all-rounded, it can be a decent workstation and a decent gaming desktop for those who have tight budgetReply
I was pleasantly surprised how well it turned out. I believe I would have gone with one that had less cores and spent the money elsewhere. Overall though, it turned out to be a pretty good machine. Now only if they could get the power usage under control. -
slicedtoad You need to use a slightly more complicated performance comparison algorithm. Something that takes into account the fact that over 120fps is useless and doesn't run into problems with things like fps caps at low res.Reply -
Marcus52 mohit9206wow its unbelievable to see a $500 gaming pc achieve 50+ fps in Battlefield 3 at 1080p on ultra settings.goes to show how even a $500 pc can thrash and destroy xbox 360 and ps3.Reply
Yeah the AMD 7850 really pulled its gaming performance up. Very nice too that the Intel G850 didn't choke it off. A sweet build! -
ojas Um i must ask this, BF3, 2560x1600, ultra: is cross-fire not working? Why should 2 7970s serve up the same performance as a single 670? Or am i missing something? Thomas mentions the drop being "extreme" in his build's article but...something's wrong, i think...Reply -
So we're left with the AMD platform winning out the value comparison for no other reason than the mid-range Intel solution was not permitted to compete - so without filling all the places at the table this test is meaningless. The AMD solution only gets a default win due to no other permitted competition in that price range. This is garbage.Reply
Firstly, the bulk of sane consumers with even half a clue and with $1000 in their pocket would not have given the AMD platform a 2nd look if given the choice. Are we really suggesting that they would have thrown $1000 at a solution that would not give them a 3770K upgrade option later on if they felt like it?
Also, this comparison deliberately factored out power consumption, which was rather convenient for AMD. I'm afraid you can't factor this out in this day and age, just because it's hard to quantify the cost across the entire globe. What you could do is produce some sythetics that represent average consumption over a given task and mutliply it up to get the total power over a year - then folk can work out what that would cost them in their own location. What I would like to know is how much that AMD solution would cost me to run for a couple of years when compared to a comparible Intel solution, and then work out what I could have bought with the money saved - it might not be much but I think it's valid - it could be the difference between a decent cooler or a piece of trash.
Please make these value comparisons tell the whole story by including both platforms within that price bracket - I know that makes life hard for the reviewing team but boo hoo hoo, you're the ones that set out to prove a point, so do a full job please. Tell us the full story, not half of it.


