System Builder Marathon, Q4 2012: System Value Compared
Benchmark Results: 3DMark And PCMark
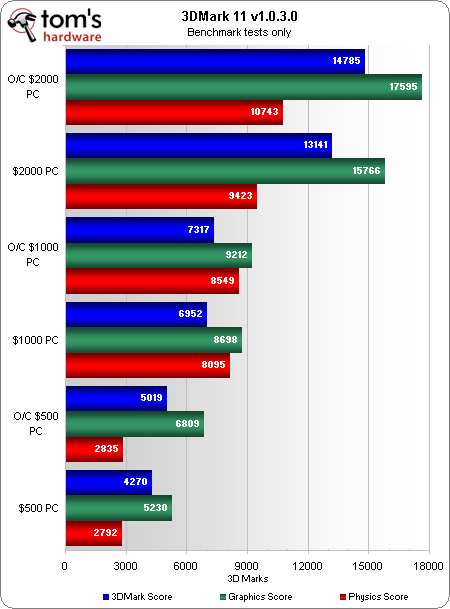
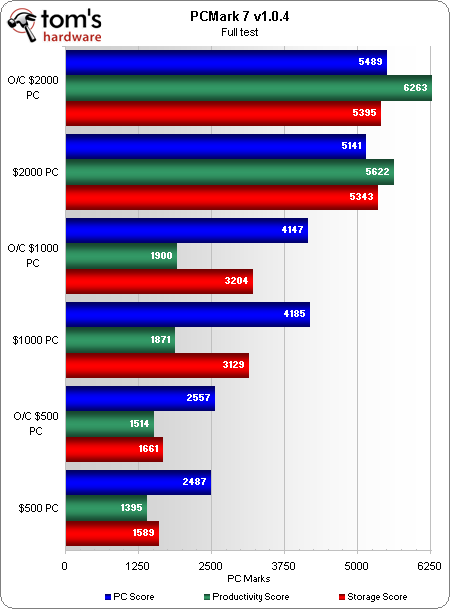
Because our real-world benchmarks are based on proprietary applications that many folks don't have, we provide 3DMark and PCMark results primarily as a service to readers who would like to compare our data to their own machines.
Scoring nearly twice as high as Don Woligroski's $1,000 PC, results like these in real-world testing would give my $2,000 machine a fighting chance in the value race (which is just as much about pricing as it is about going fast). On the other hand, Paul’s $500 machine scores far closer to the $1,000 build than its low price would indicate.
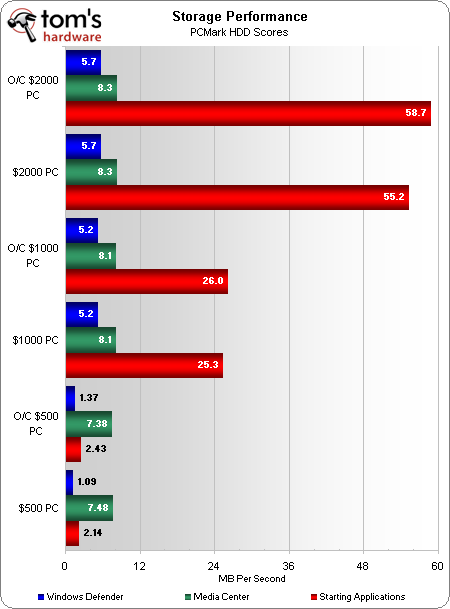
PCMark places an inordinate emphasis on storage performance. This is the only metric where Don is able to cheat, so to speak, since his SSD is too small to hold our test suite.
Our secondary use of PCMark is as a measure of synthesized real-world drive performance. Its storage tests represent the data access patterns of several real-world uses, and we chose the three most pertinent results as the basis for the disk performance portion of our overall performance score. As a competitor in this competition, I’ll repeat my objection to Don’s drive being too small to fit our entire test suite (in the real world, you wouldn't be able to get all of these apps installed on a 60 GB drive). But, since drive performance is only 10% of overall scoring, I'm still going to let his system slide in those calculations.
Get Tom's Hardware's best news and in-depth reviews, straight to your inbox.
Current page: Benchmark Results: 3DMark And PCMark
Prev Page Hardware And Software Test Configurations Next Page Benchmark Results: SiSoftware Sandra-
lengcaifai actually the piledriver based build is more all-rounded, it can be a decent workstation and a decent gaming desktop for those who have tight budgetReply -
stickmansam The piledriver build should have had some parts swapped out for cheaper ones to reflect the changes in pricing changes from last Quarter. That would have been a more fair comparison to the $1000 build from last quarter.Reply -
mayankleoboy1 For the $500 build, why would it have 60% of its value calculated by apps, when it was build for gaming purpose ?Reply
Just a thought, but shouldnt the percentwise distribution of value for each built based on the purpose for which it was built ?
Something like : games, apps, storage.
$500 build : 80%, 15%, 5% (cheapest best gaming with lots of cheap storage. )
$1000 build : 50%, 40%, 10% (slightly better games over apps. Great apps. fast storage for boot)
$2000 build. : 42.5%, 42.5%, 15% (equally good games and apps. fast storage should be plenty and fast) -
mohit9206 wow its unbelievable to see a $500 gaming pc achieve 50+ fps in Battlefield 3 at 1080p on ultra settings.Reply
goes to show how even a $500 pc can thrash and destroy xbox 360 and ps3. -
the1kingbob lengcaifaiactually the piledriver based build is more all-rounded, it can be a decent workstation and a decent gaming desktop for those who have tight budgetReply
I was pleasantly surprised how well it turned out. I believe I would have gone with one that had less cores and spent the money elsewhere. Overall though, it turned out to be a pretty good machine. Now only if they could get the power usage under control. -
slicedtoad You need to use a slightly more complicated performance comparison algorithm. Something that takes into account the fact that over 120fps is useless and doesn't run into problems with things like fps caps at low res.Reply -
Marcus52 mohit9206wow its unbelievable to see a $500 gaming pc achieve 50+ fps in Battlefield 3 at 1080p on ultra settings.goes to show how even a $500 pc can thrash and destroy xbox 360 and ps3.Reply
Yeah the AMD 7850 really pulled its gaming performance up. Very nice too that the Intel G850 didn't choke it off. A sweet build! -
ojas Um i must ask this, BF3, 2560x1600, ultra: is cross-fire not working? Why should 2 7970s serve up the same performance as a single 670? Or am i missing something? Thomas mentions the drop being "extreme" in his build's article but...something's wrong, i think...Reply -
So we're left with the AMD platform winning out the value comparison for no other reason than the mid-range Intel solution was not permitted to compete - so without filling all the places at the table this test is meaningless. The AMD solution only gets a default win due to no other permitted competition in that price range. This is garbage.Reply
Firstly, the bulk of sane consumers with even half a clue and with $1000 in their pocket would not have given the AMD platform a 2nd look if given the choice. Are we really suggesting that they would have thrown $1000 at a solution that would not give them a 3770K upgrade option later on if they felt like it?
Also, this comparison deliberately factored out power consumption, which was rather convenient for AMD. I'm afraid you can't factor this out in this day and age, just because it's hard to quantify the cost across the entire globe. What you could do is produce some sythetics that represent average consumption over a given task and mutliply it up to get the total power over a year - then folk can work out what that would cost them in their own location. What I would like to know is how much that AMD solution would cost me to run for a couple of years when compared to a comparible Intel solution, and then work out what I could have bought with the money saved - it might not be much but I think it's valid - it could be the difference between a decent cooler or a piece of trash.
Please make these value comparisons tell the whole story by including both platforms within that price bracket - I know that makes life hard for the reviewing team but boo hoo hoo, you're the ones that set out to prove a point, so do a full job please. Tell us the full story, not half of it.


