FSP Twins 500W Redundant PSU Review
The FSP Twins series combines the usability of a normal ATX PSU and the advanced features of a redundant server unit. The Twins 500W we're evaluating today addresses users that need an ultra-reliable PSU and are willing to pay for it.
Why you can trust Tom's Hardware
Performance, Performance Per Dollar, Noise, And Efficiency Ratings
Performance Rating
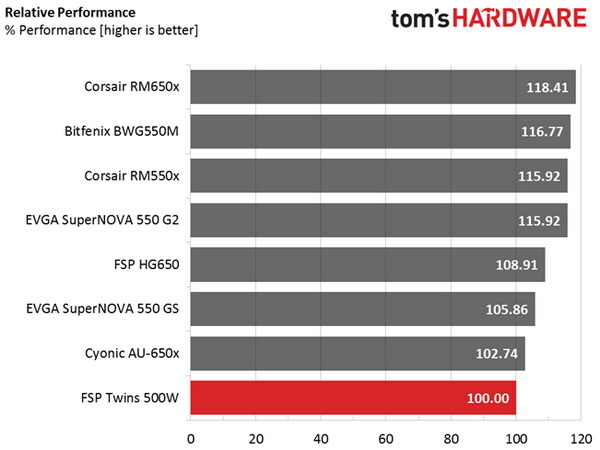
The following graph shows the Twins 500W's total performance rating, comparing it to other PSUs we've tested. To be more specific, the tested unit is shown as 100 percent, and every other product's performance is shown relative to it.
The performance of FSP's Twins 500W isn't up to the levels of similar-capacity desktop PSUs. However, this power supply's major advantage is its redundant functionality. Normally we'd only draw comparisons to similar hardware. But this is a pretty unique PSU, and the only of its kind in our benchmark results library.
Performance Per Dollar
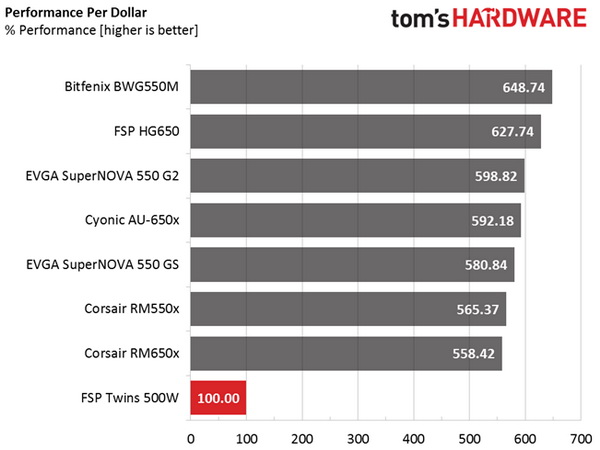
The following chart may be the most interesting to many of you because it depicts the Twins 500W's performance-per-dollar score. We looked up the current price of each PSU on popular online shops and used those prices and all relative performance numbers to calculate the index. If the specific unit wasn't available in the United States, we searched for it in popular European Union shops, converting the listed price to USD (without VAT). Note that all of the numbers in the following graph are normalized by the rated power of each PSU.
We only provide this graph for reference purposes, since it is like comparing apples to oranges when we pit a redundant PSU against normal desktop ones.
Noise Rating
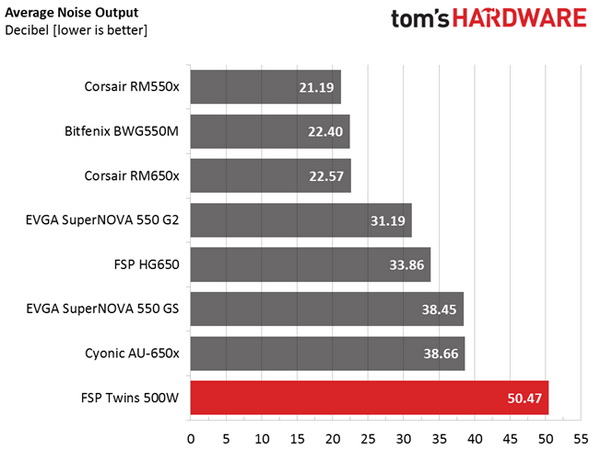
The graph below depicts the cooling fan's average noise over the PSU's operating range, with an ambient temperature between 28°C and 30°C (82°F to 86°F).
Since this is practically a server unit, you shouldn't expect it to operate quietly.
Efficiency Rating
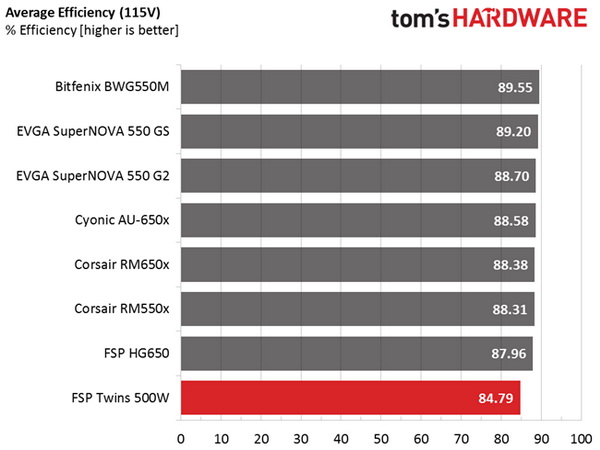
The following graph shows the average efficiency of the PSU throughout its operating range, with an ambient temperature close to 30°C.
Get Tom's Hardware's best news and in-depth reviews, straight to your inbox.
Average efficiency is pretty low, since this frame uses two power modules that are Gold-certified with 230V input.
Current page: Performance, Performance Per Dollar, Noise, And Efficiency Ratings
Prev Page Ripple Measurements Next Page Pros, Cons, And Final Verdict
Aris Mpitziopoulos is a contributing editor at Tom's Hardware, covering PSUs.
-
shrapnel_indie ReplyPros
Full power at 45°CAll cables are fixed, and because this is a server-like product, its maximum operating temperature for continuous full power delivery is 50°C.
Please explain to me why these numbers don't seem to match up properly. (THB, I may have missed it.)
-
dstarr3 I really wonder what a consumer could possibly want this for. What is an ordinary consumer doing that they absolutely cannot risk any downtime whatsoever on their rig?Reply -
nzalog I know freenas can be configured to work faster if you can for sure trust the system from not having RAM errors (covered by ECC) and if you can guarantee there is no unexpected shutdown (covered by dual power and ups). However the reliable power is not really required because a SSD as an SLOG device will cover for it, but then the SSD becomes the bottleneck for writes.Reply -
firefoxx04 I build several file servers a month for clients. Low end enough to where pre built solutions are not an option. This power supply would be a good fit but it is useless, imo, without some sort of email alert option. Maybe I missed that?Reply
When I deploy file servers for clients, I always setup some sort of alert system for raid failures so I can fix the problem. What is the point of redundancy if the user has no idea a problem has occurred? Yes i know that this PSU makes a "loud buzzer noise" but I cant have that either. The user needs to continue to use the system and they cannot if it is screaming 100% of the time.
Send me an email alert. Its easy to implement. -
Rookie_MIB One thing I'm curious about - what if one unit does fail? Are they bog-standard replacement parts where you can go and buy a similar hot swap redundant power supply or is the system proprietary. If it's the latter, then I don't see many people lining up for this one...Reply -
apache_lives A PSU is but one part of a "reliable" machine, to me this will not increase up time or do anything of any value, seems more like a "makes me feel better" part.Reply -
Aris_Mp about the first comment, the PSU is certified for up to 50C ambient full power delivery, but I choose to test up to 45C every PSU that passed from my test bench (since I also have to evaluate 40C rated units and I need to keep the same conditions for all).Reply -
shrapnel_indie Reply19144735 said:about the first comment, the PSU is certified for up to 50C ambient full power delivery, but I choose to test up to 45C every PSU that passed from my test bench (since I also have to evaluate 40C rated units and I need to keep the same conditions for all).
While I'm glad for that, It's also nice to know if a unit rated at 50°C operation will deliver on its "promise" though. (If you exceed the "promised" rating, like the 40°C rated units @ 45, well, it delivered on its promise and then some.)
-
Pompompaihn Newegg has several server chassis for sale that come WITH redundant 500w+ PSUs for less money than just this power supply. Given that the market is low end commercial/prosumer, and it's not going to be for gaming or HTPC, why wouldn't you just buy the whole thing for cheaper?Reply


