FSP Twins 500W Redundant PSU Review
The FSP Twins series combines the usability of a normal ATX PSU and the advanced features of a redundant server unit. The Twins 500W we're evaluating today addresses users that need an ultra-reliable PSU and are willing to pay for it.
Why you can trust Tom's Hardware
Cross-Load Tests And Infrared Images
Our cross-load tests are described in detail here.
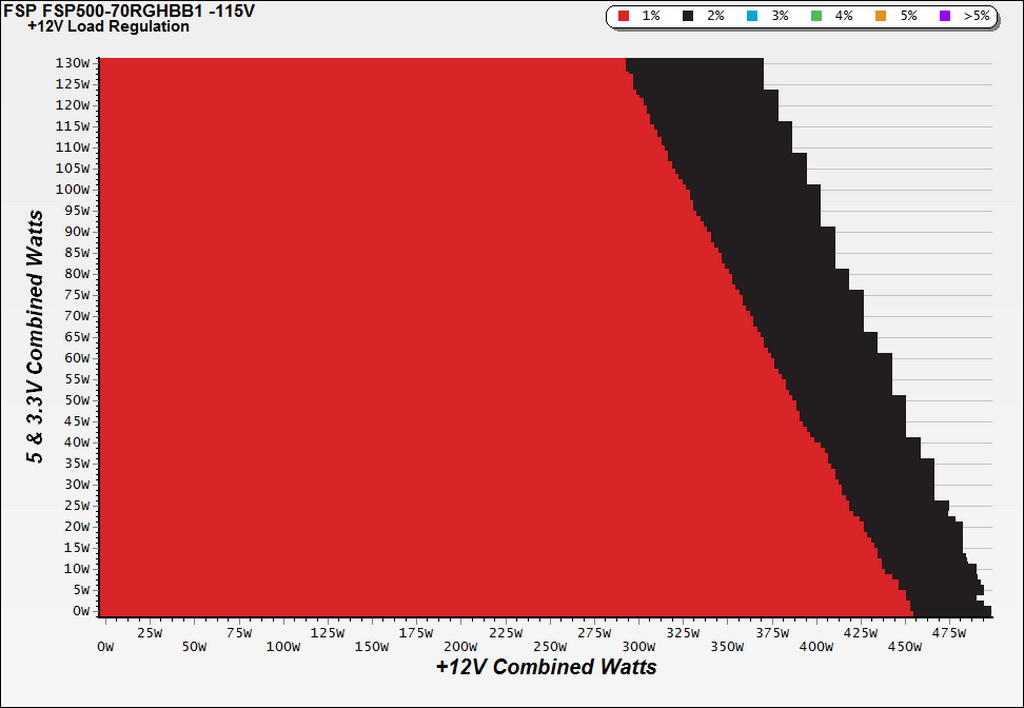
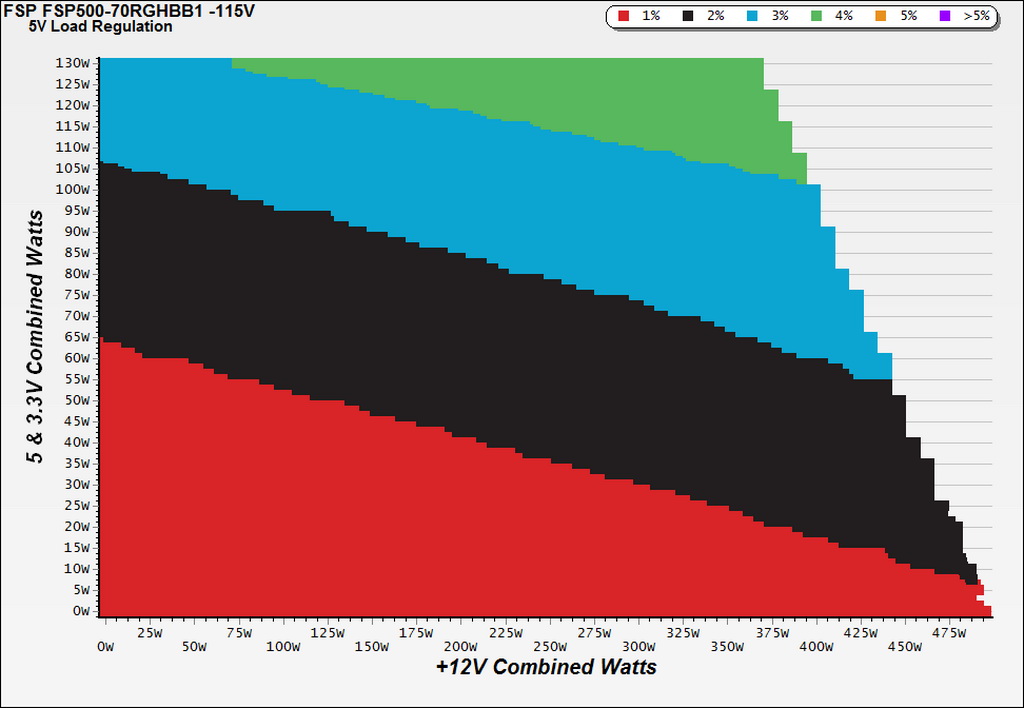
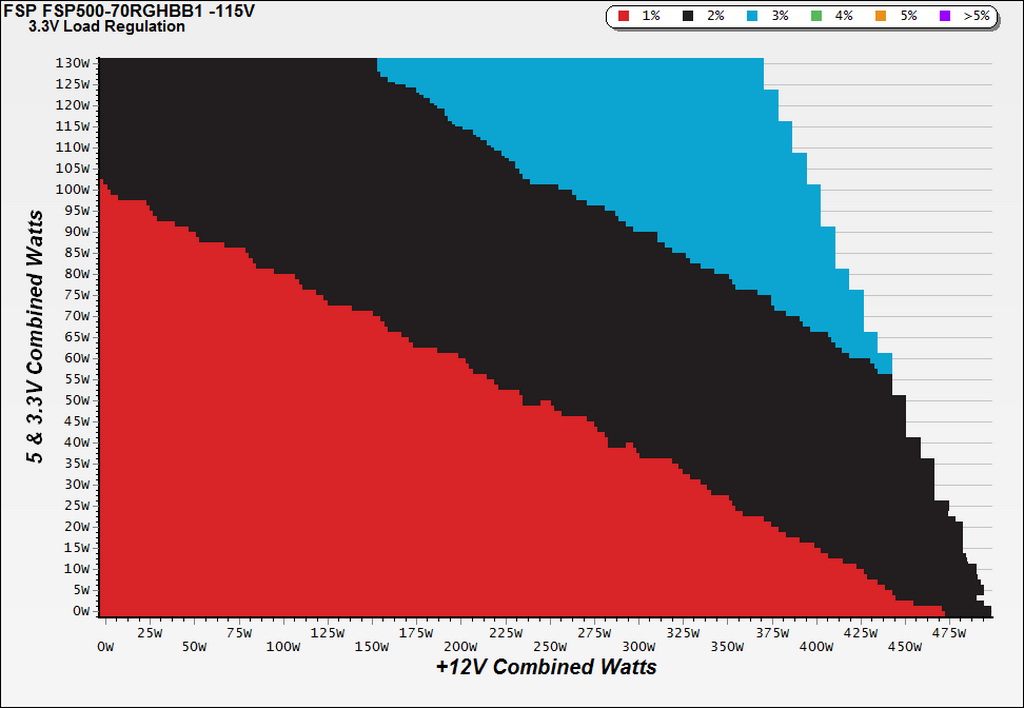
To generate the following charts, we set our loaders to auto mode through our custom-made software before trying more than 25,000 possible load combinations with the +12V, 5V and 3.3V rails. The load regulation deviations in each of the charts below were calculated by taking the nominal values of the rails (12V, 5V and 3.3V) as point zero. The ambient temperature was between at 28°C (82.4°F) to 30°C (86°F).
Load Regulation Charts
Efficiency Chart
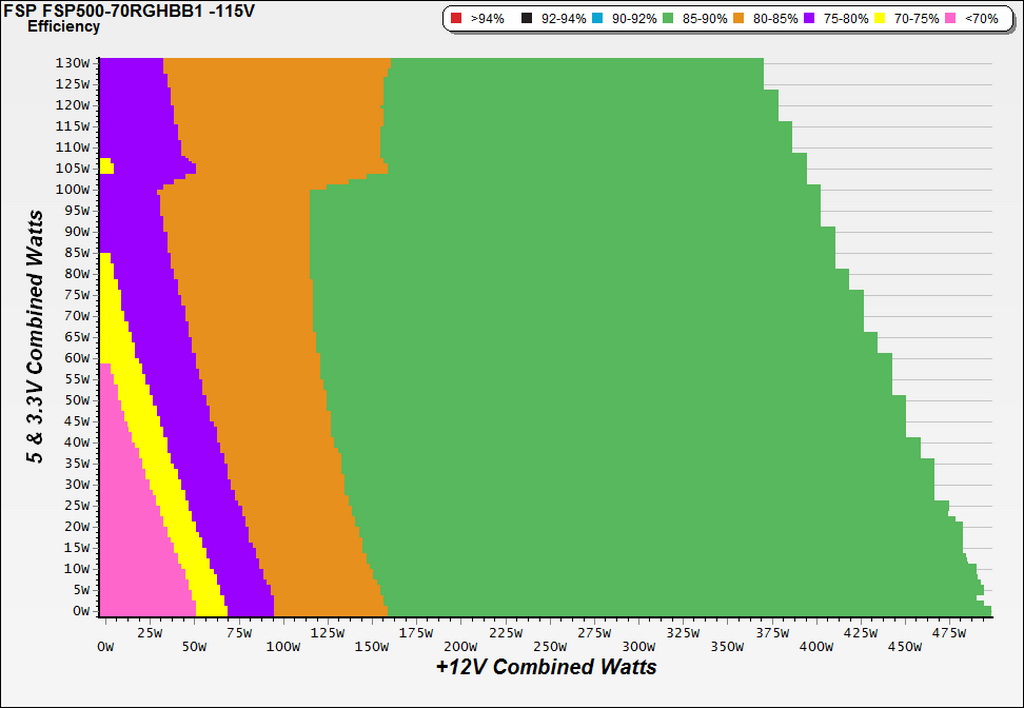
This is clearly not our normal efficiency graph, where readings should normally register a peak under typical (40%-50% of the max-rated-capacity) loads. This is because both power modules work in parallel, offering better efficiency under high loads. However, under low and moderate ones, the combined power losses of both modules lead to lower efficiency.
Ripple Charts
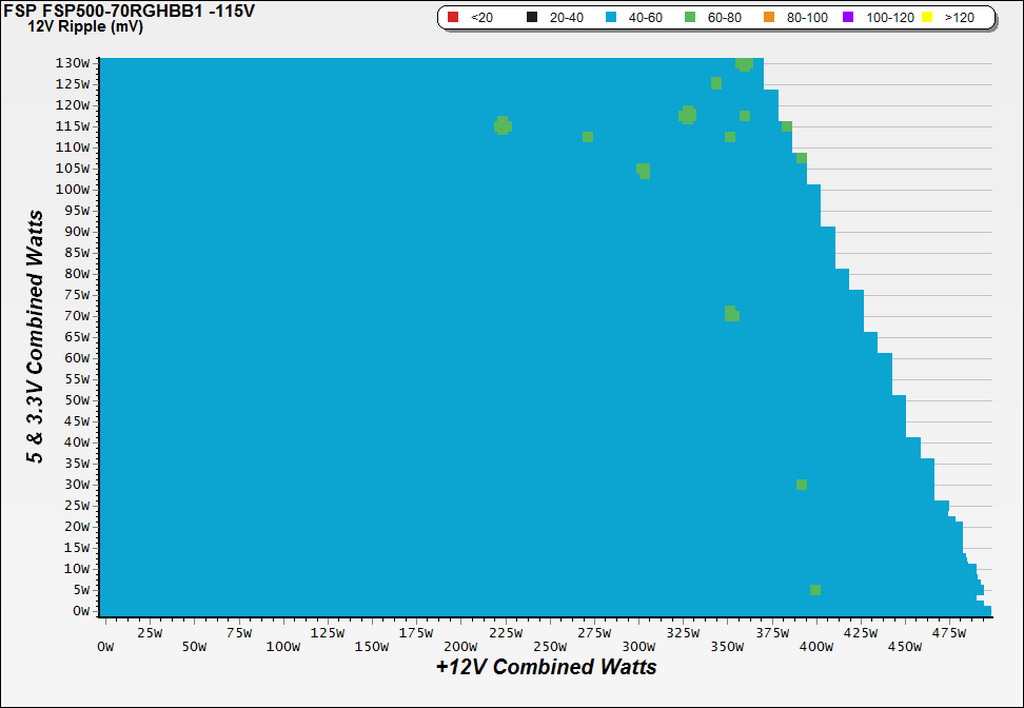
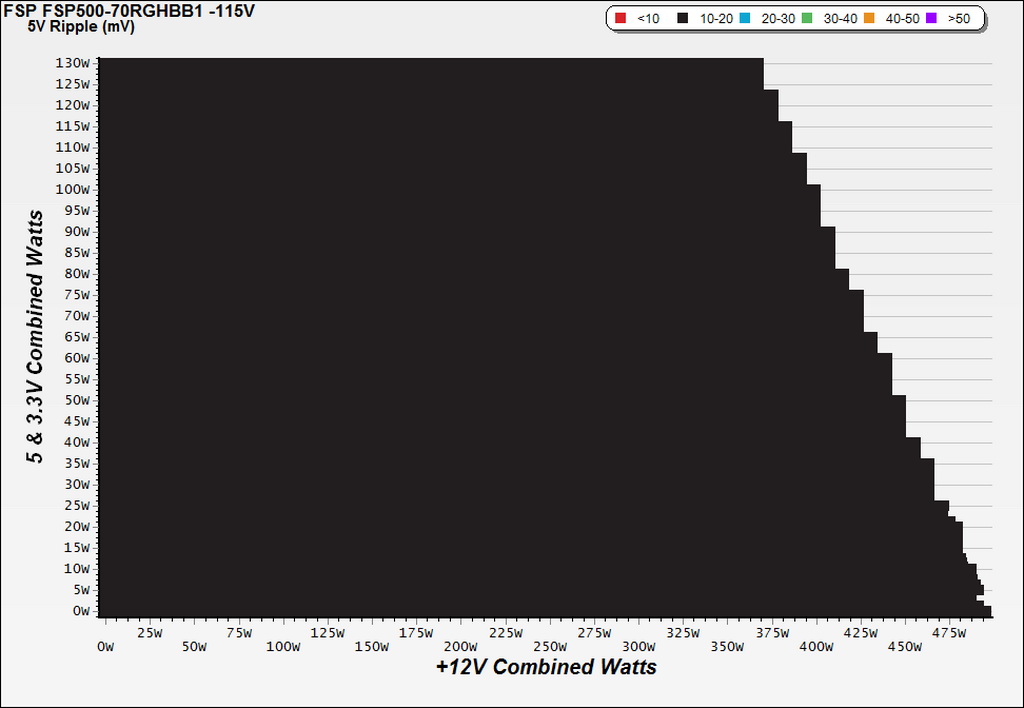
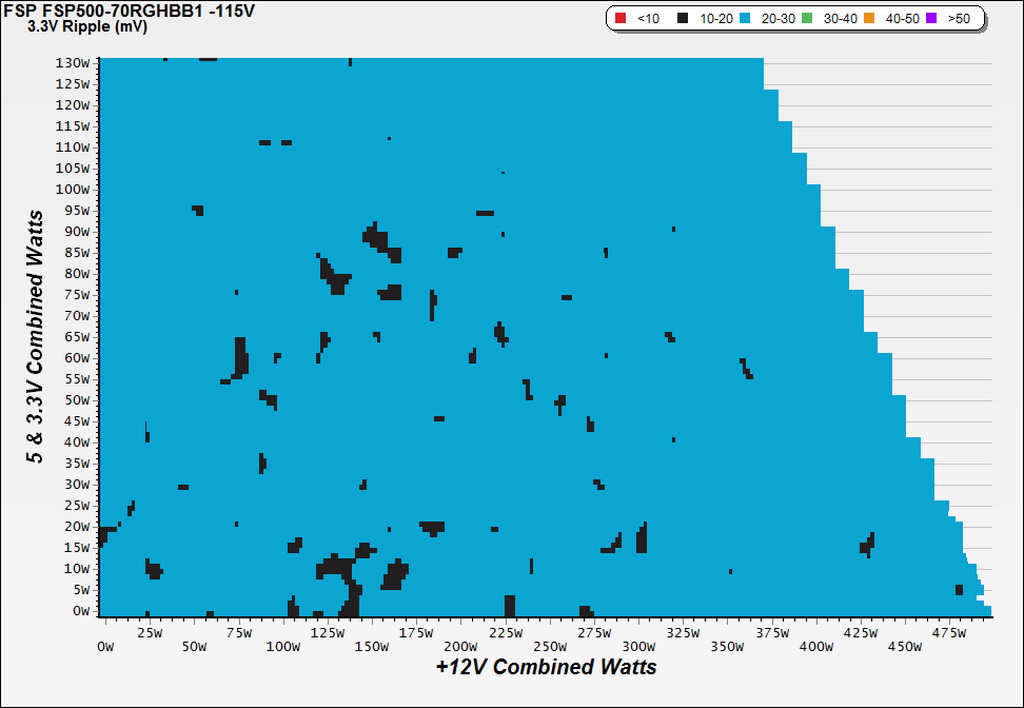
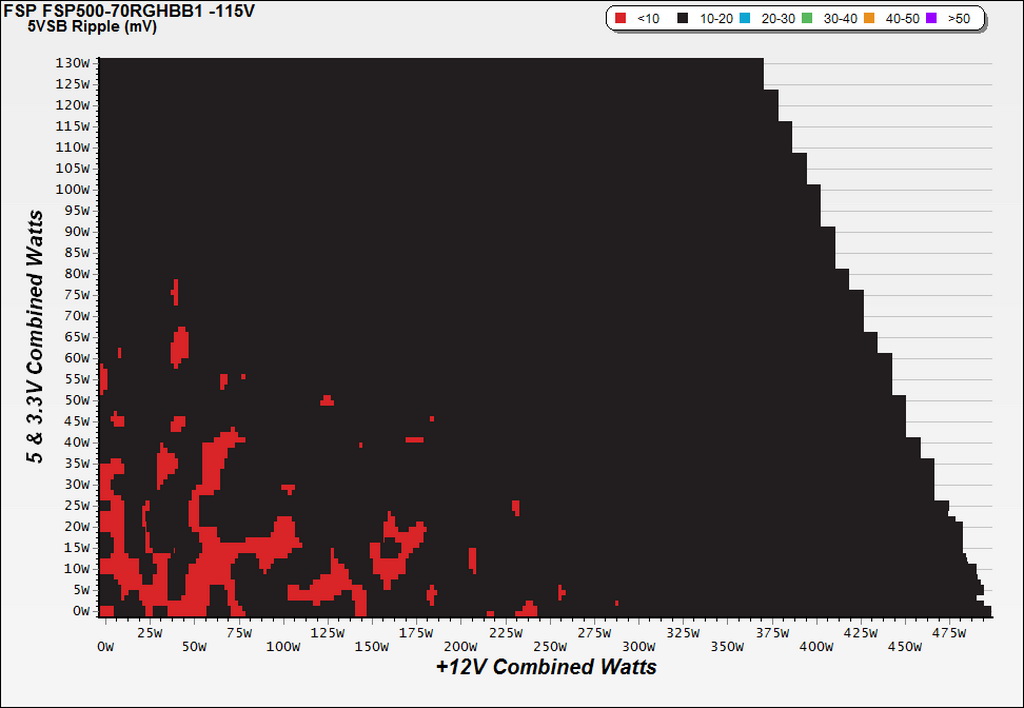
Infrared Images
Toward the end of the cross-load tests, we took some photos of the PSU with our modified FLIR E4 camera that delivers 320x240 IR resolution (76,800 pixels).
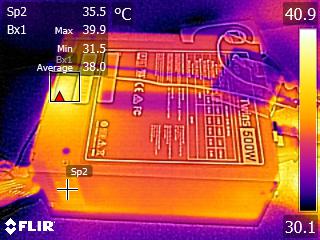
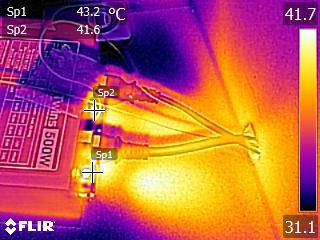
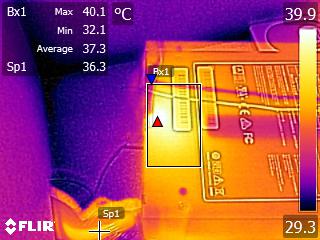
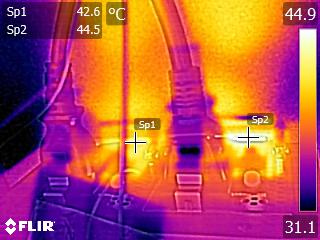
The frame's DC-DC converters get quite hot when they're taxed. Fortunately, the modules' cooling fans do a decent job according to our thermal shots.
Get Tom's Hardware's best news and in-depth reviews, straight to your inbox.
Current page: Cross-Load Tests And Infrared Images
Prev Page Protection Features And Transition Time Next Page Transient Response Tests
Aris Mpitziopoulos is a contributing editor at Tom's Hardware, covering PSUs.
-
shrapnel_indie ReplyPros
Full power at 45°CAll cables are fixed, and because this is a server-like product, its maximum operating temperature for continuous full power delivery is 50°C.
Please explain to me why these numbers don't seem to match up properly. (THB, I may have missed it.)
-
dstarr3 I really wonder what a consumer could possibly want this for. What is an ordinary consumer doing that they absolutely cannot risk any downtime whatsoever on their rig?Reply -
nzalog I know freenas can be configured to work faster if you can for sure trust the system from not having RAM errors (covered by ECC) and if you can guarantee there is no unexpected shutdown (covered by dual power and ups). However the reliable power is not really required because a SSD as an SLOG device will cover for it, but then the SSD becomes the bottleneck for writes.Reply -
firefoxx04 I build several file servers a month for clients. Low end enough to where pre built solutions are not an option. This power supply would be a good fit but it is useless, imo, without some sort of email alert option. Maybe I missed that?Reply
When I deploy file servers for clients, I always setup some sort of alert system for raid failures so I can fix the problem. What is the point of redundancy if the user has no idea a problem has occurred? Yes i know that this PSU makes a "loud buzzer noise" but I cant have that either. The user needs to continue to use the system and they cannot if it is screaming 100% of the time.
Send me an email alert. Its easy to implement. -
Rookie_MIB One thing I'm curious about - what if one unit does fail? Are they bog-standard replacement parts where you can go and buy a similar hot swap redundant power supply or is the system proprietary. If it's the latter, then I don't see many people lining up for this one...Reply -
apache_lives A PSU is but one part of a "reliable" machine, to me this will not increase up time or do anything of any value, seems more like a "makes me feel better" part.Reply -
Aris_Mp about the first comment, the PSU is certified for up to 50C ambient full power delivery, but I choose to test up to 45C every PSU that passed from my test bench (since I also have to evaluate 40C rated units and I need to keep the same conditions for all).Reply -
shrapnel_indie Reply19144735 said:about the first comment, the PSU is certified for up to 50C ambient full power delivery, but I choose to test up to 45C every PSU that passed from my test bench (since I also have to evaluate 40C rated units and I need to keep the same conditions for all).
While I'm glad for that, It's also nice to know if a unit rated at 50°C operation will deliver on its "promise" though. (If you exceed the "promised" rating, like the 40°C rated units @ 45, well, it delivered on its promise and then some.)
-
Pompompaihn Newegg has several server chassis for sale that come WITH redundant 500w+ PSUs for less money than just this power supply. Given that the market is low end commercial/prosumer, and it's not going to be for gaming or HTPC, why wouldn't you just buy the whole thing for cheaper?Reply
