Why you can trust Tom's Hardware
Power Consumption
We used CPUz logging to measure the cards’ power consumption with the Metro: Exodus benchmark running at 2560 x 1440 using the default Ultra settings. The tested cards are warmed up prior to testing, with testing started after the card settles to an idle temperature (after about 10 minutes). The benchmark is looped a total of five times, which yields around 10 minutes of testing. In the charts, you will see a few blips in power use, which is a result of the benchmark starting the next loop.
We also use Furmark to capture worst-case power readings. Although both Nvidia and AMD consider the application to be a “power virus,” or program that deliberately taxes the components beyond normal limits, the data we can gather from it offers useful information about a card’s capabilities outside of typical gaming loads.
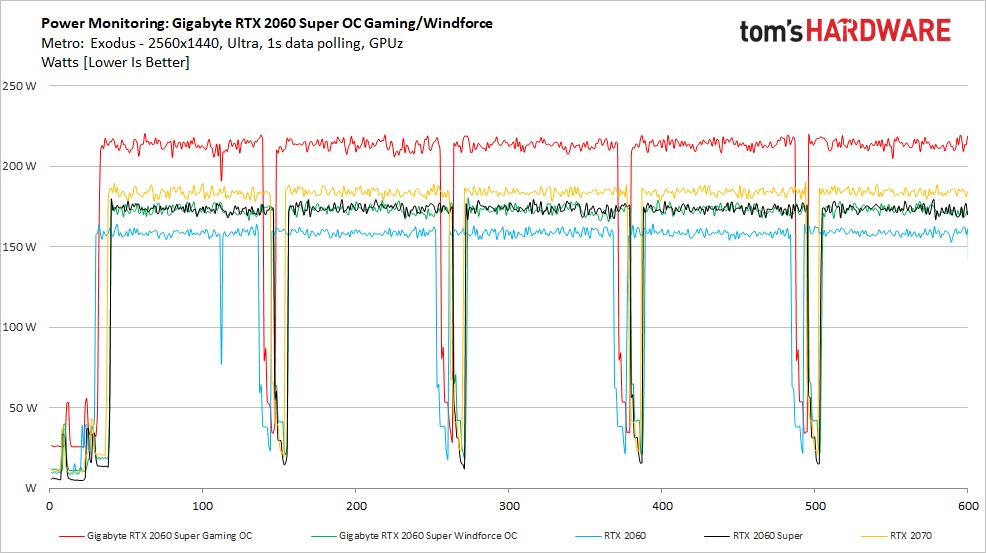
The biggest takeaway from this chart is the surprisingly substantial difference between similar cards. The Gaming OC version used a lot more power than other models, topping out at nearly 220W. The Windforce version reached 180W, while the reference card peaked around 163W. The Gaming OC does deliver higher clock speeds. But to see such a large difference is surprising.
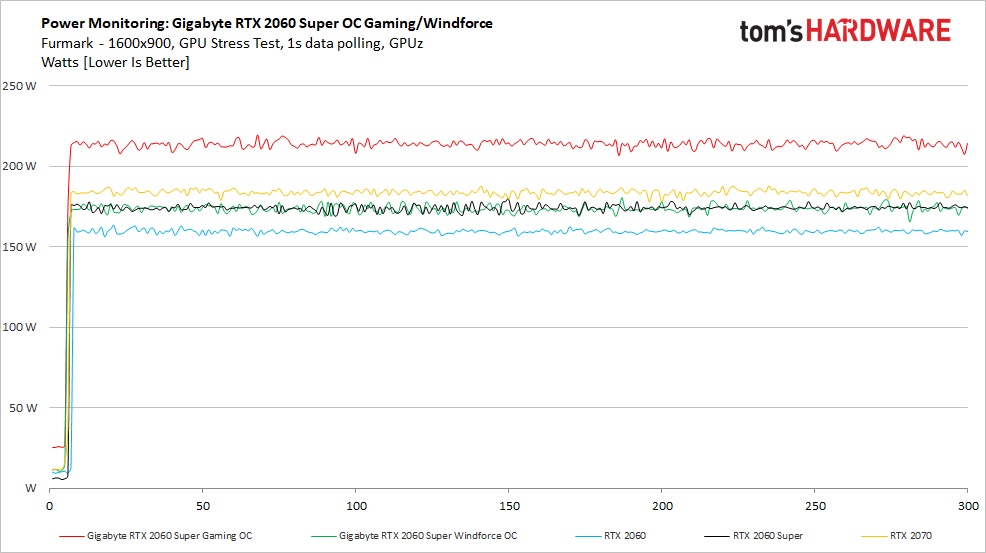
Taking a look at the Furmark results, we observe less of a difference in peak or average power use between these cards. This is due to the cards throttling themselves using this benchmark to stay at their listed TDPs. The Gaming OC version peaked at almost 220W, with the Windforce version using less power overall, but still peaking at 180W.
Temperatures, Fan Speeds and Clock Rates
In order to see how each video card behaves, like the power testing, we use GPUz logging in one-second intervals to capture data. Game testing is done looping the Metro: Exodus benchmark five times at Ultra settings running at 2560x1440 resolution.
We also used Furmark to capture some of the data below, which offers a more consistent load and uses slightly more power, regardless of the fact that the clock speeds and voltages are limited. These data sets give insight into worst-case situations, along with a load other than gaming.
Gaming
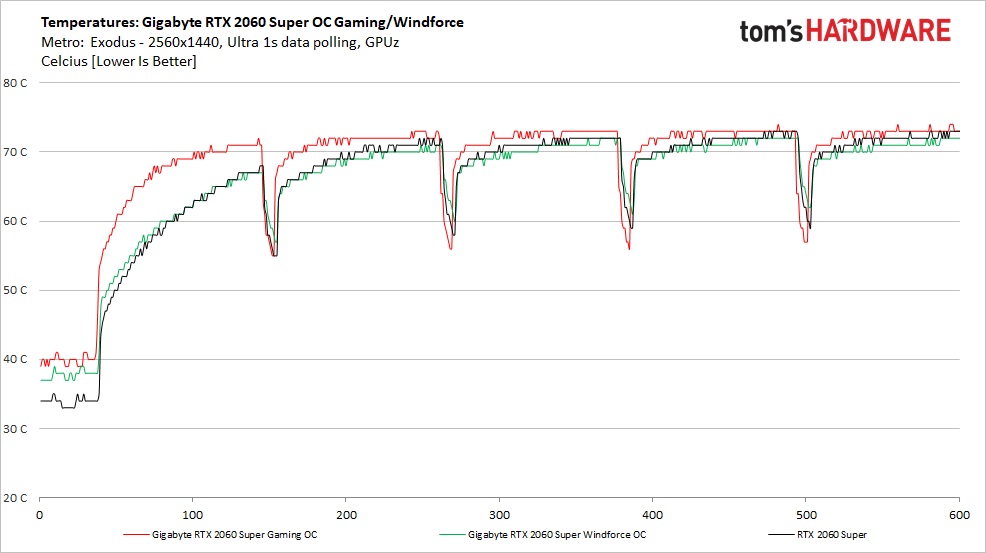
During our gaming test, the Gigabyte OC Gaming card using the Windforce 3 cooler reached a peak of 74C during our testing. This result, surprisingly, is the highest of the compared cards, but only by two degrees. The card ramped up to this temperature a lot faster due to significantly more power use than the other 2060 Supers, while the other cards took more time to reach their peak. The Windforce card with its dual-fan cooler, topped out at 72C, alongside the reference-cooled RTX 2060 Super. Overall, all three RTX 2060 Supers have ample cooling for the silicon at their core.
Get Tom's Hardware's best news and in-depth reviews, straight to your inbox.
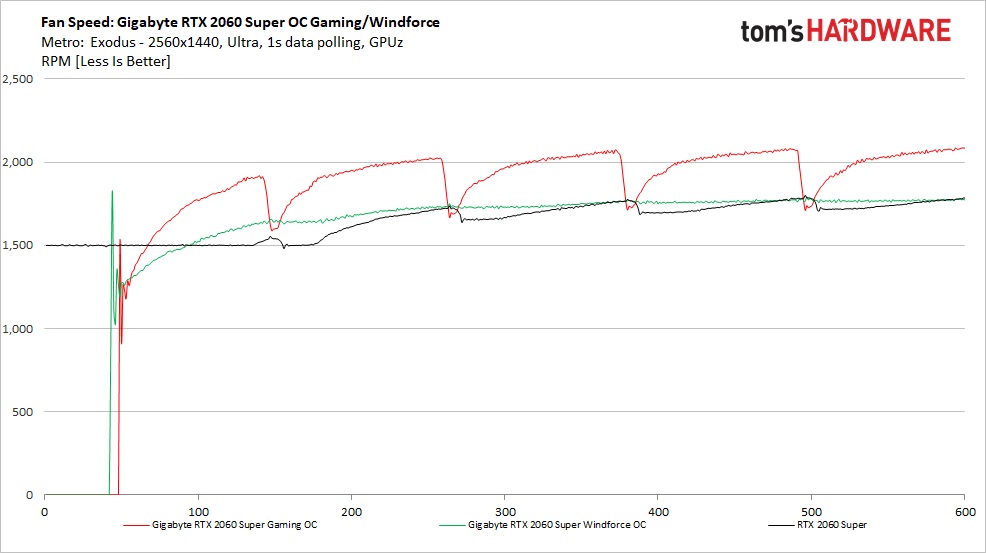
Fan speeds on these cards varied quite a bit between the comparison group. The slightly warm-running Gaming OC with its three-fan cooler is idle for the initial part of the test, then ramps up to around 1,500 RPM and keeps going to a peak of almost 2,100 RPM. During testing, the fans are audible but not annoying. We can see in the chart the fan speed swings quite a bit with temperatures, nearly a 500 RPM range.
The Windforce card and its two-fan solution ramped up a lot slower. Like the Gaming OC, it also uses the 3D Fan feature, so its fans are off until they reach a specific temperature. Once they spin up, the two large fans spin leisurely at around 1,800 RPM. The curve is very flat, which tells us the card’s default fan curve doesn’t respond as quickly to changing temperatures -- a good thing as sometimes this speeding up and slowing down can be annoyingly audible.
Compared to the reference card, both Gigabyte models were quieter, regardless of the lower overall fan speed. The reference card also does not have a ‘zero fan’ capability, instead running at 1,500 MHz from the get-go. If you want silence on light loads, aftermarket cards are the answer.
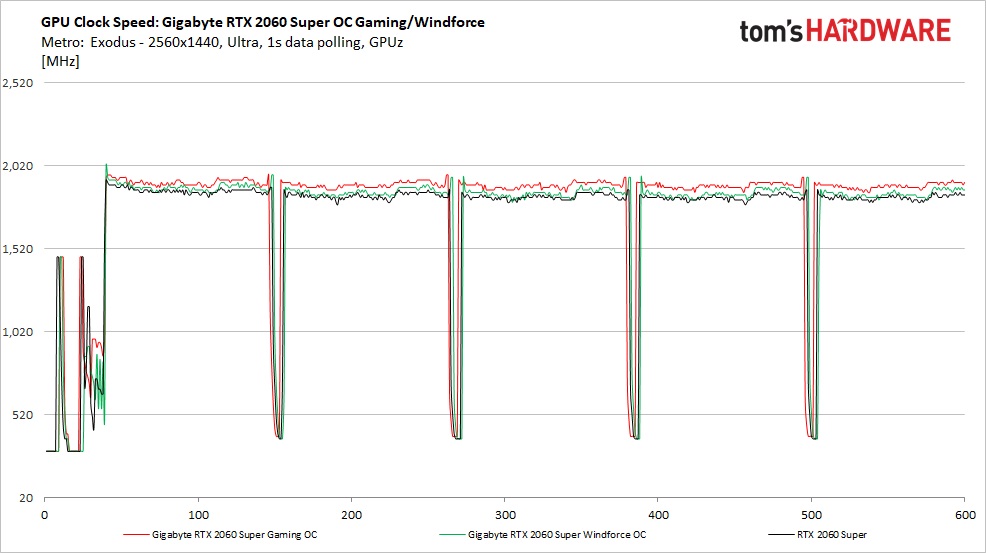
When looking at the clock speeds, by specification the Gaming OC is set to run the fastest, with a boost clock listed at 1,815 MHz compared to 1,710 MHz on the Windforce. What we actually saw was the Gaming OC averaging 1,899 MHz, while the Windforce averaged 1,854 Mhz. The reference RTX 2060 Super averaged 1,831 MHz, the slowest of the bunch as we’d expect. Unlike AMD’s boost clocks on video cards, Nvidia’s boost spec is essentially a ‘minimum’ boost clock, with cards going well above that mark under normal operating conditions.
Furmark
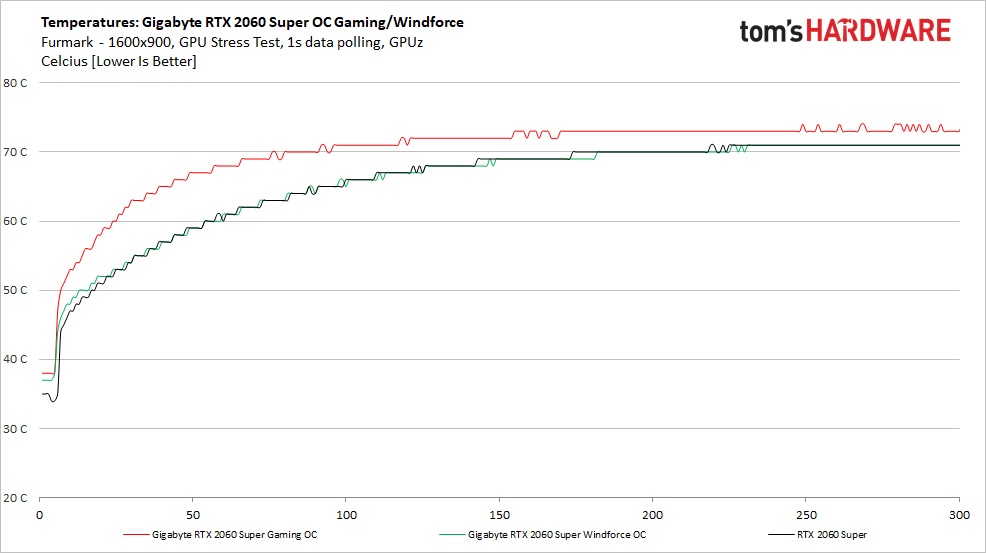
Temperatures in Furmark did not differ much from gaming. Reaching the max temperature took a bit longer since the cards are throttling in an attempt to stay within their power specs. The Gaming OC peaked at 74C, the same as in the previous test, while the Windforce reached 72C, also the same as in game testing.
The Gaming OC with its beefier cooling should have cooled better on paper. However, its increased power limits and power use means we are seeing similar temperatures, because the higher-clocked card has to dissipate more heat.
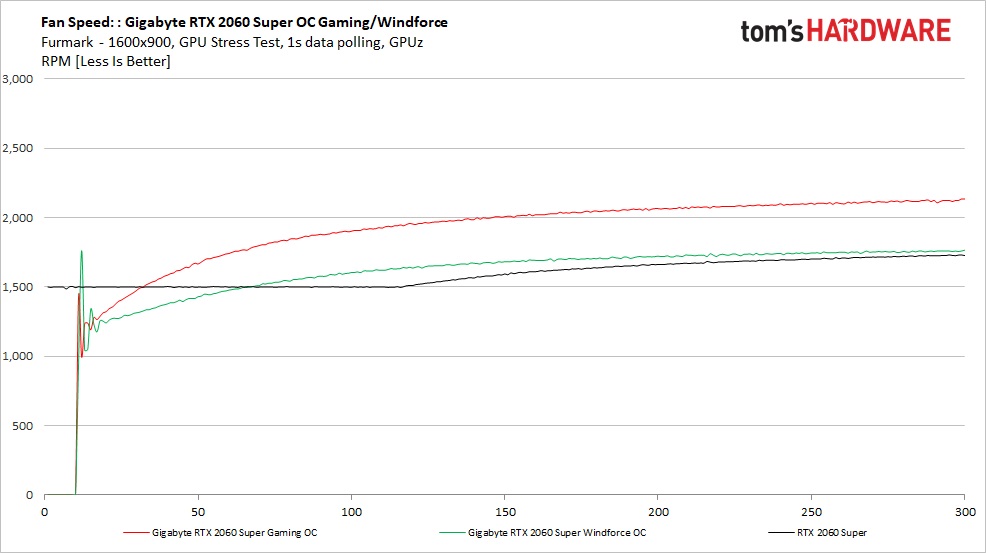
Like we saw elsewhere, the fans on the Gaming OC ramped up to 2,100 RPM again, with the Windforce peaking at 1,800 MHz. Meanwhile, the reference-cooled RTX 2060 Super peaked at a bit less than 1,800 RPM.
Overall, all cooling solutions were effective and relatively quiet. The sound coming from the reference card is a bit louder than the two aftermarket cards. But between the two Gigabyte cards, while neither are noisy and there’s no whine or other noises that we can hear, the three-fan Gaming OC is a little noisier than the dual-fan Windforce. But you do get slightly better performance for the slight noise tradeoff.
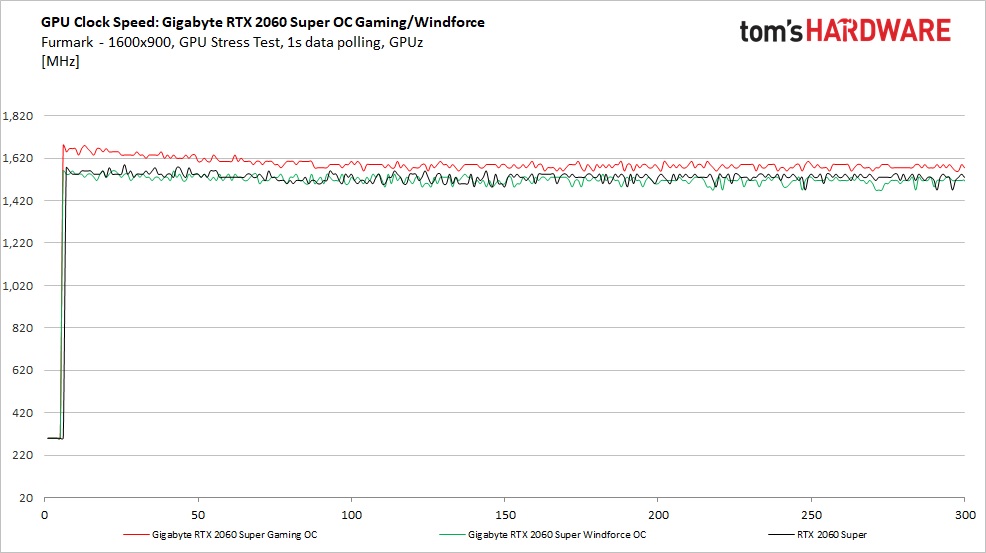
Clock rates are where we see the biggest difference between Furmark and gaming. A quick glance at the chart and we can see all cards run at significantly slower speeds here. Again, the cards are working at managing the clock speeds and voltages to stay within their TDP.
In this case, the Gaming OC averaged just below 1,600 MHz for the majority of the test, compared to the almost 1,900 MHz when gaming. The Windforce showed similar results, running around 1,500 MHz here versus 1,854 MHz in gaming.
MORE: Best Graphics Cards
MORE: Desktop GPU Performance Hierarchy Table
MORE: All Graphics Content
Current page: Power Consumption, Fan Speeds, Clock Rates and Temperature
Prev Page Performance Results: 2560 x 1440 Next Page Software and Conclusion
Joe Shields is a staff writer at Tom’s Hardware. He reviews motherboards and PC components.
-
nofanneeded People should punish nvidia for releasing the RTX Super late .. this should be the real RTX.Reply
I boycotted nvidia after this "super" cheating. what they do is trying to trick AMD , but they dont care about us consumers. MANY people I know who bought the non Super Version switched to AMD and got the Radeon VII. -
N_tell Reply
Why the VII, you could acquire the RTX 2080 s in the same price range, or purchase an RTX 2070s for less. They're, not bad options.nofanneeded said:MANY people I know who bought the non Super Version switched to AMD and got the Radeon VII.