Why you can trust Tom's Hardware
All standard benchmarks and power tests are performed using the CPU’s stock frequencies (including stock Thermal Velocity Boost), with all power-saving features enabled. Optimized defaults are set in the BIOS and the memory is set using the XMP profiles. For this baseline testing, Windows is set to High Performance (power testing uses Balanced so the PC idles properly).
*The Asus ROG Strix Maximus XII Hero’s performance numbers have been updated since the ASRock Z490 Veloticate review. The results now reflect unlocked performance, which is the same as other boards.
Synthetic Benchmarks
Synthetics are a great tool to figure out if a board is running out of spec, as identical settings should produce extremely similar performance results. Advanced memory timings are the one place where motherboard makers can still optimize for either stability or performance though, and those settings can impact some testing.

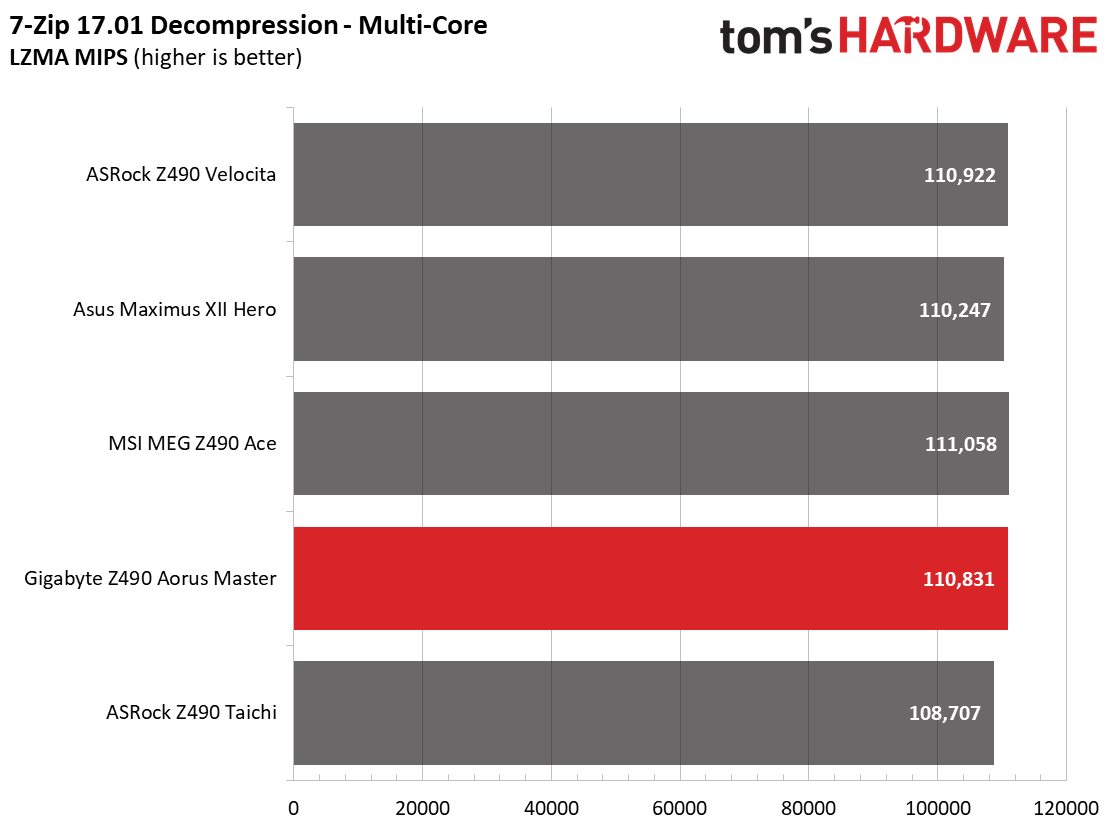
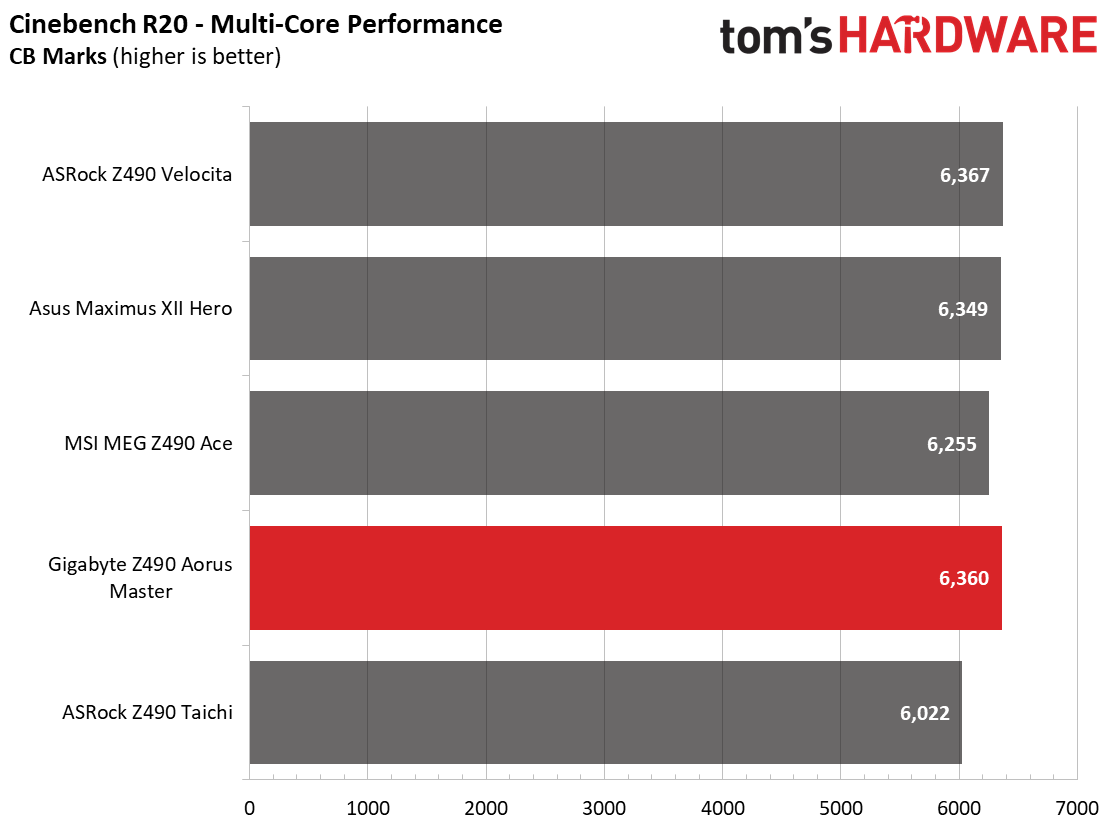
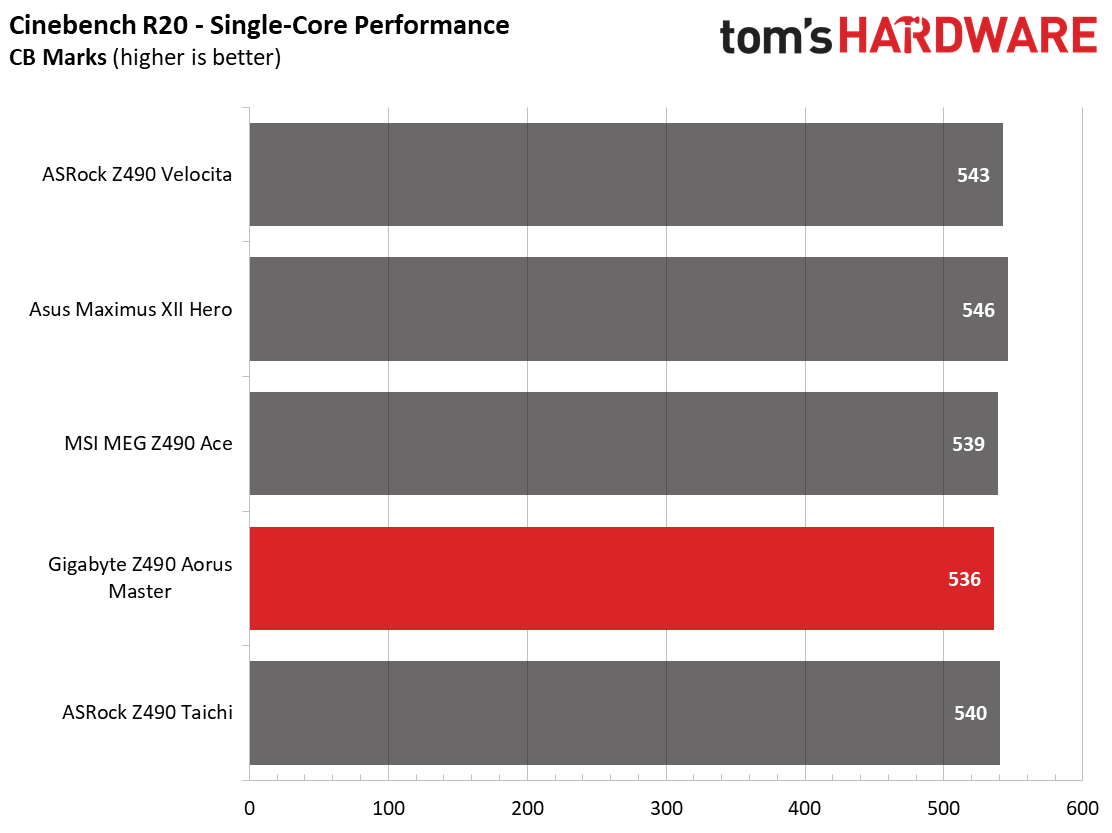
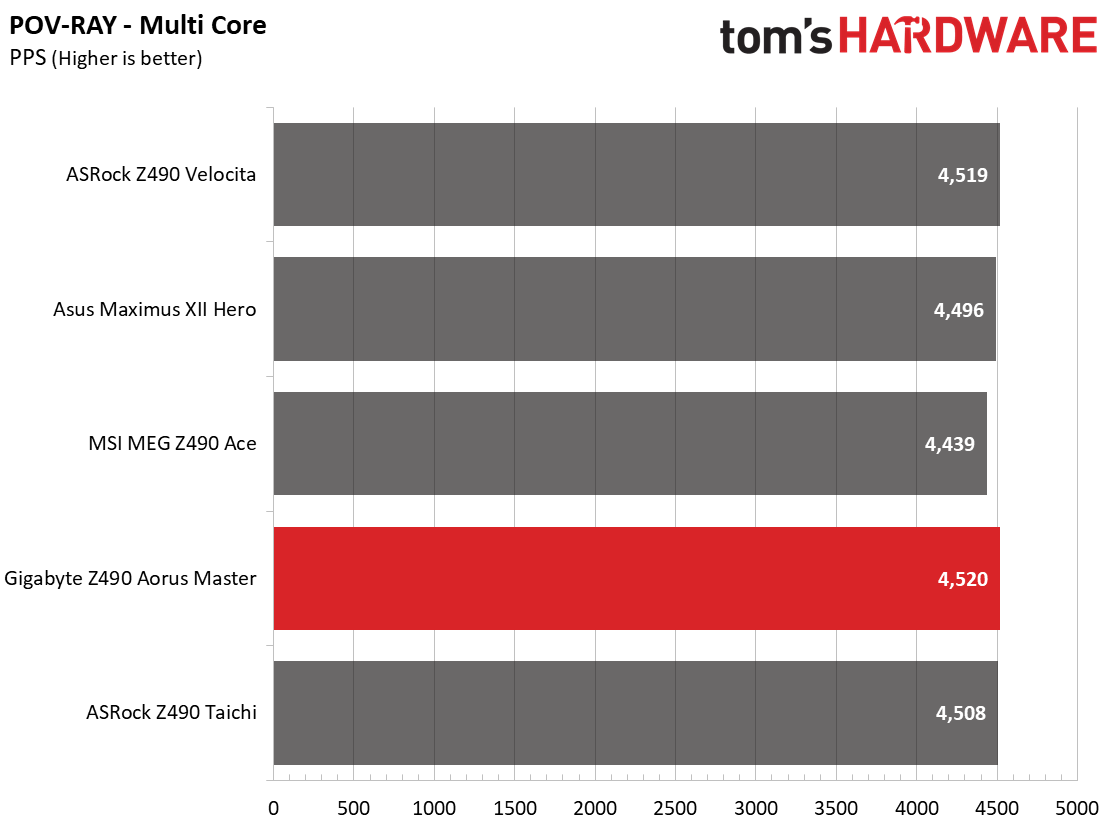
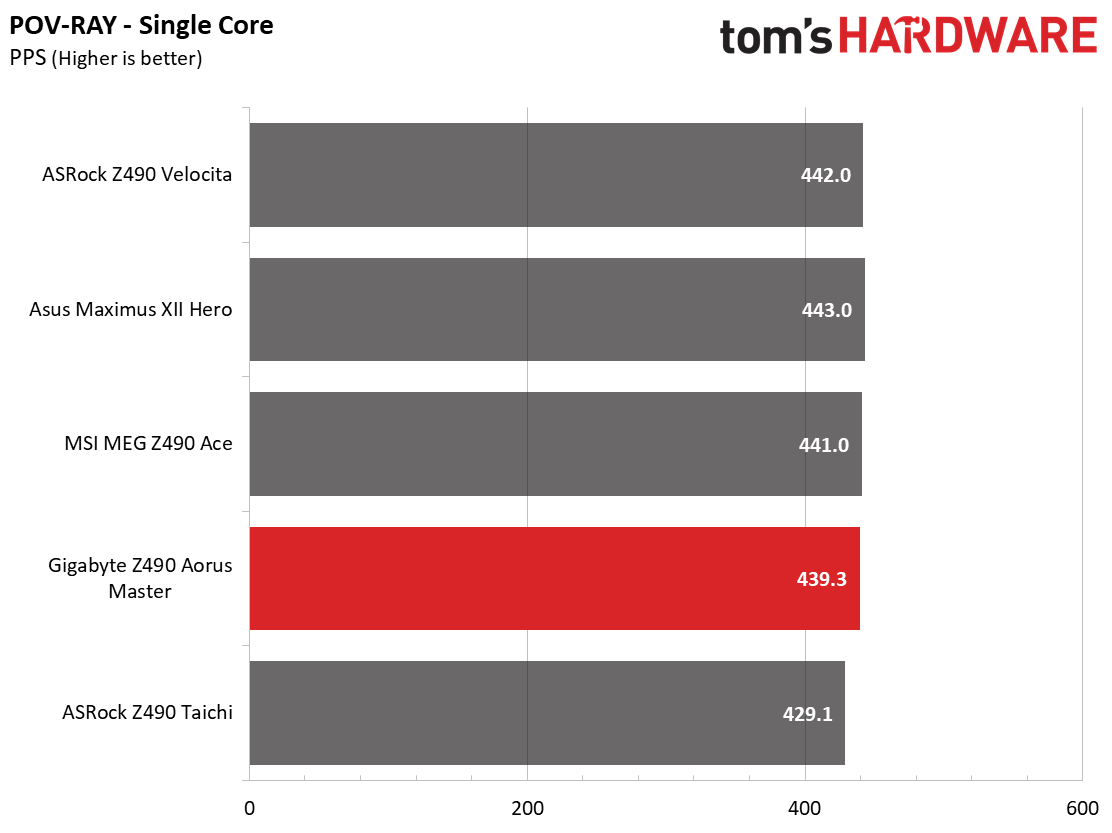
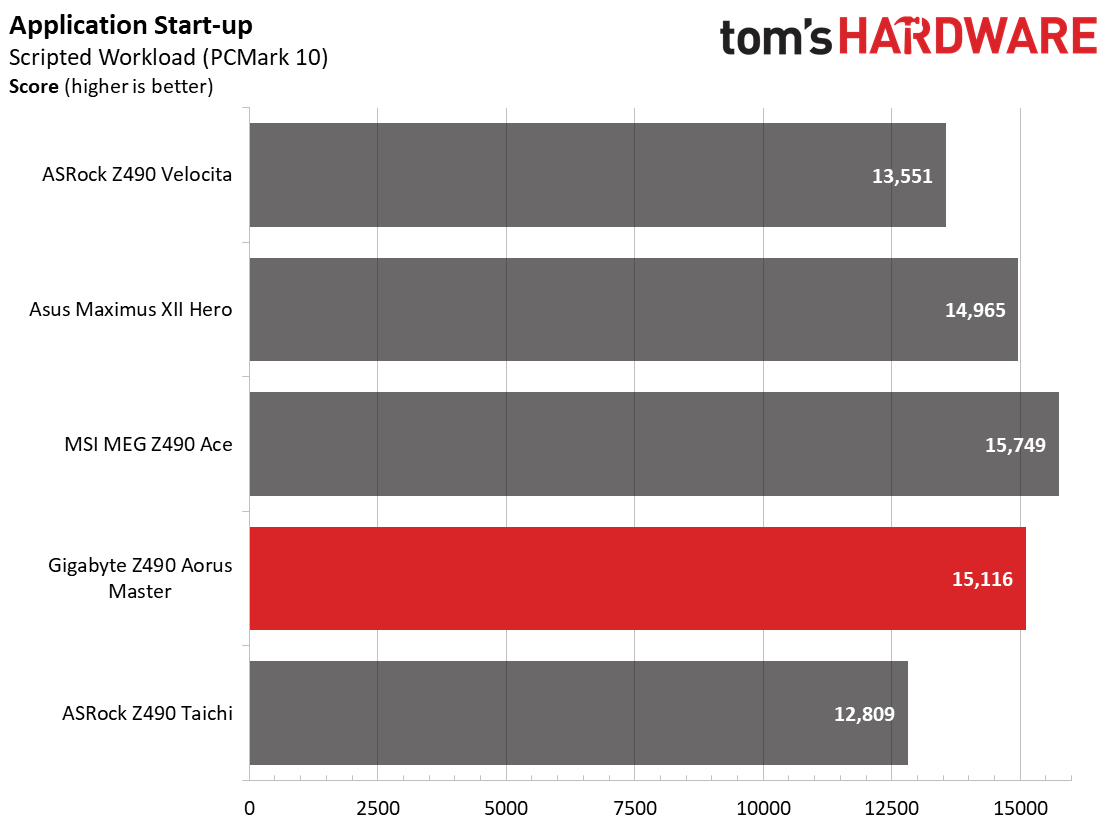
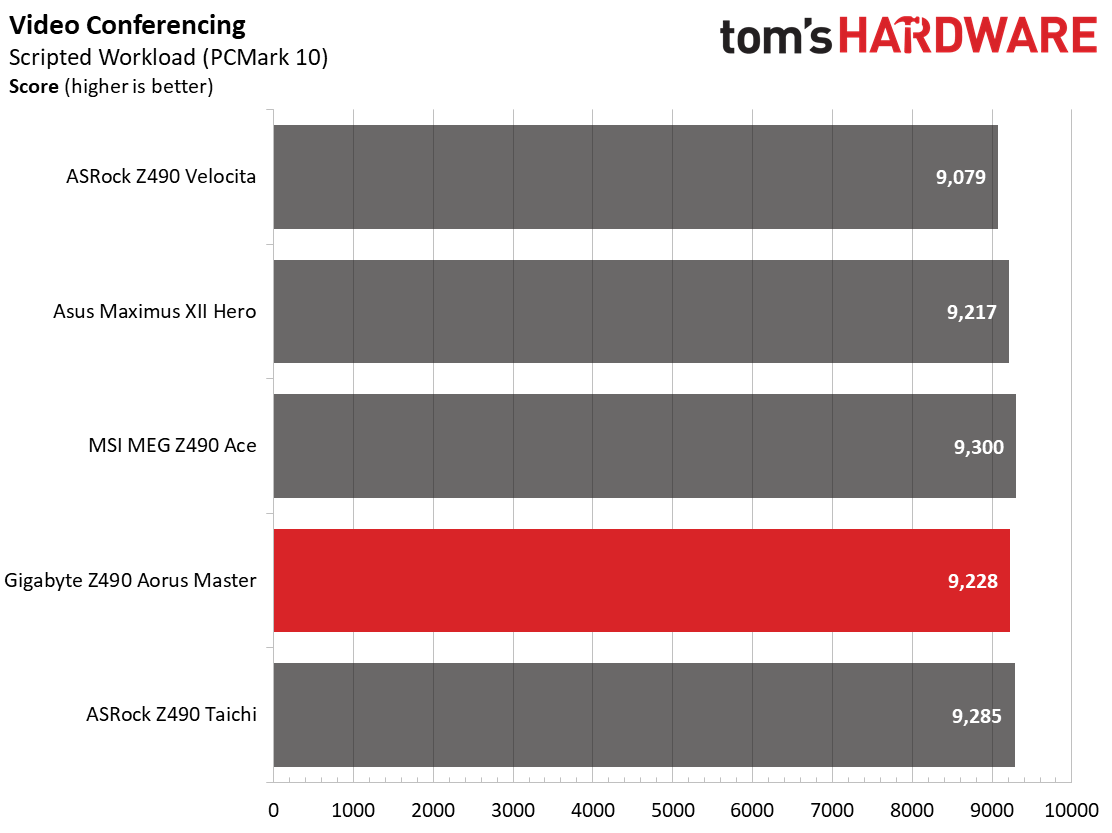
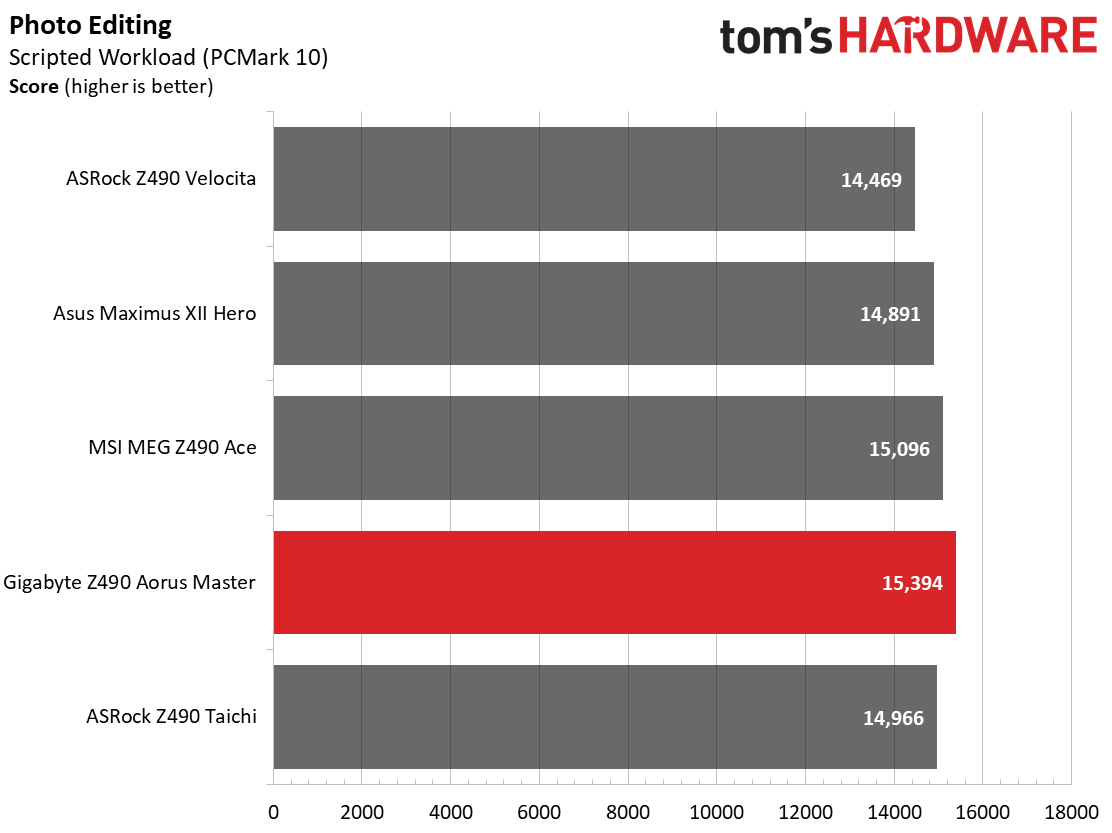
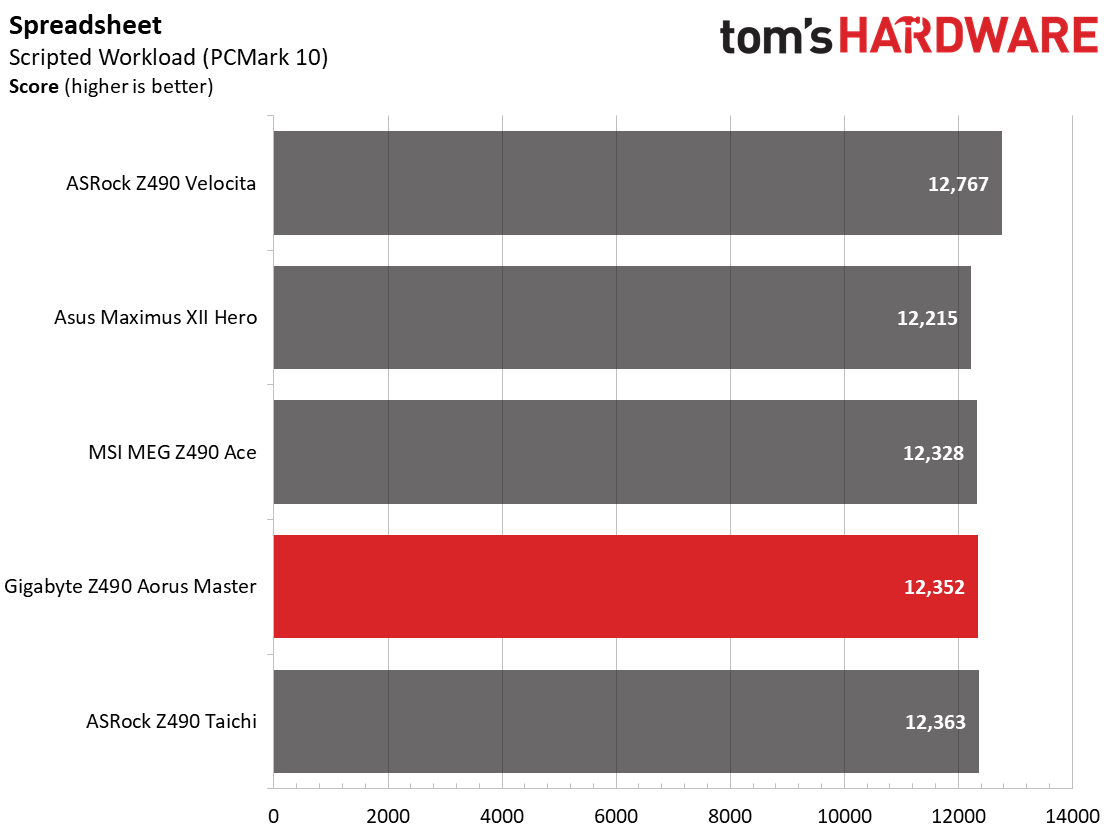
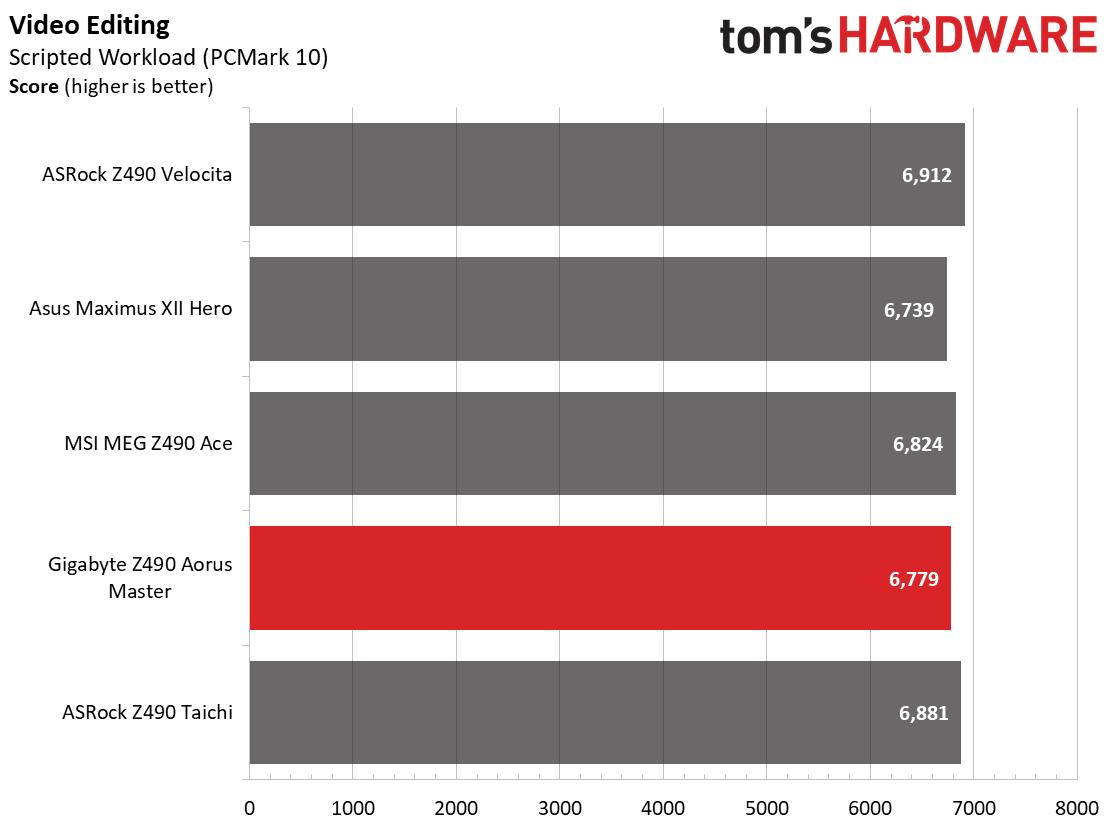
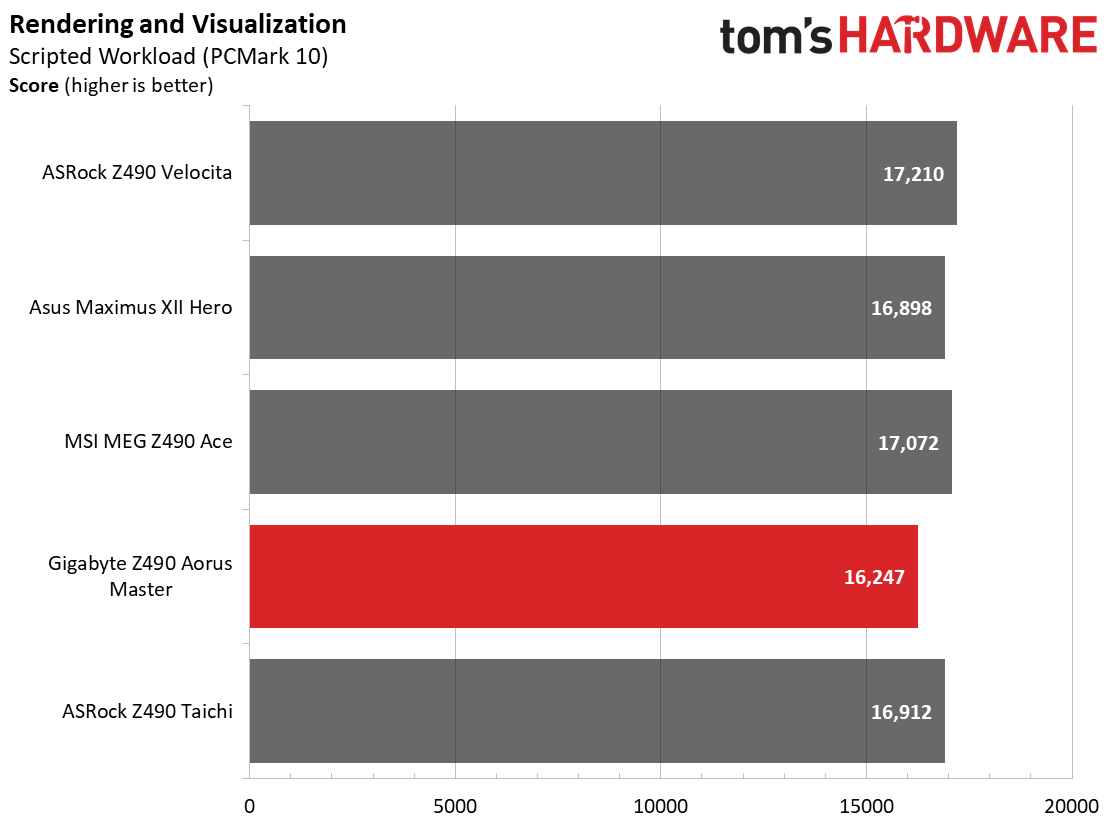
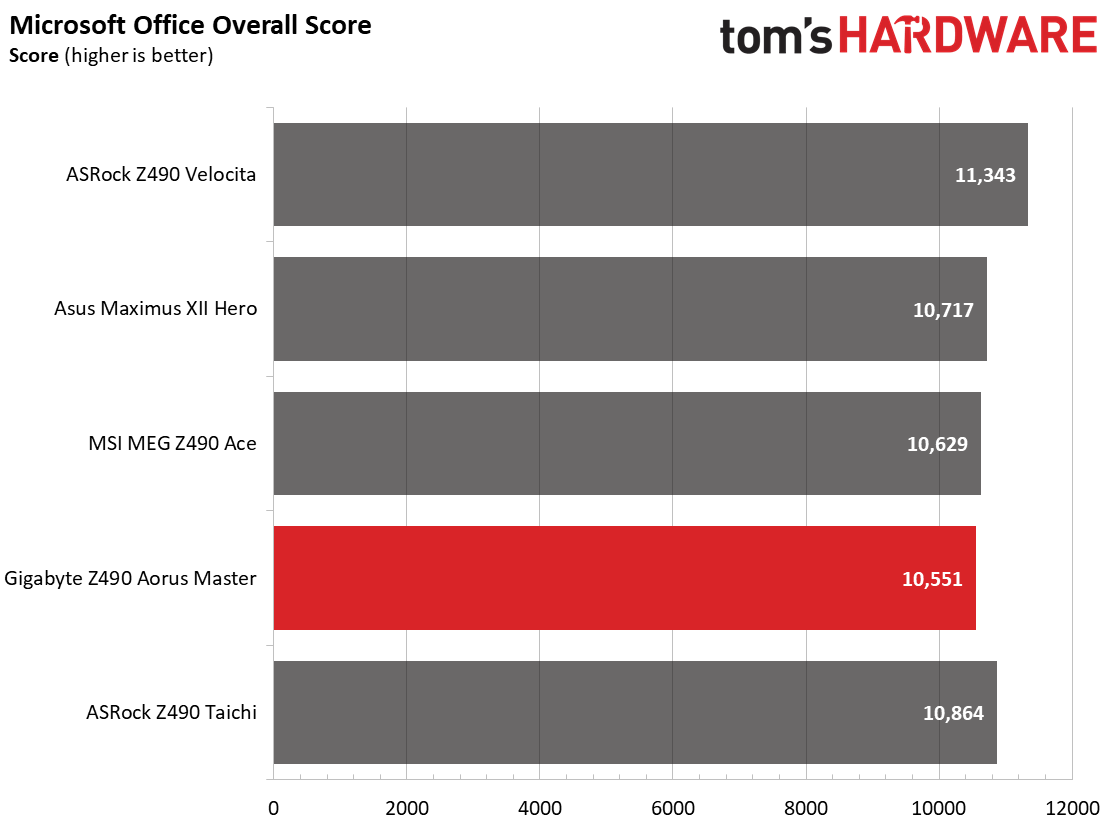
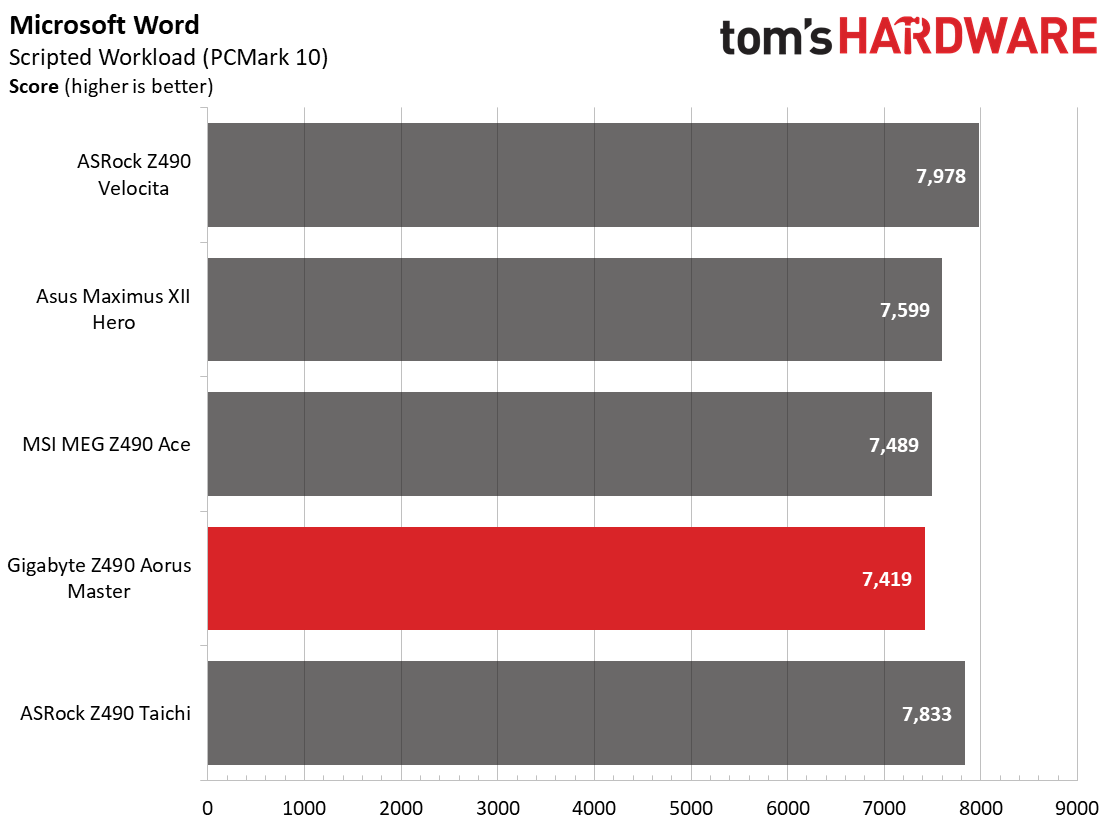
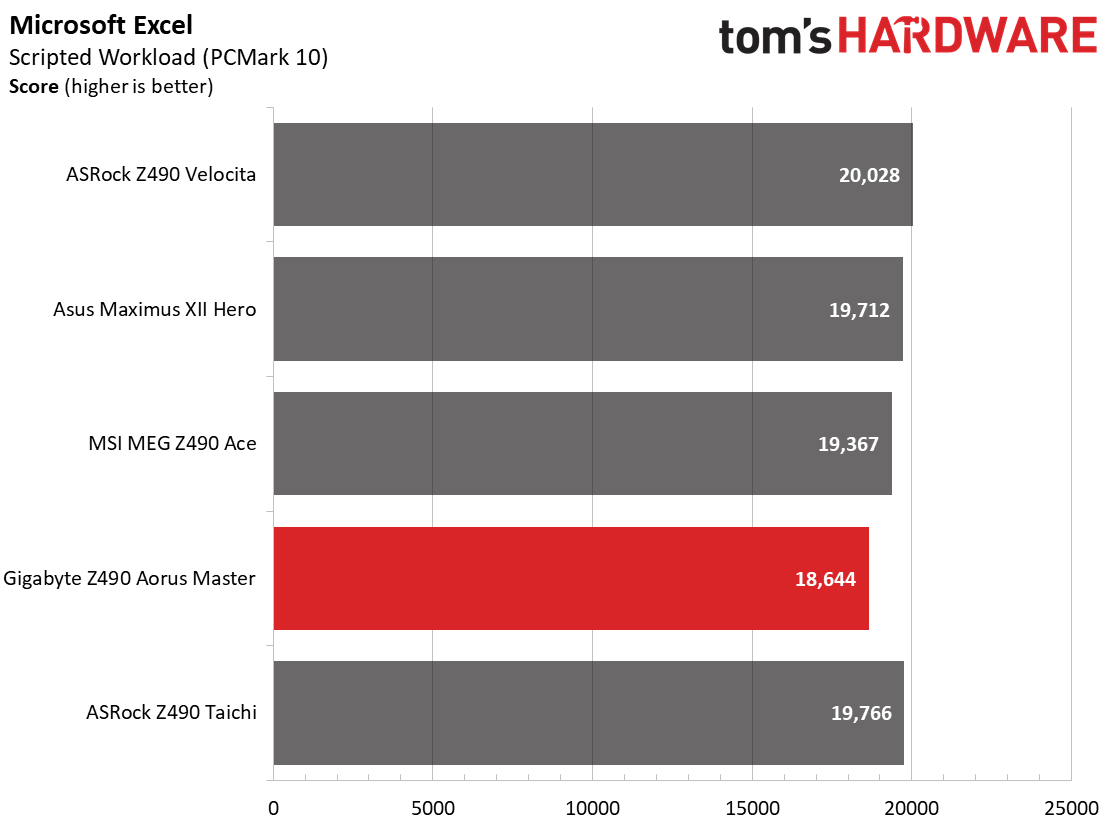
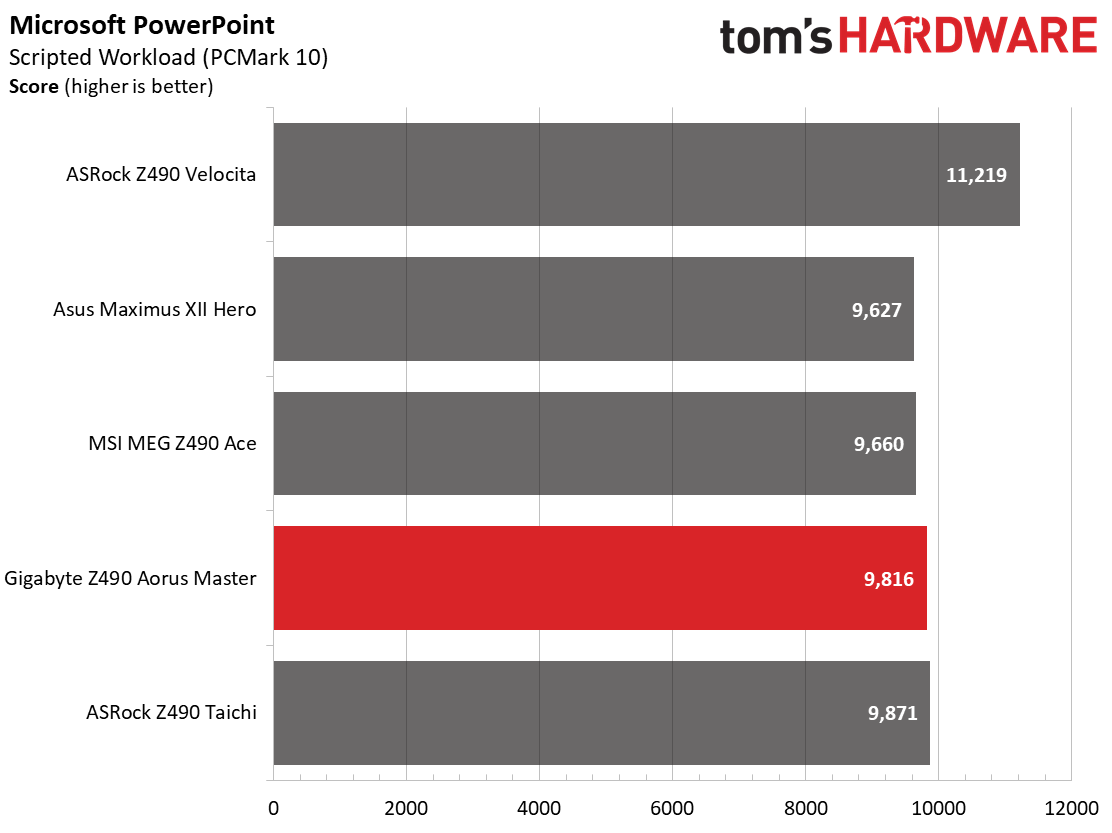
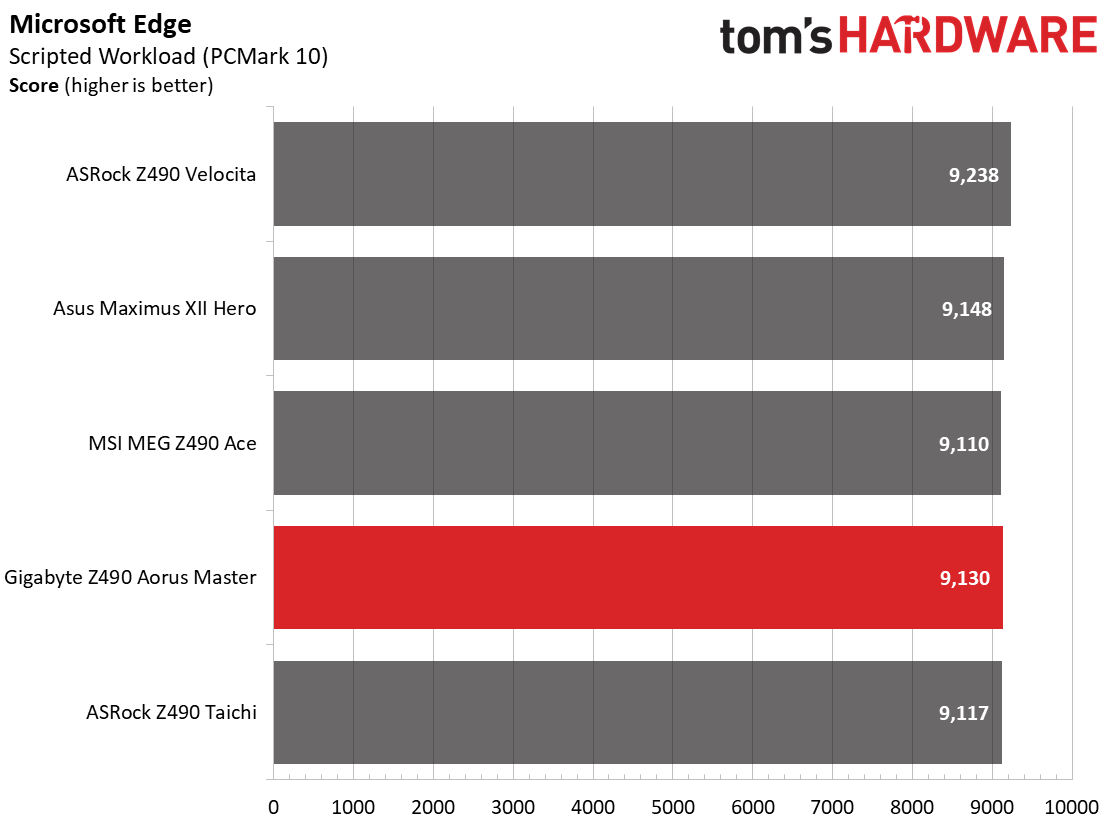
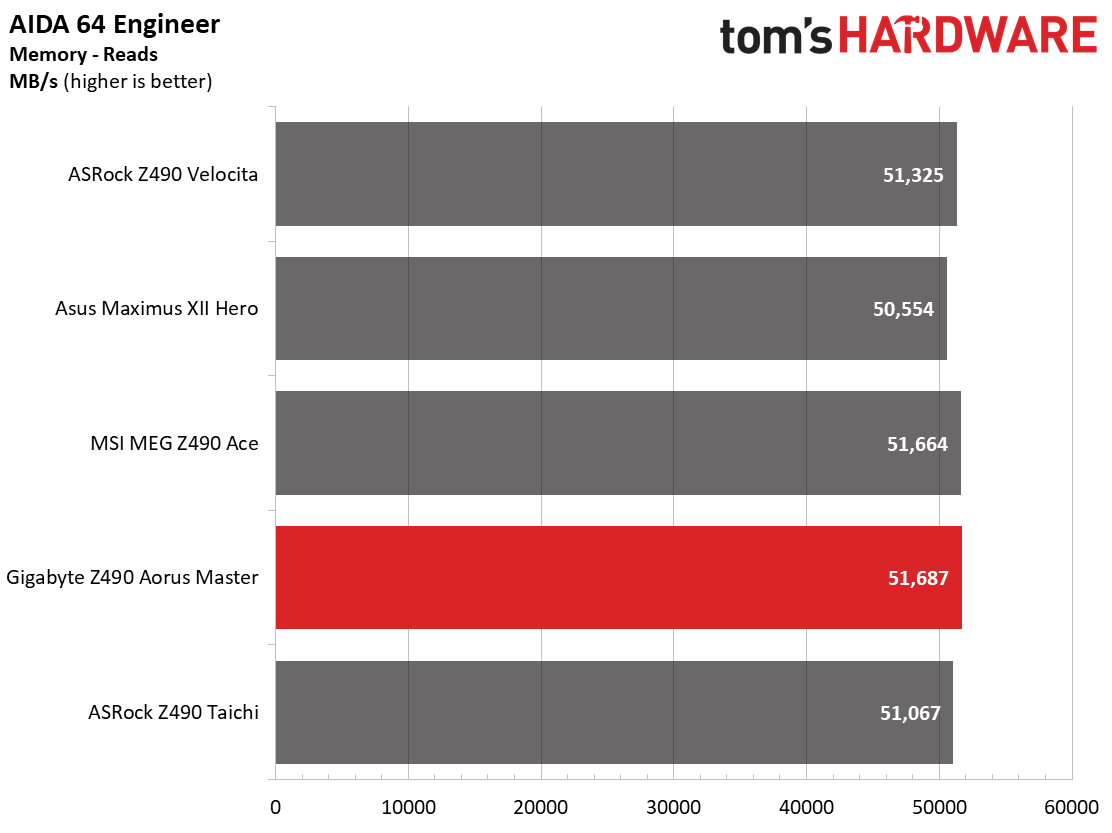
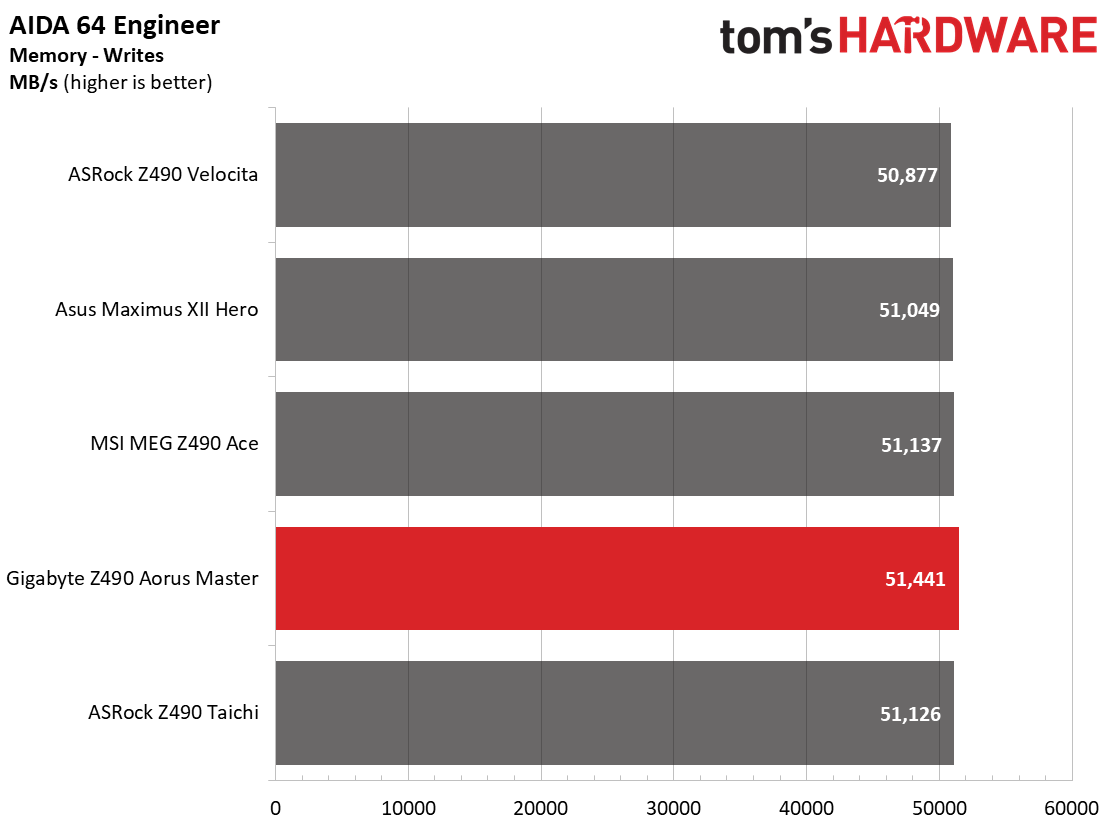
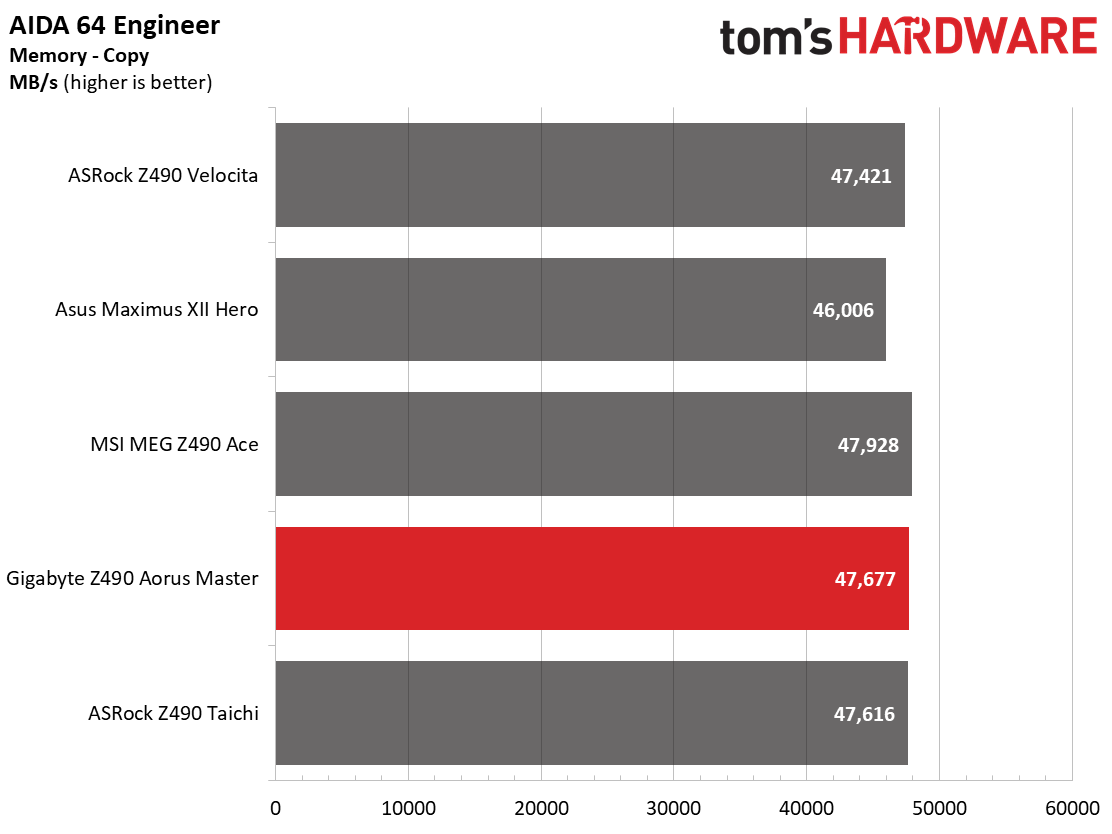
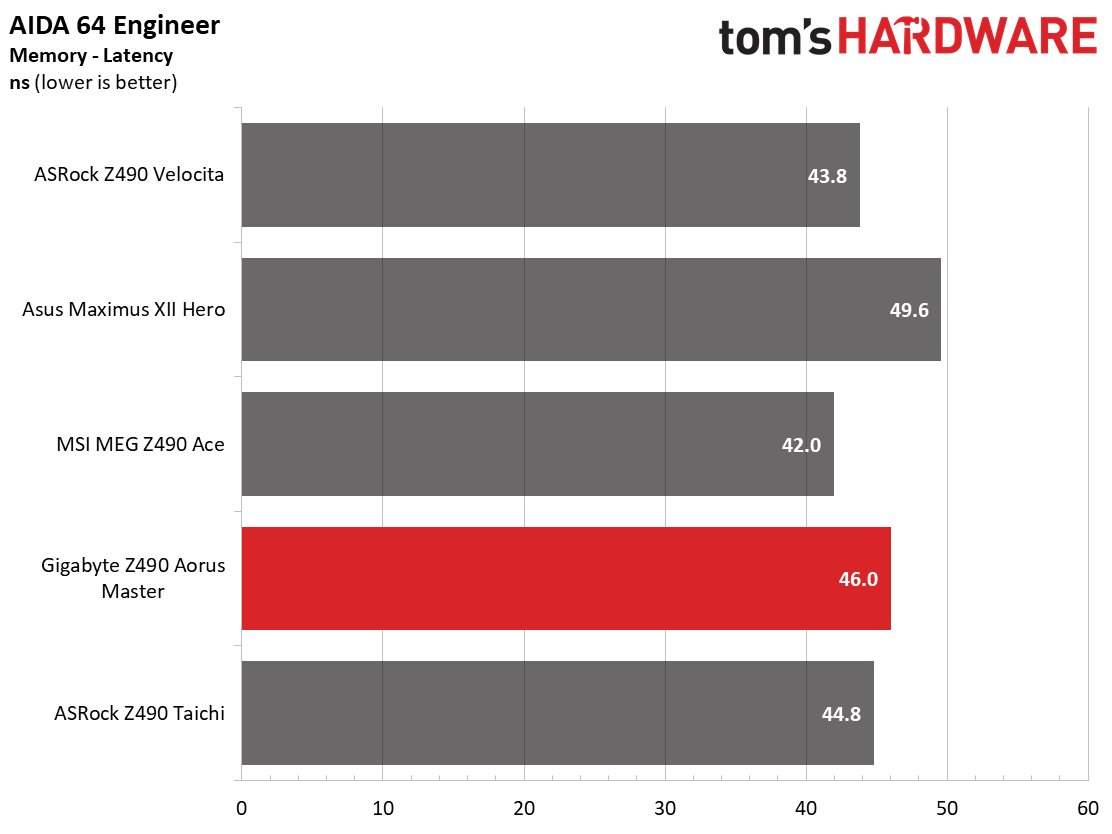
In our synthetic tests, the Aorus Master performed well overall, with results very close to the other boards. This board wasn’t the fastest in anything, and was only the slowest in 7Zip compression, matching up against the MSI MEG Ace for that dubious honor (not that either were off by much). By default, the Master boosts to 4.9 GHz on our i9-10900K with all cores and threads for the majority of tests.
Timed Applications
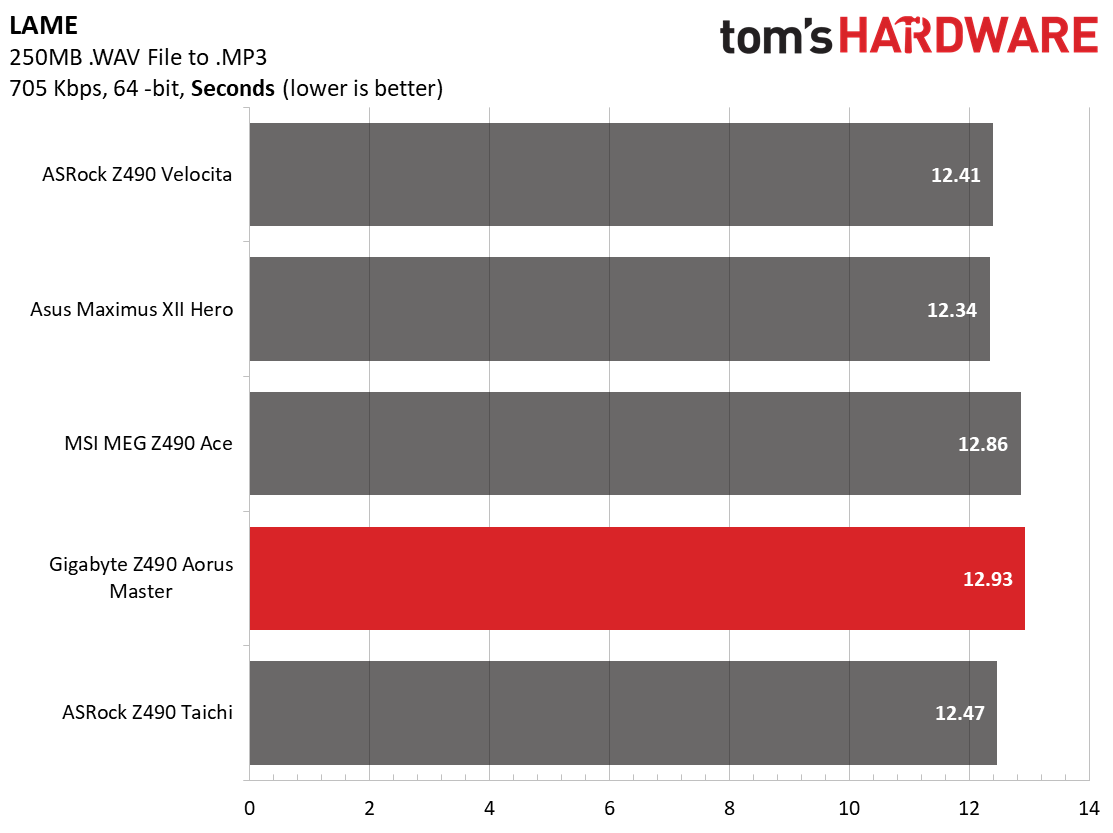
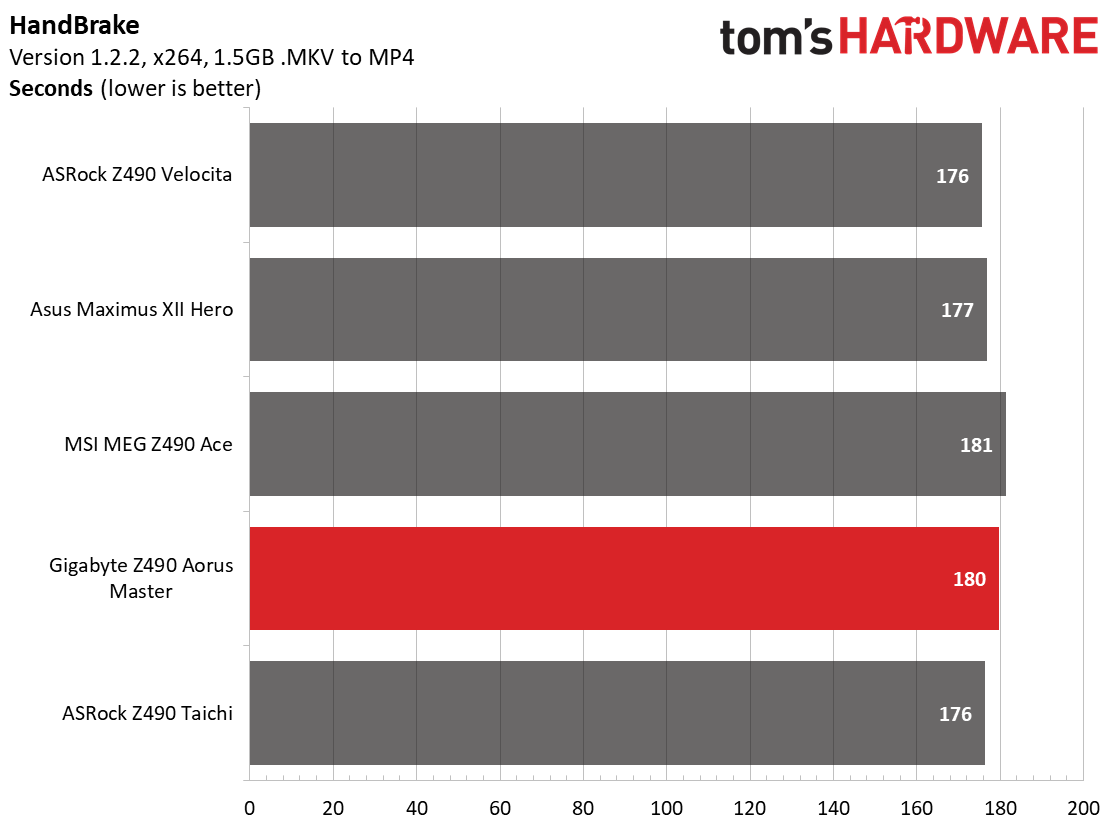
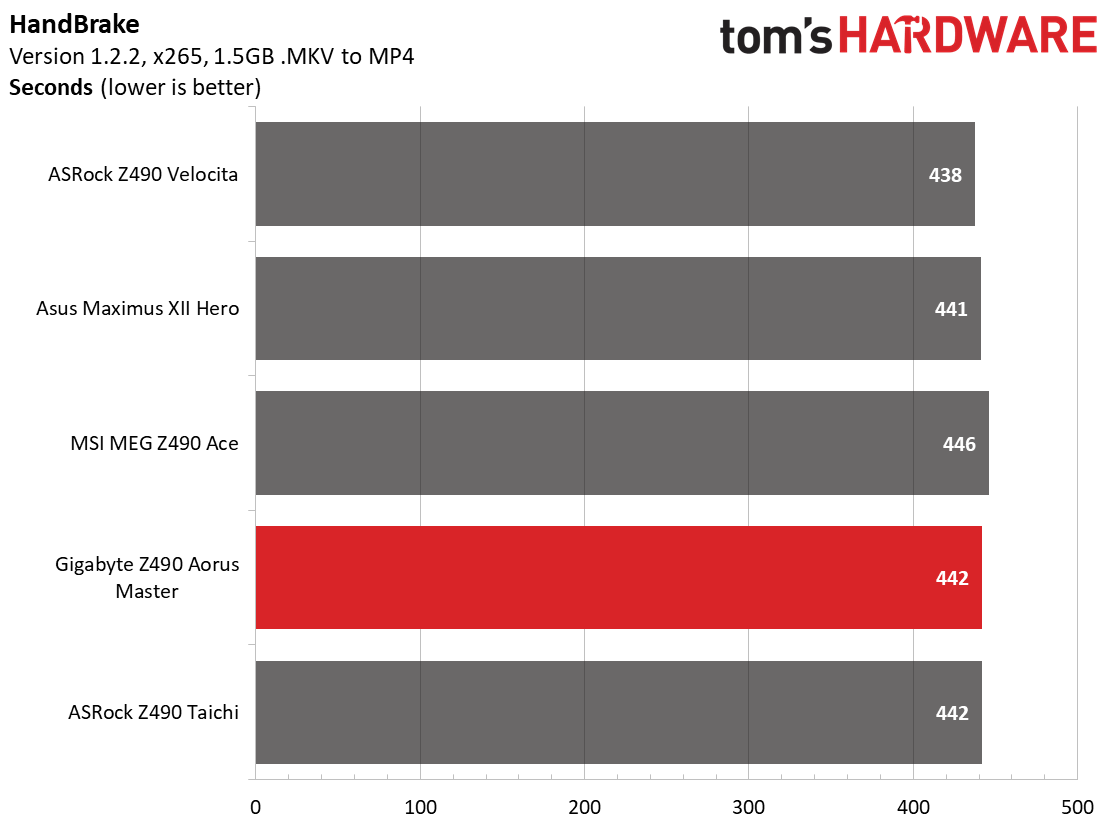
Our timed applications show the Velociata, Taichi, and Hero are a few seconds faster in the x264 portion of the Handbrake test, with little difference in x265. The LAME testing was the worst result here, a couple of tenths behind all others except for the MSI Z490 MEG Ace that was within the margin of error for this test. Corona's results proved to be the fastest, matching the freshly re-tested Maximus XII Hero. That said, the ‘worst’ result is a mere 1 second slower so these are all closely grouped together.
3D Games and 3DMark
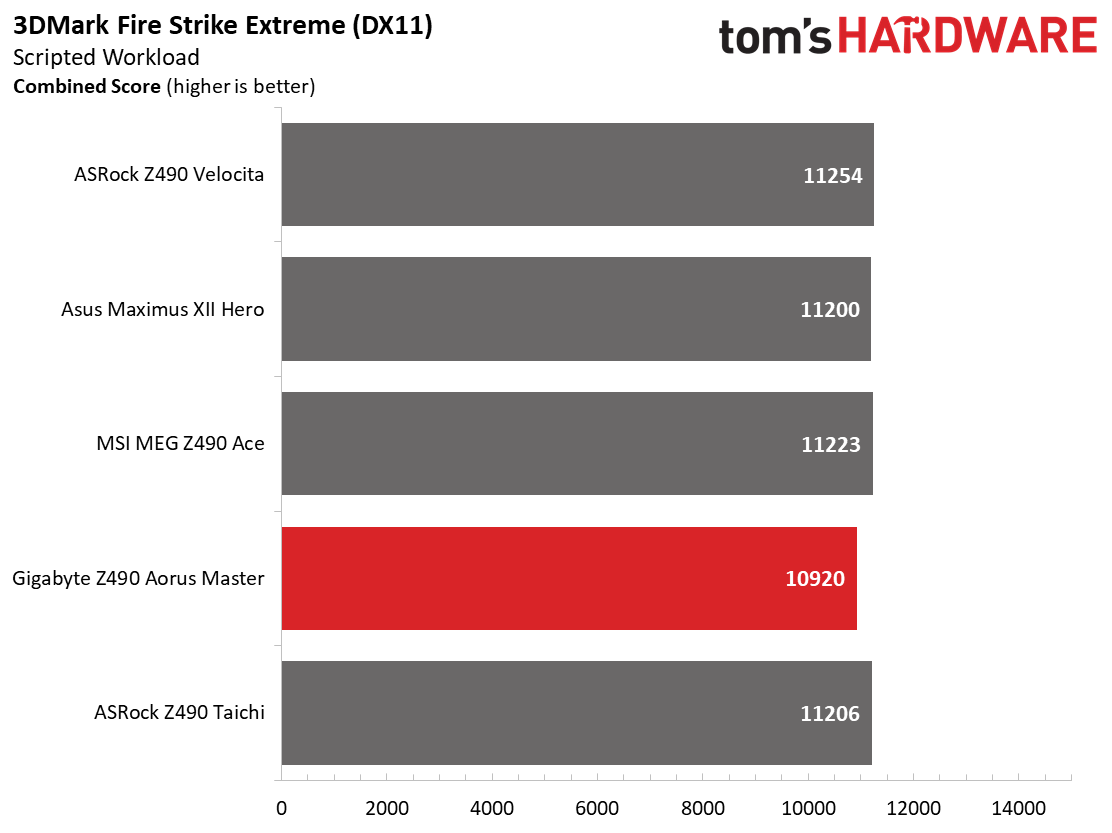
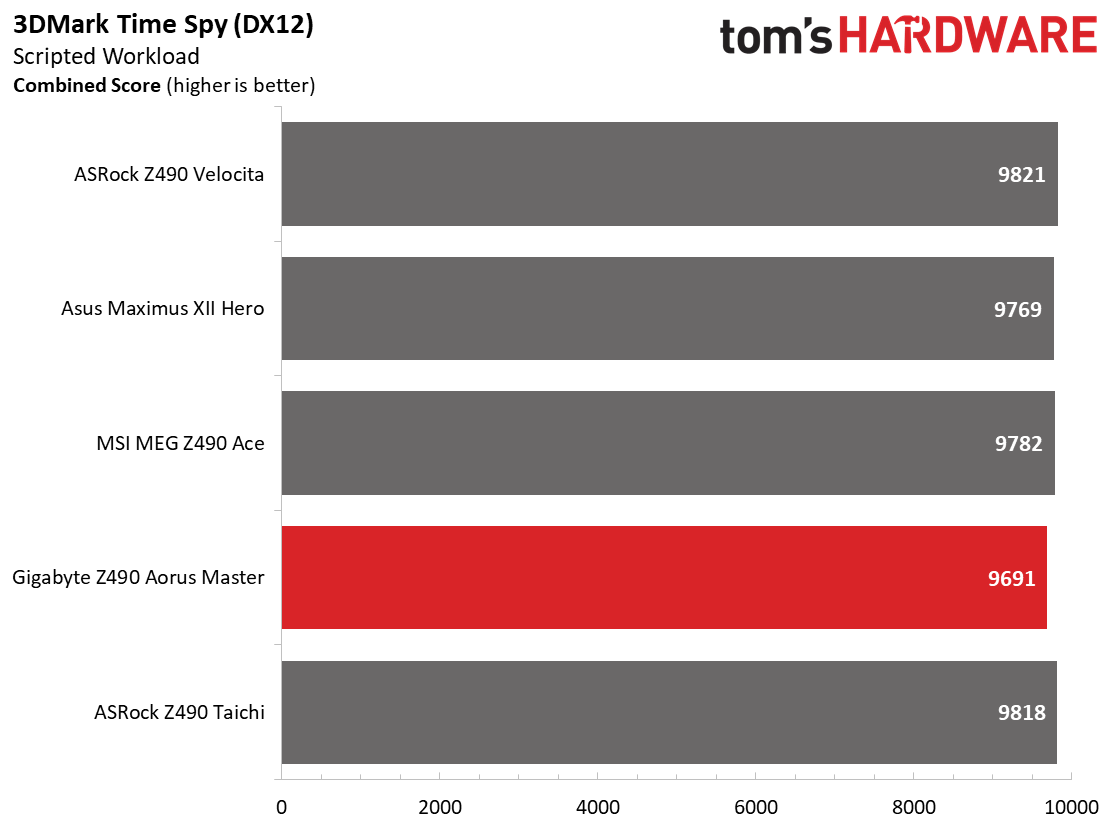
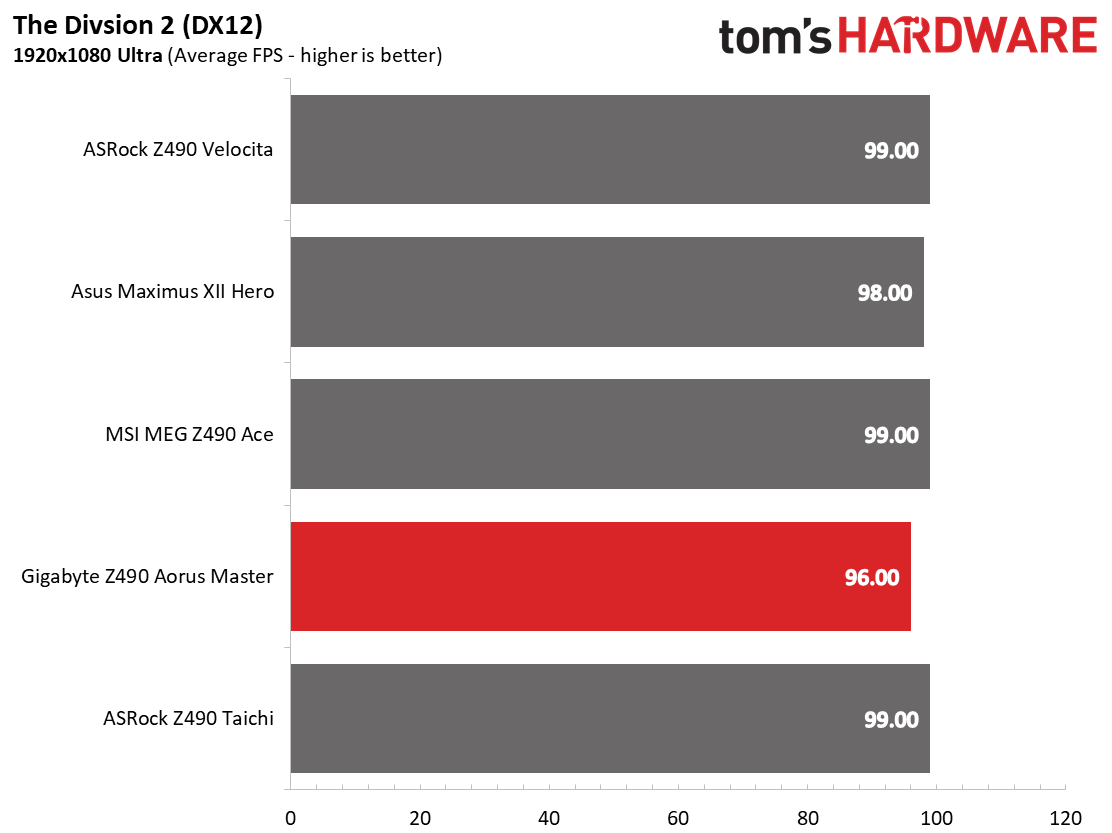
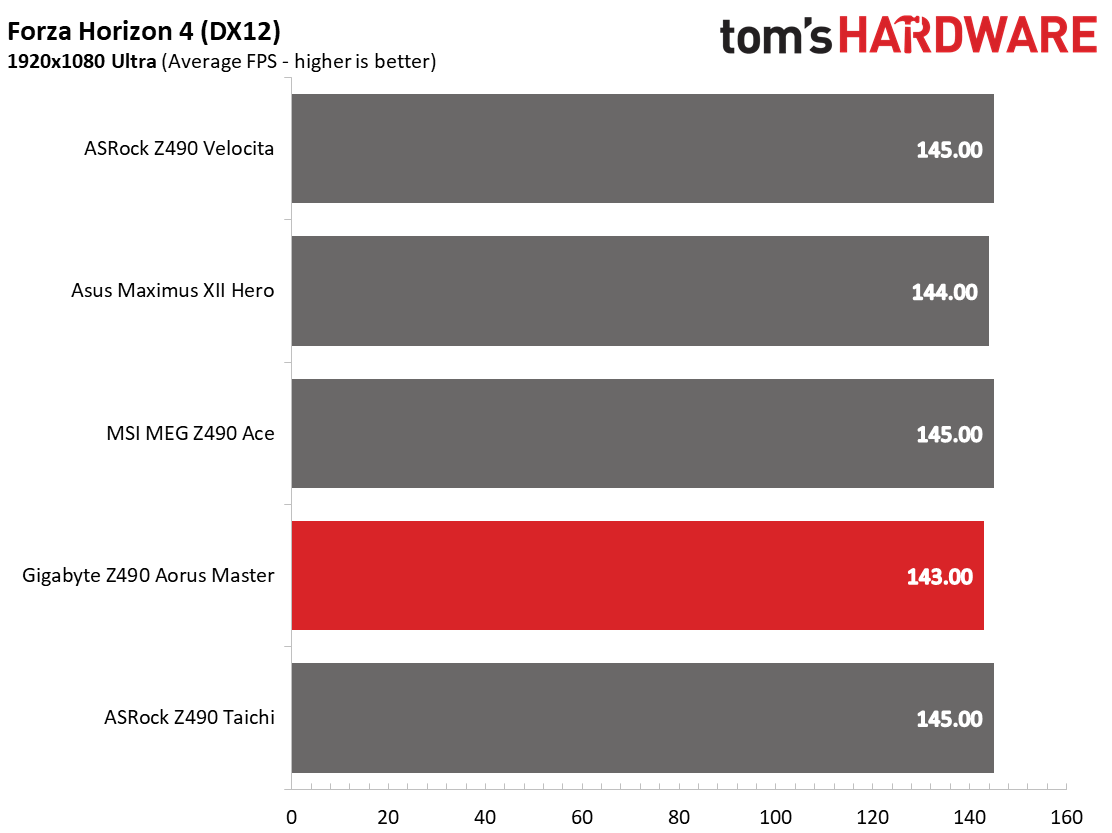
We’ve recently updated our game tests to more modern titles The Division 2 and Forza Horizon 4. The games are run at 1920x1080 resolution using the Ultra preset. As the resolution goes up, the CPU tends to have less of an impact. The goal with these settings is to determine if there are differences in performance at the most commonly used resolution with settings most people use or at least strive for.
In both 3DMark tests, the Aorus master was slightly behind all the other boards. Fire Strike extreme was over 2% slower while Time Spy was just over 1%. In the gaming tests, the system actually ran 2 FPS (~2%) slower in The Division with a less than 1% difference in Forza. While slower, these differences won’t be noticeable.
Get Tom's Hardware's best news and in-depth reviews, straight to your inbox.
Power Consumption / VRM Temperatures
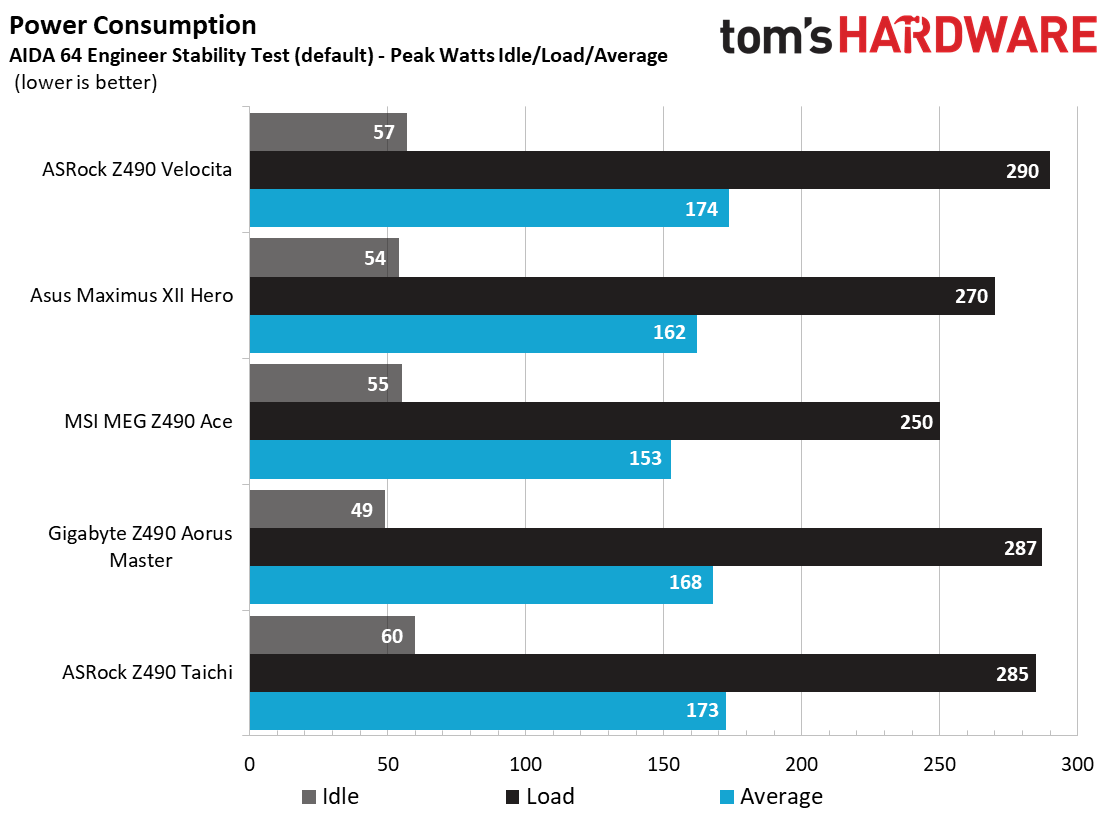
Our first glimpse of power use for this platform and the 10c/20t i9-10900K may be a bit shocking to some. With loads reaching over almost 200W at stock speeds, many users will be hard-pressed to keep these cool and get the most out of the chip. For power testing, we used AIDA64’s System Stability Test with Stress CPU, FPU and Cache enabled using the peak power consumption value. The wattage reading is taken from the wall via a Kill-A-Watt meter to capture the entire ecosystem; the only variable that changes in these reviews is the motherboard -- all other parts are the same.
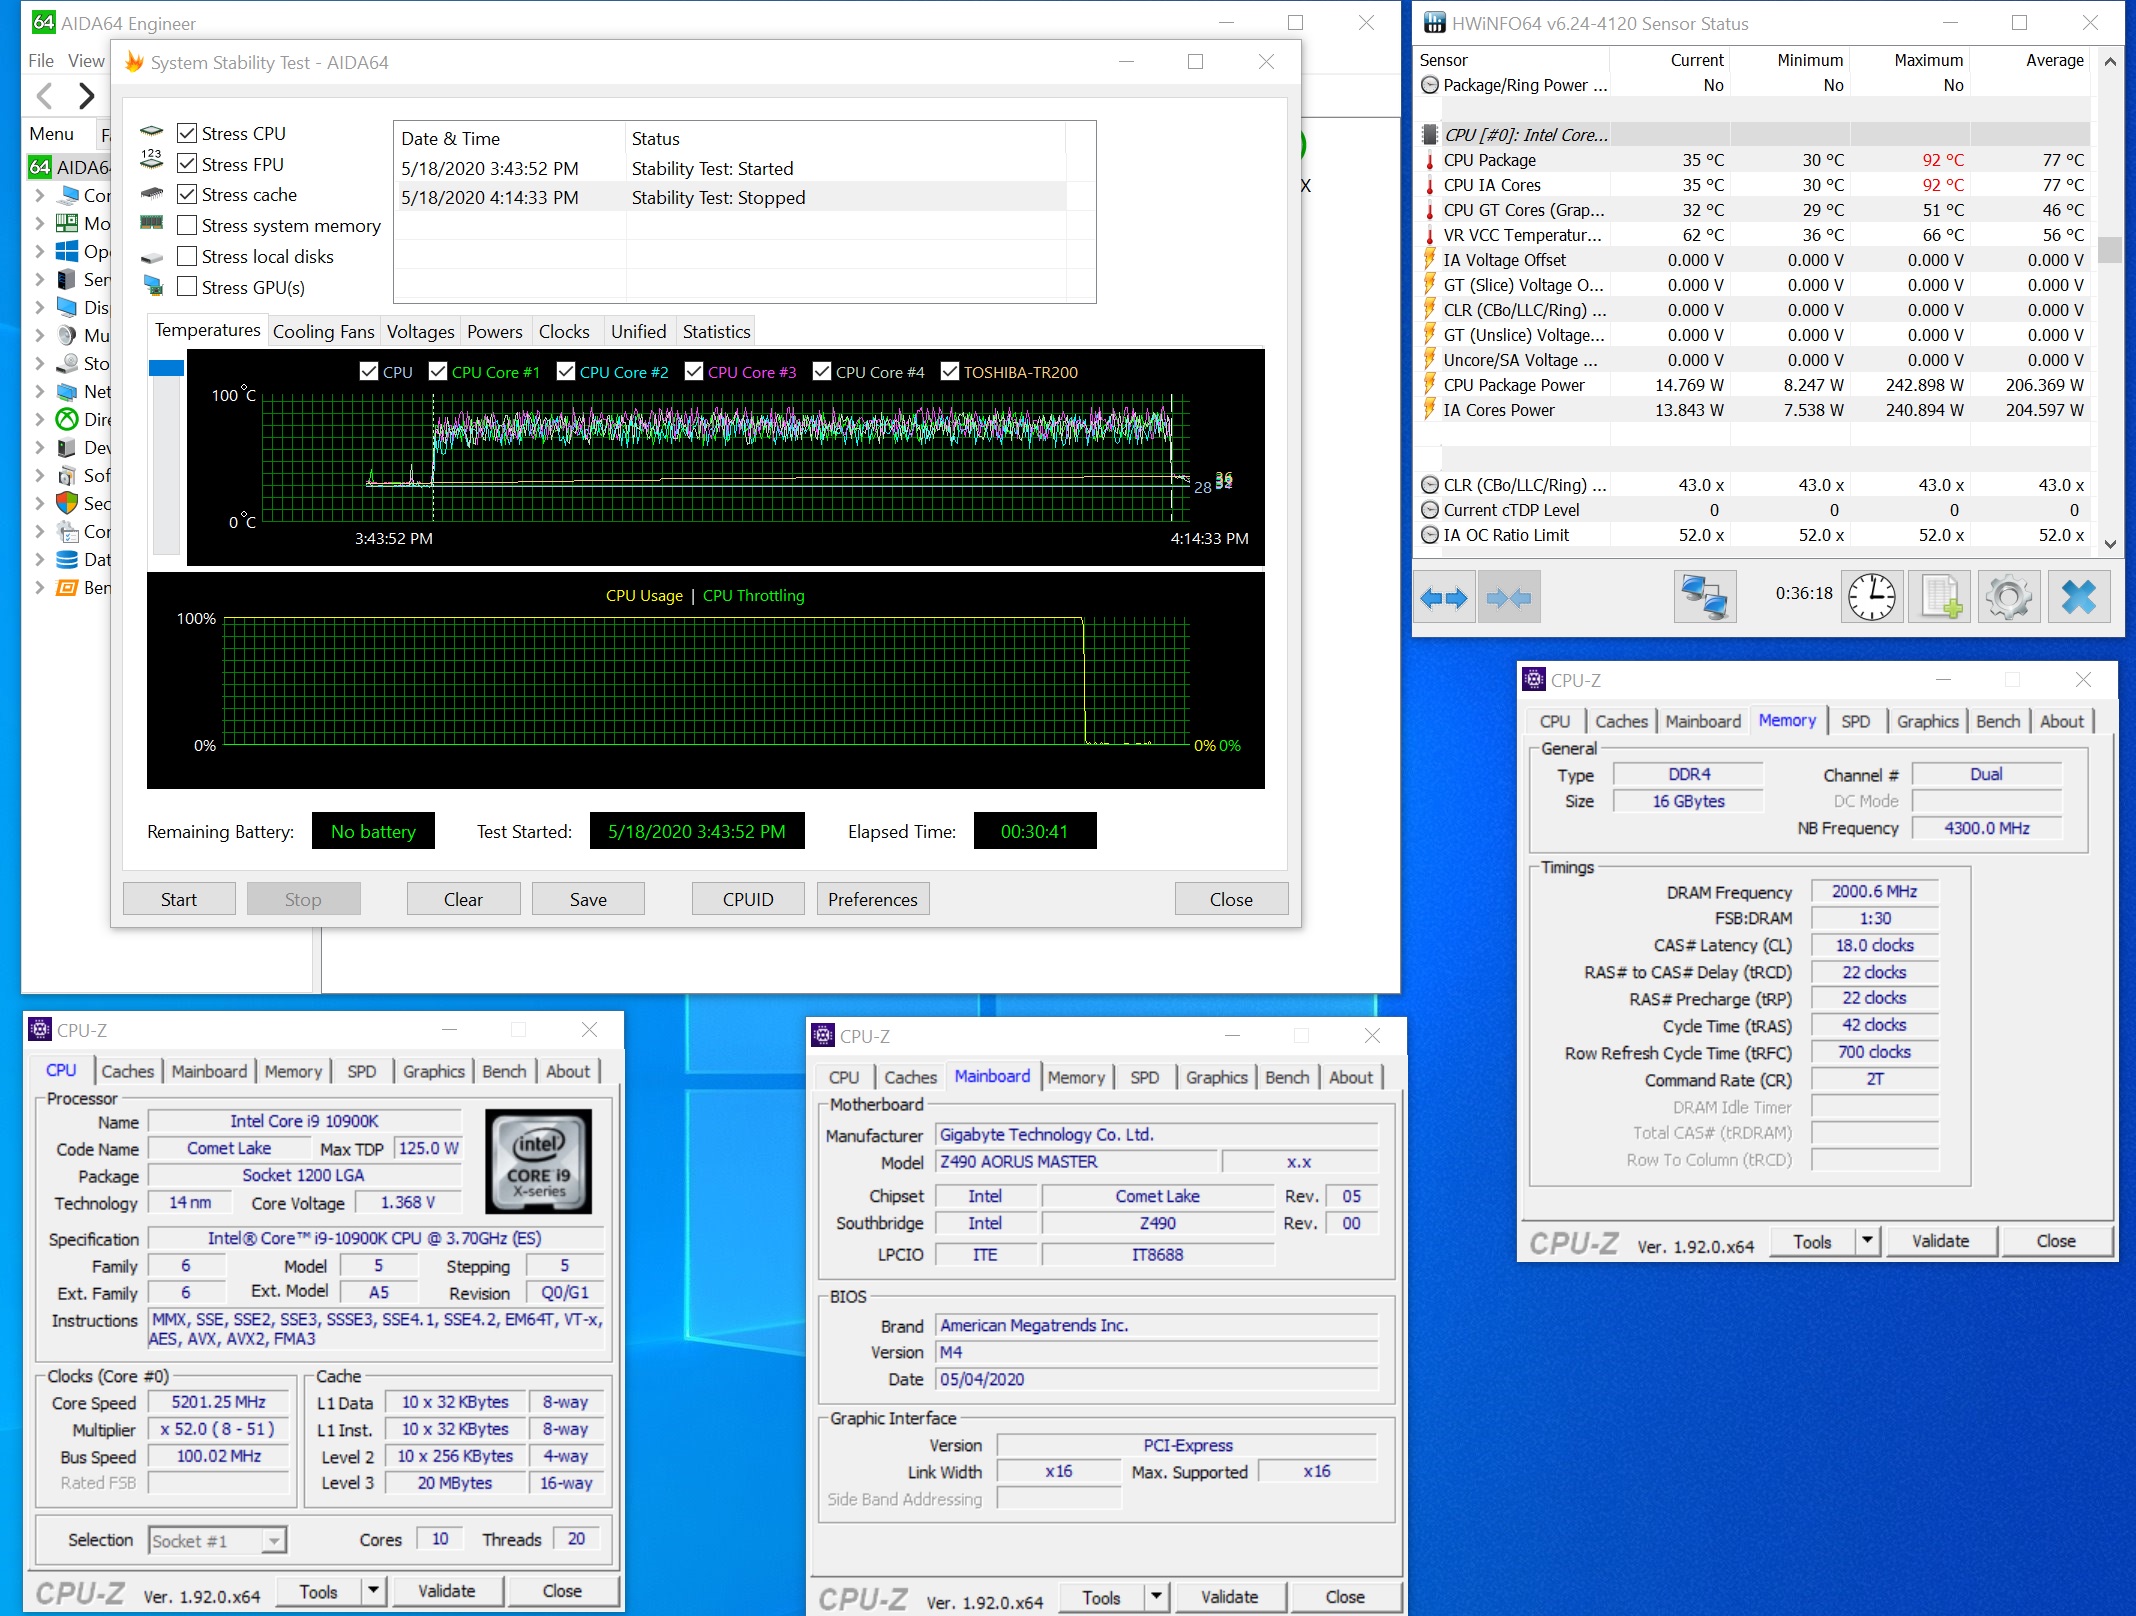
The Aorus Master idled at a very low 49W while using 287W under load, the second-highest reading so far. Actual wattage for the CPU according to HWInfo64 reached 199W. Other boards used slightly less power.
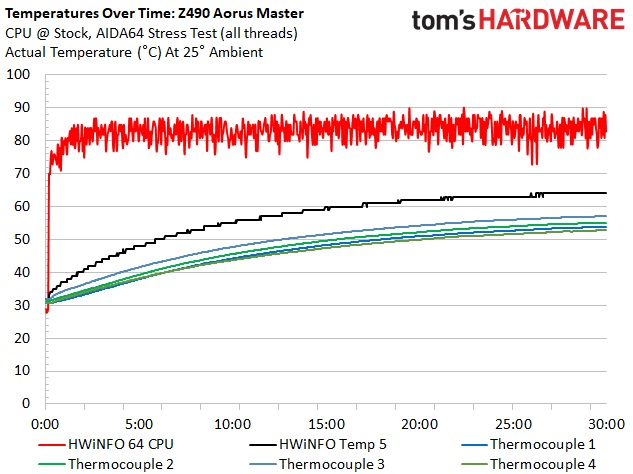
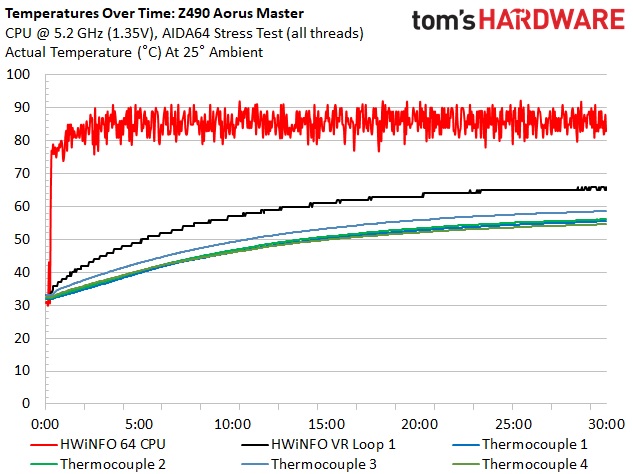
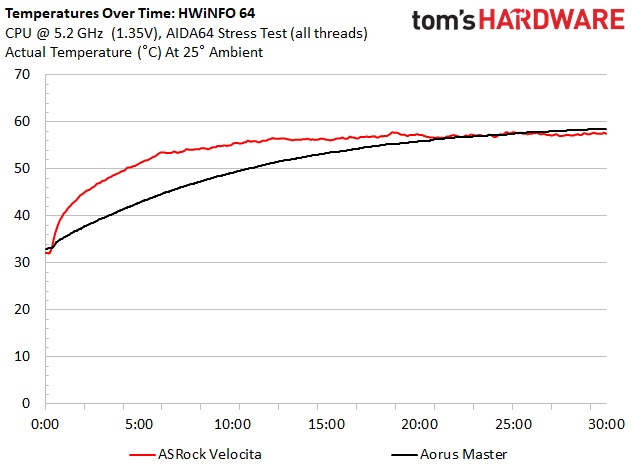
For VRM testing, the Aorus Master’s finned heatsinks did a surprisingly good job keeping the VRMs cool at stock and while overclocked. During stock operation, the VRMs peaked at 57C. While overclocked, temps reached 59C. These temperatures are warmer than the Velocita, but remember that board has even bigger heatsinks plus three tiny fans actively cooling them. This is a good showing for the heat piped heatsinks.
Overclocking
Getting a bit of experience behind the wheel with these chips, on our sample, cooling limits us to around 1.35V, which ends up at 5.2 GHz using all cores and threads. With this setup, the AIDA64 Stress test ran for 30 minutes without an issue. We raised the LLC up to compensate for a bit of vdroop, plodding through the test at over 90 degrees Celsius. As expected, the VRMs are more than capable of managing to run with good temperatures while our CPU pulls over 240W at the overclocked settings.
On the memory side, we swapped out the GSkill Trident Z Neo DDR4 3600 sticks with a Trident Z Royal kit rated at DDR4 4000. Again, we were unable to stabilize 4x8GB at that speed with what fiddling I did, but 2x8GB DDR4 4000 wasn’t a problem.
Final Thoughts
The Gigabyte Z490 Aorus Master is priced at $389.99, which places it between the-more expensive Asus ROG Maximus XII Hero ($399.99) and MSI MEG Z490 Ace ($399.99) and the ASRock Z490 Taichi ($369.99). Truth be told, all of the boards listed above are good options in the sub-$400 category. They all sport solid VRMs and are able to overclock the i9-10900K to thermal limits. With that, it still comes down to looks, features, and appearance, considering performance and pricing are so close together.
Gigabyte has improved the appearance of the Z490 Master compared to its Z390 predecessor. The brushed-aluminum heatsinks on the chipset and M.2 cover the PCB. The MEG Ace and Maximus XII Hero, while also improved over the last generation, don’t have quite as clean of a look. But again, beauty is in the eye of the beholder.
If we look at the features/specifications Gigabyte lists the highest Memory support (of course, your mileage may vary), up to DDR4 5000. All boards include six SATA ports and 2.5 GbE LAN, but only the Asus Hero has faster (5 GbE) LAN. Given that, people are going to fall back on looks and price. Assuming they meet your needs, is the Master worth spending $20 more over the Taichi? If you do not want a fan on the VRMs and prefer better power delivery in general, plus the ability to use onboard temperature sensors, that cost is easy to justify.
MORE: Best Motherboards
MORE: How To Choose A Motherboard
MORE: All Motherboard Content
MORE: Best Motherboards
MORE: How To Choose A Motherboard
MORE: All Motherboard Content
Current page: Benchmark Results and Final Analysis
Prev Page Test System and Comparison Products
Joe Shields is a staff writer at Tom’s Hardware. He reviews motherboards and PC components.
