System Builder Marathon Q4 2014: $1600 Performance PC
Benchmark Results
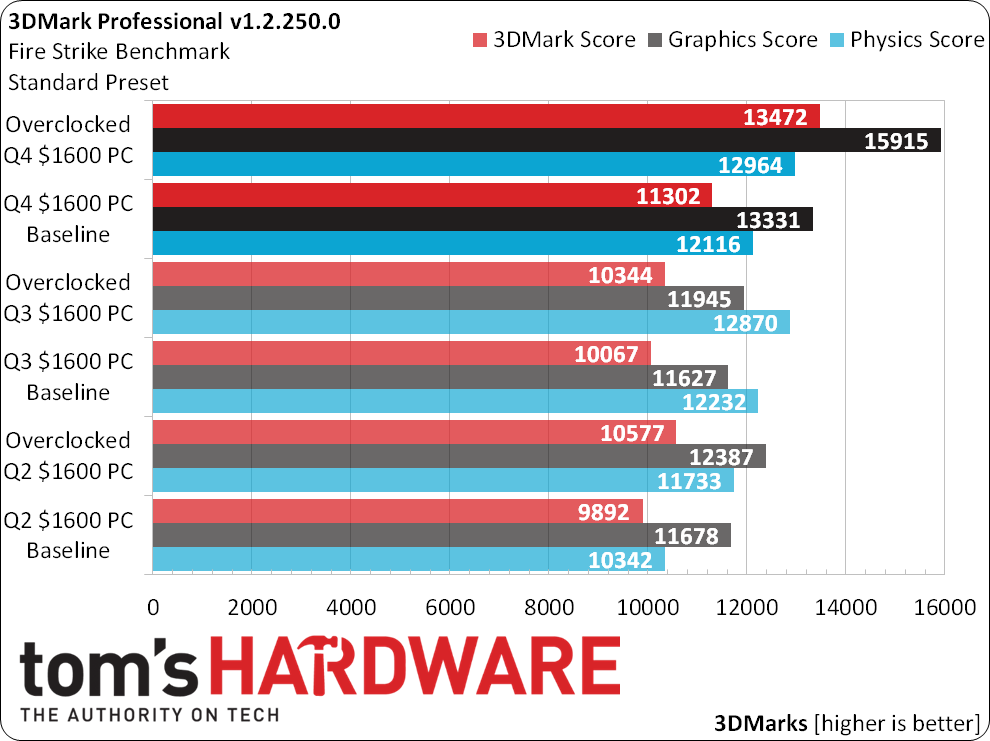
The new build’s stock settings look a little slow in 3DMark’s CPU-based Physics score, which is odd since its motherboard defaults to 100.5 MHz (a 0.5% “stock” O/C). That loss turns into a gain when overclocked, even though both processors were set to the same multiplier when overclocked. Perhaps a variance of 100 3DMarks is normal?
Or maybe I’m just burying the lede. Enormous gains in GPU performance led to large victories for the new system in 3DMark’s overall score.
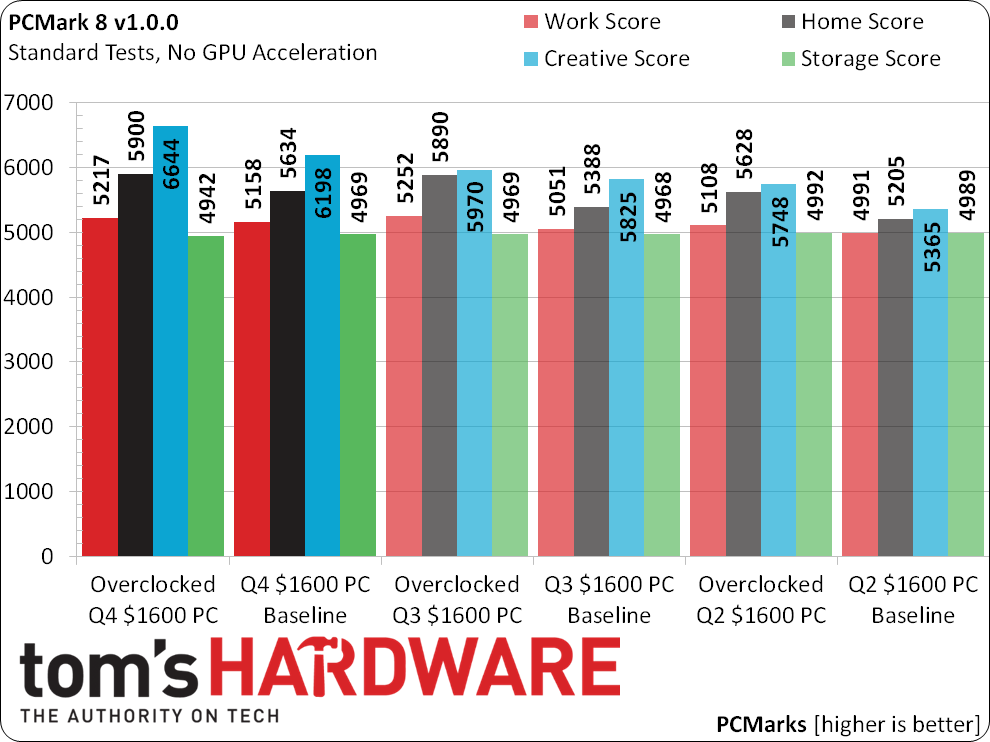
Similar inconsistencies in PCMark’s Home and Creative scores aren’t a big deal, since I really don’t use those scores. Based on the transfer patterns of real-world programs, storage is the only PCMark score that carries any weight in our overall evaluation. The new system loses that one by 1%.
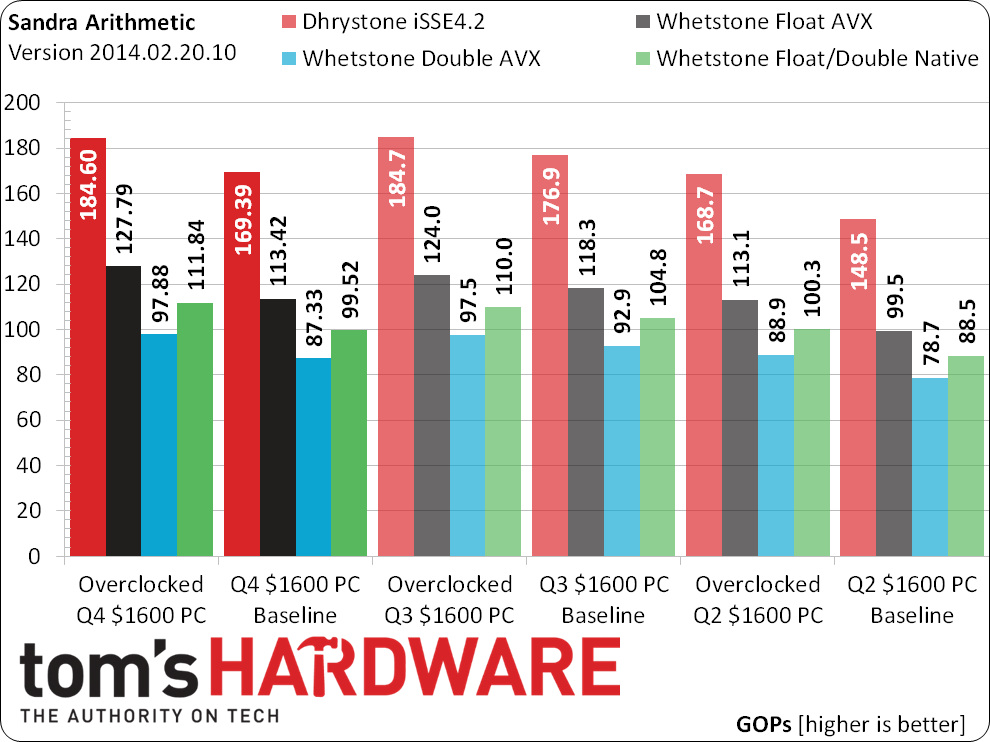
The new build also trails the Q3 machine in Sandra Arithmetic. This is starting to sting a little, but I still hold hopes that it won’t suffer any losses in our real-world applications.
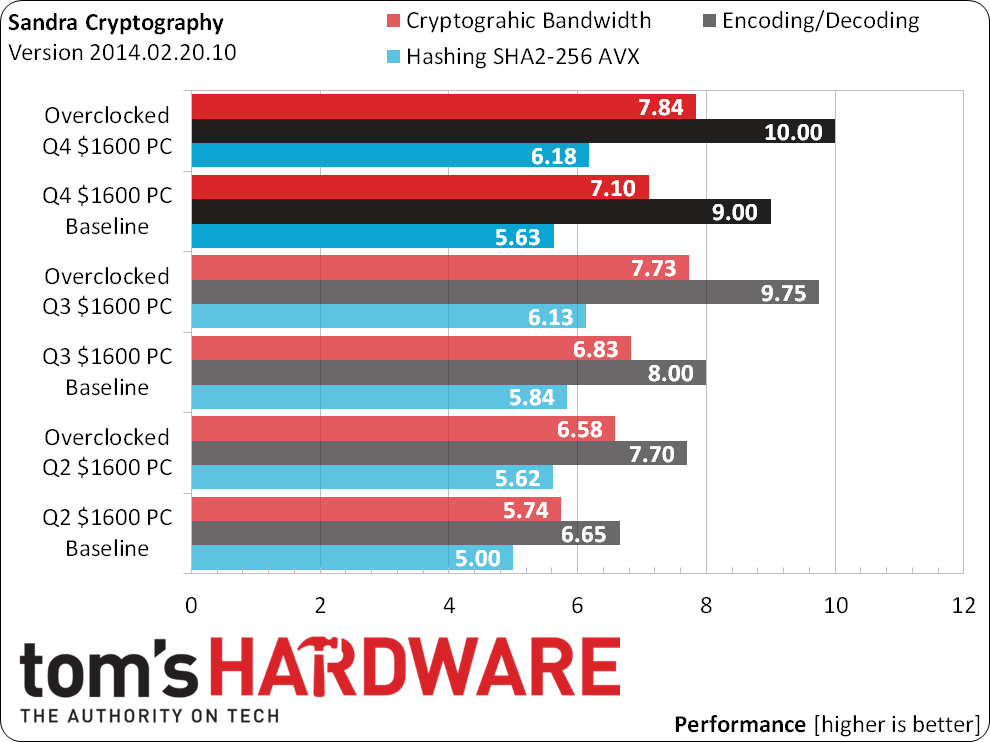
Sandra Cryptography shows mixed benefits for the Q3 machine’s higher baseline DRAM data rate.
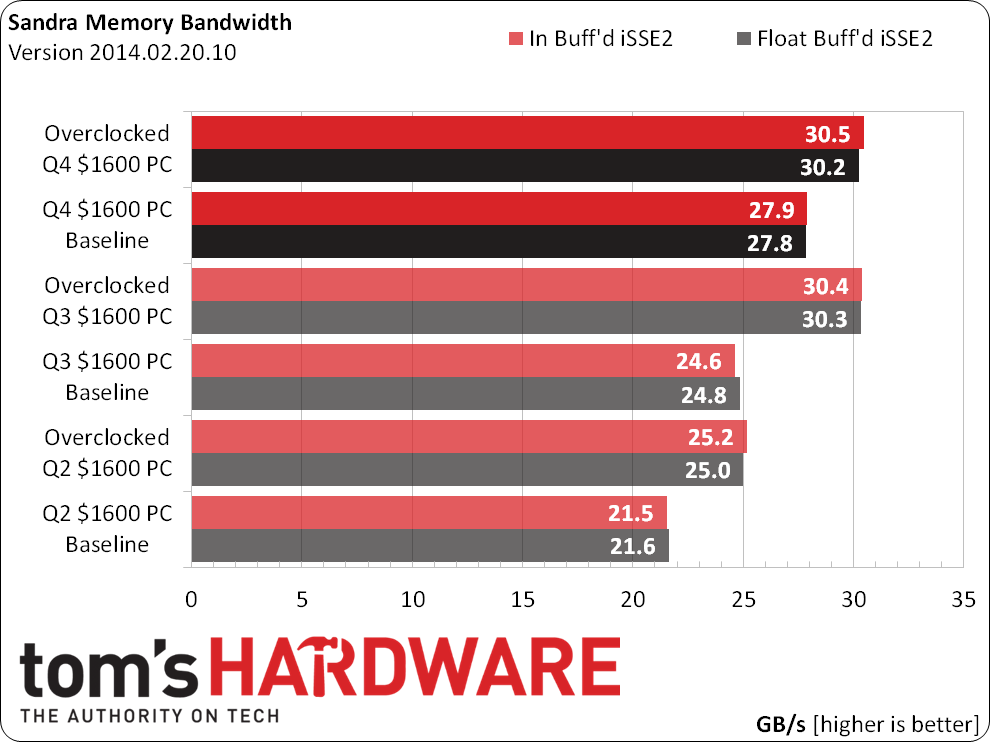
The higher baseline memory bandwidth is far more apparent in Sandra’s memory bandwidth test. Both sets of RAM reach the same overclock, so both get the same average overclocked bandwidth.
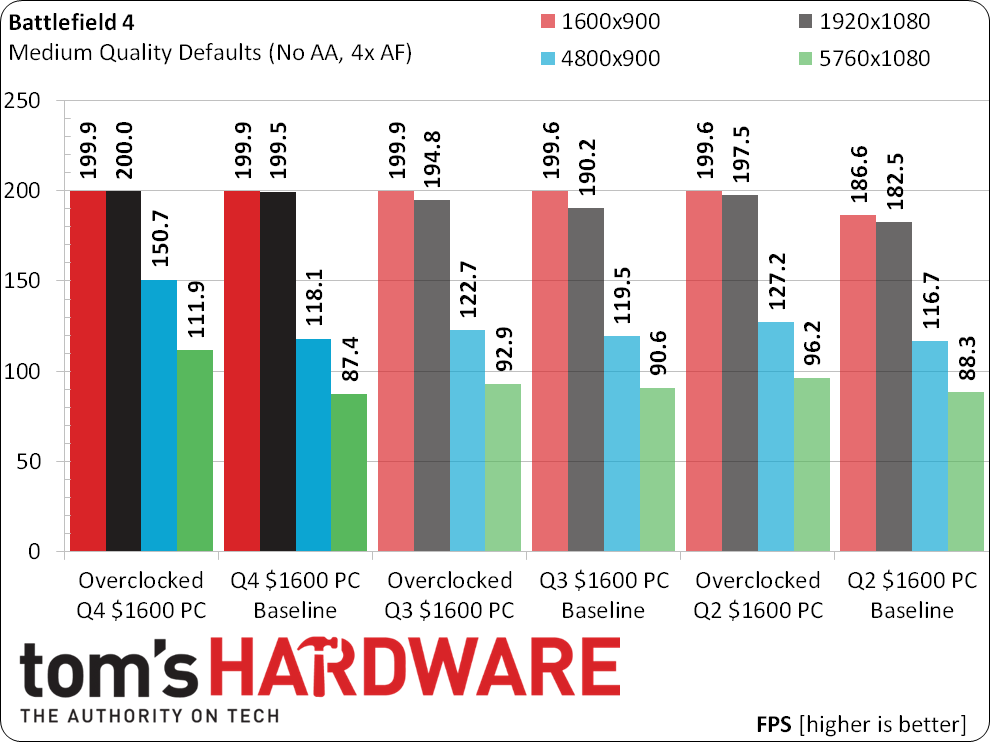
Battlefield 4 shows surprisingly little differentiation between the Q3 and Q4 systems at medium details and high resolution. Lower resolutions reach the game’s 200 FPS cap.
Get Tom's Hardware's best news and in-depth reviews, straight to your inbox.
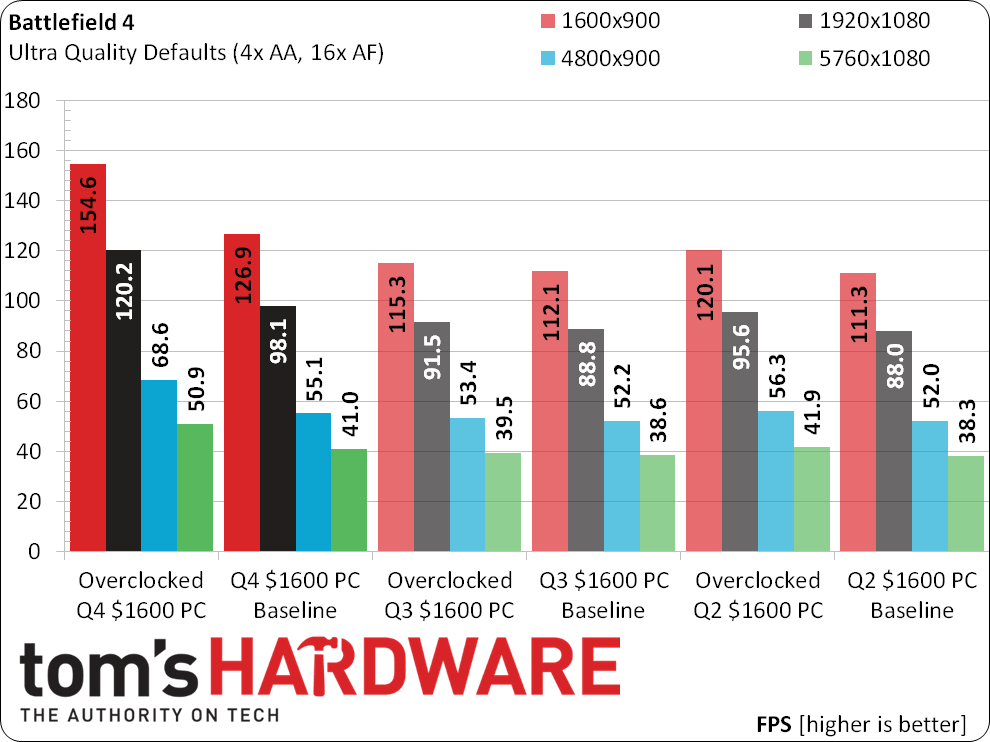
The GeForce GTX 980 shines at Battlefield 4 Ultra settings, though its biggest gains are found at medium resolution. Perhaps it could have taken a bigger lead at medium details too, if not for the game’s 200 FPS cap.
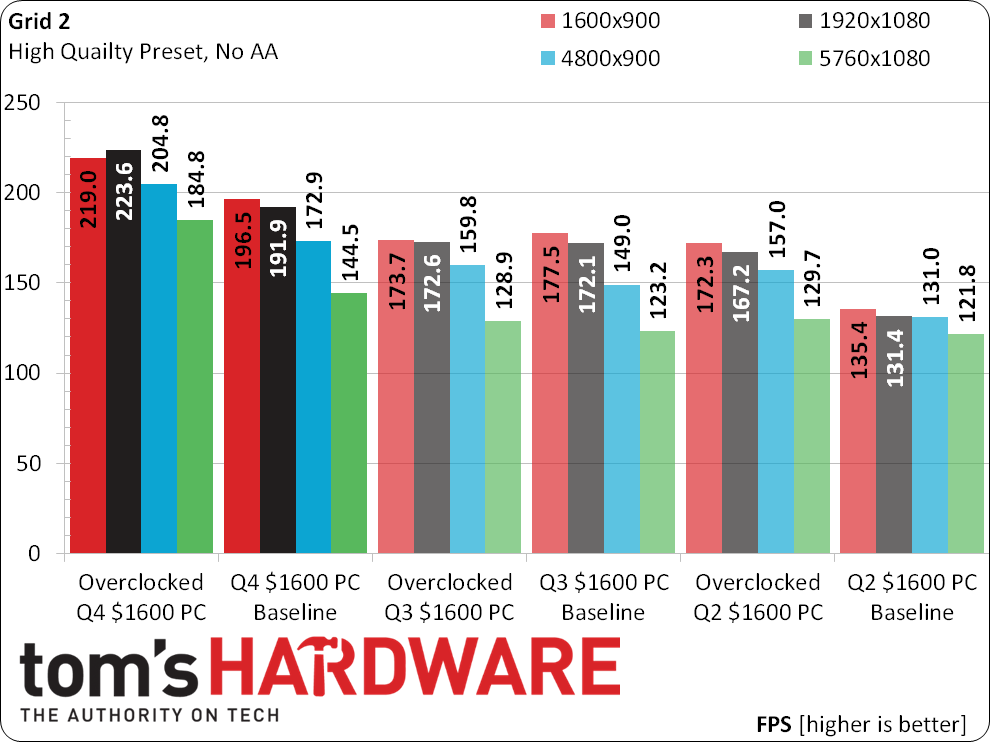
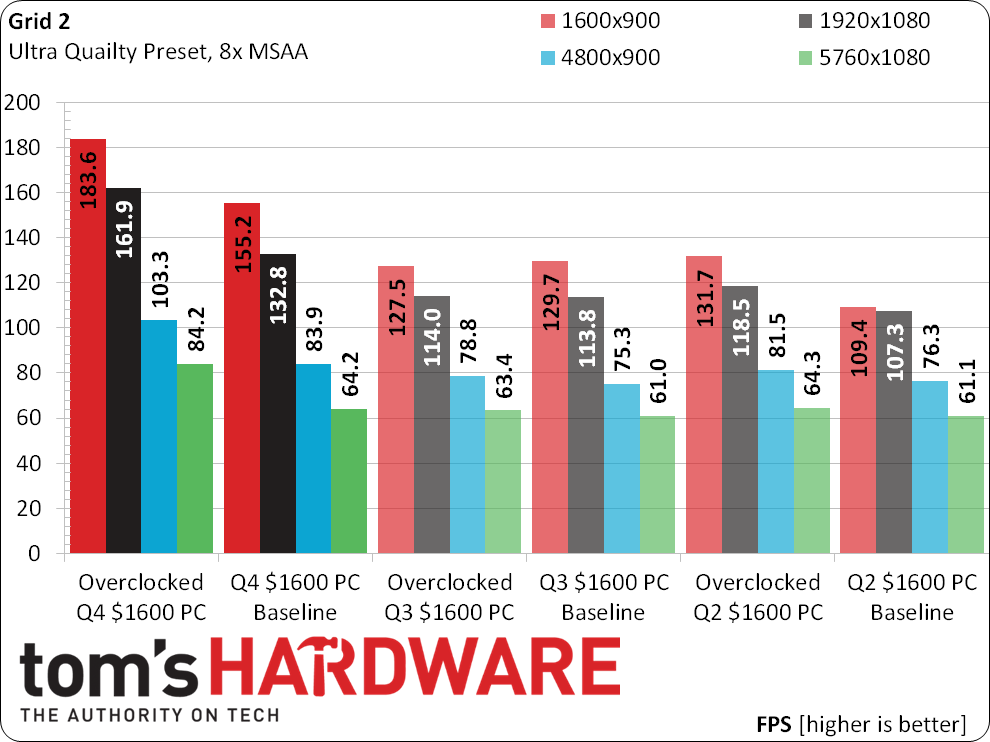
Well known for its CPU and DRAM bottlenecks at medium resolution and “High” details, Grid 2 still shows some type of benefit from the Q4 build’s GeForce GTX 980. The most likely reason for these results is that AMD graphics have more CPU overhead, and this is something I’ve proven in previous-generation tests.
Relatively large gains for the Q4 machine’s GTX 980 diminish at higher Grid 2 resolutions, where the performance benefit would have been most-useful. Aggressive overclocking helps though.
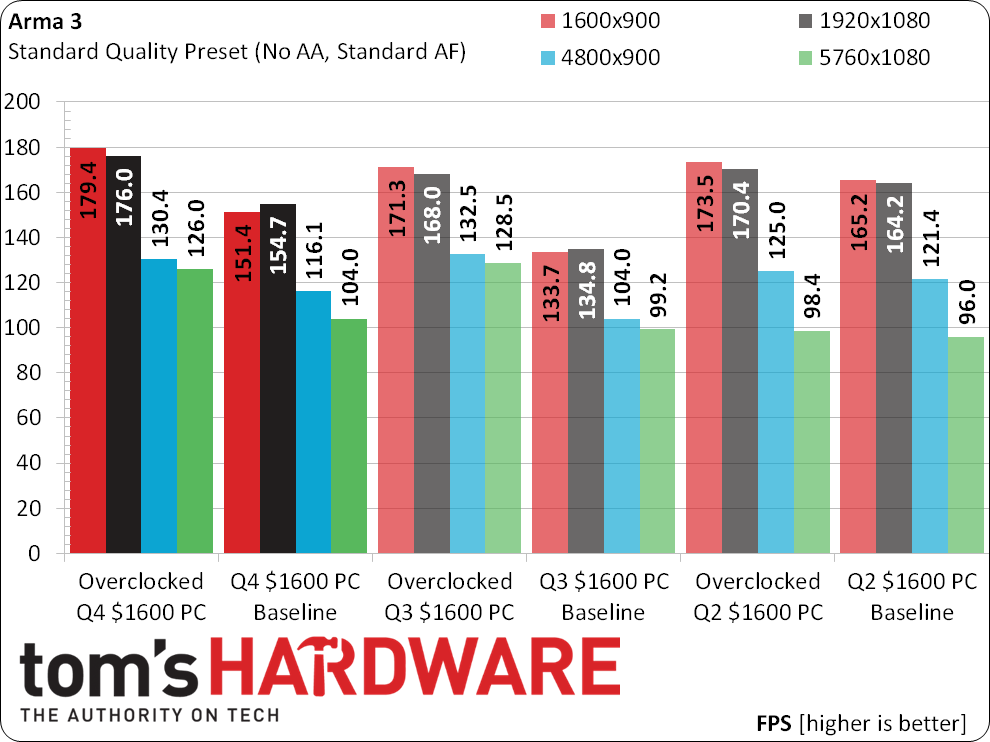
Arma 3 puts the squeeze on the new system at standard settings, where it appears to scale in proportion to CPU and DRAM clocks. Slightly larger gains at lower resolutions may point to the Q4 card’s lower CPU overhead.
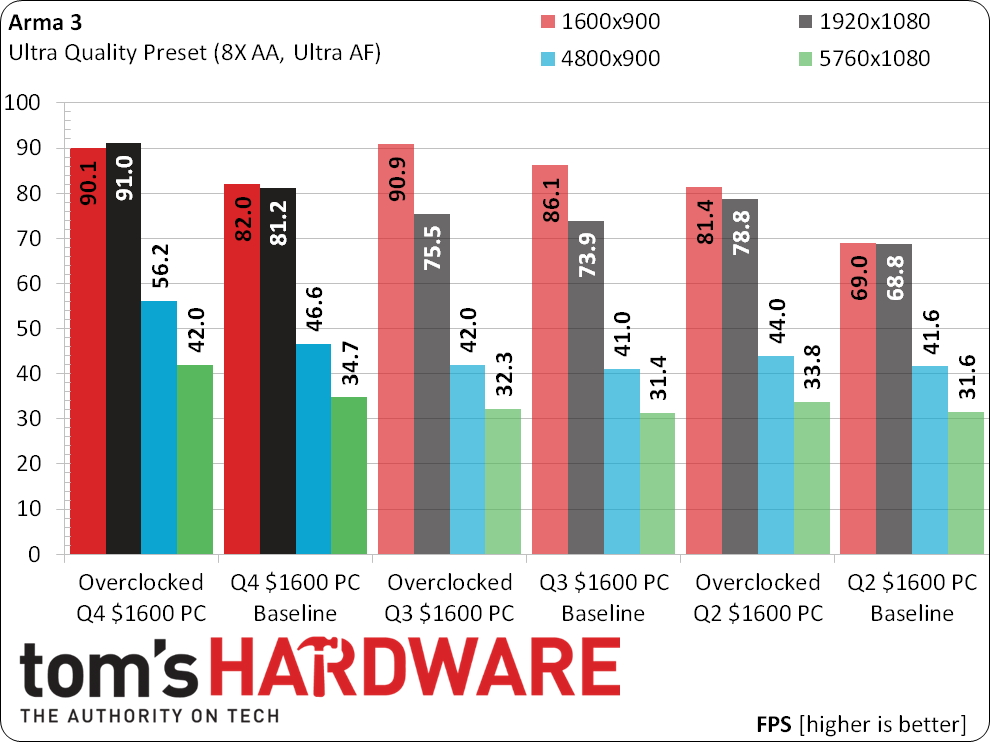
Aside from the weird results at 1600x900, Arma 3 numbers finally break out in the Q4 machine’s favor at the game’s Ultra quality preset.
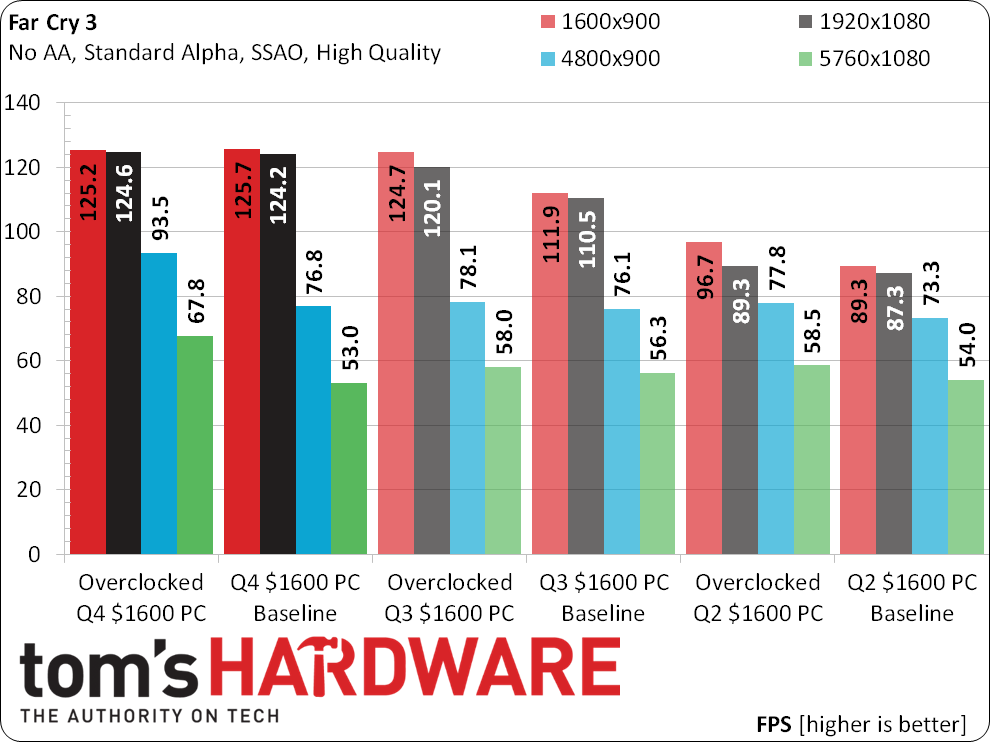
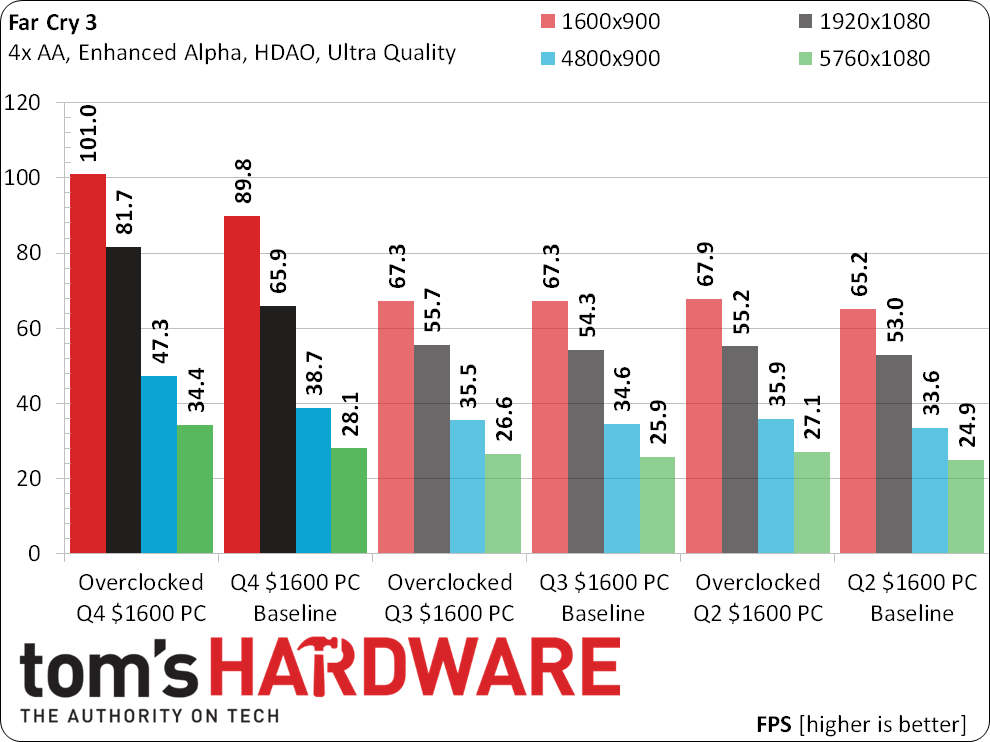
Far Cry 3 appears to have a 125 FPS cap, but I bet The Donald (Woligroski, SBM builder) has a workaround. GPU overclocking is the new machine’s claim to glory at the game’s “High Quality” settings.
The Q4 machine’s lead expands at Far Cry 3 Ultra Quality, but not as much as we’d like at 5760x1080. With a 23 FPS reported minimum at stock settings and a few long frame times scattered throughout, overclocking is needed to eliminate choppiness.
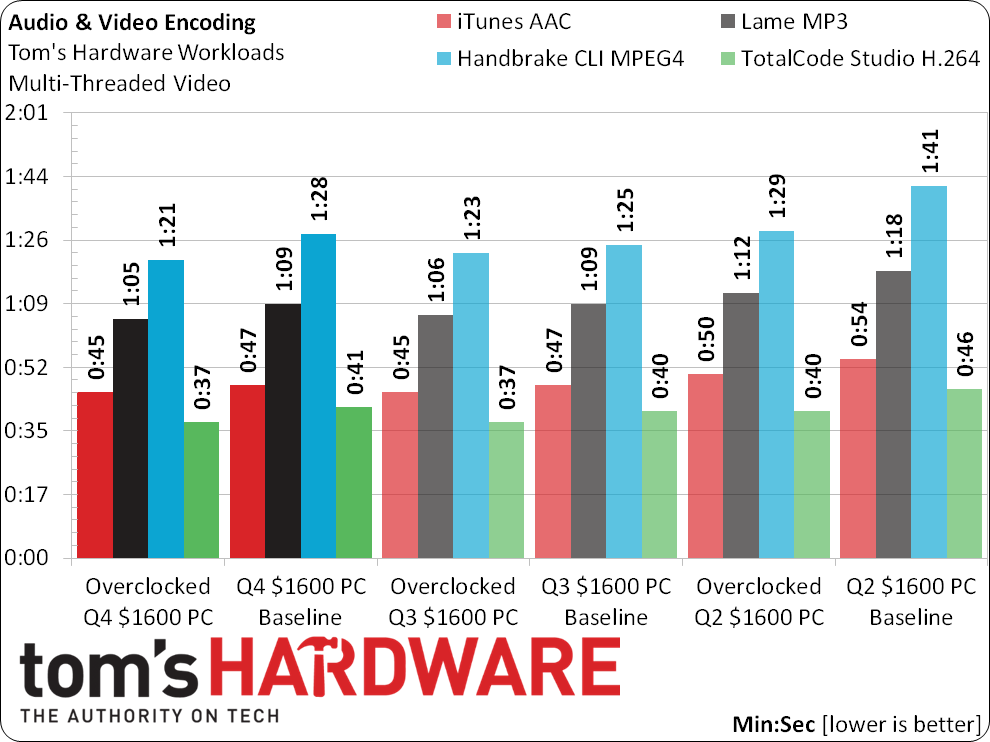
The Q4 machine’s stock settings appear slightly slower than Q3’s in multi-threaded loads, so I checked to see why. It turns out that while the previous system supported “enhanced” turbo modes by default (4.40 GHz with all cores loaded), the new machine follows Intel’s official (non-enhanced) Turbo specifications. Both machines use the same multiplier when overclocked, allowing the new system’s faster RAM and slight BCLK O/C (0.5% by default) to push a slight lead.
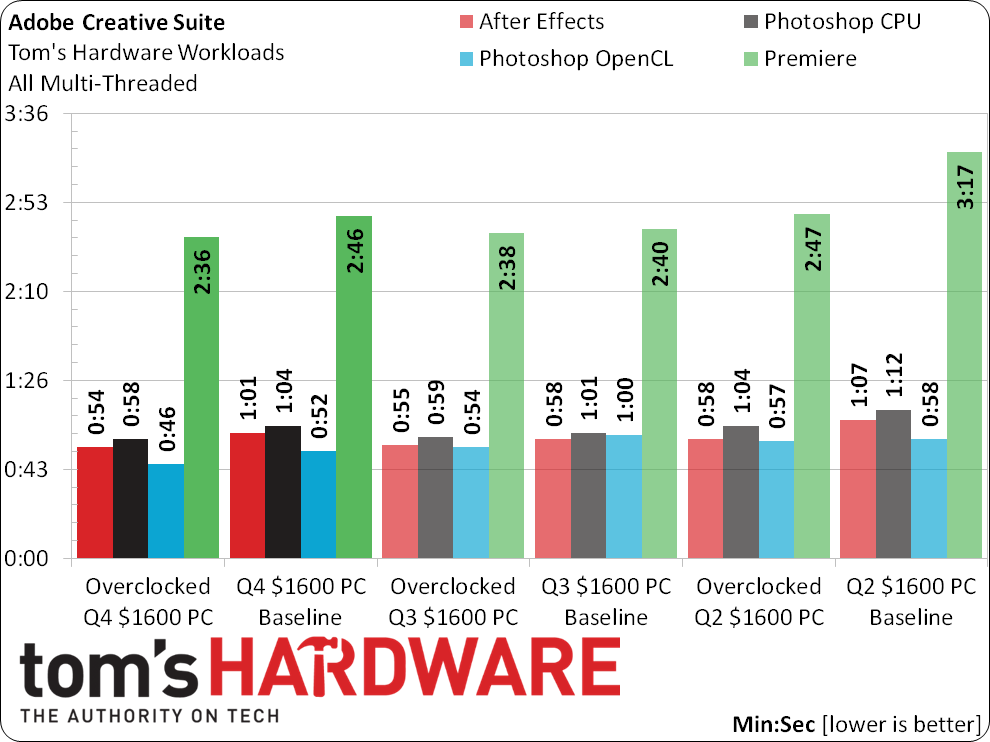
OpenCL shines on the Q4 PC’s GTX 980.
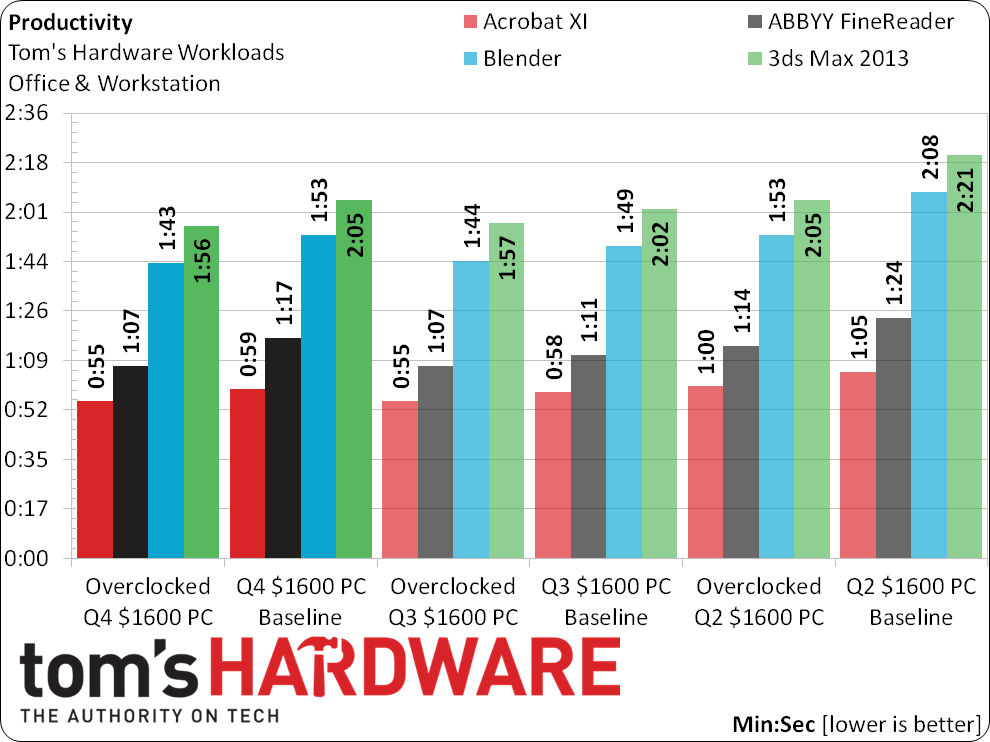
The benefits of “enhanced” turbo again appear for the Q3 default configuration throughout our productivity suite. Fortunately, the new build gets a couple miniscule wins when comparing both overclocks.
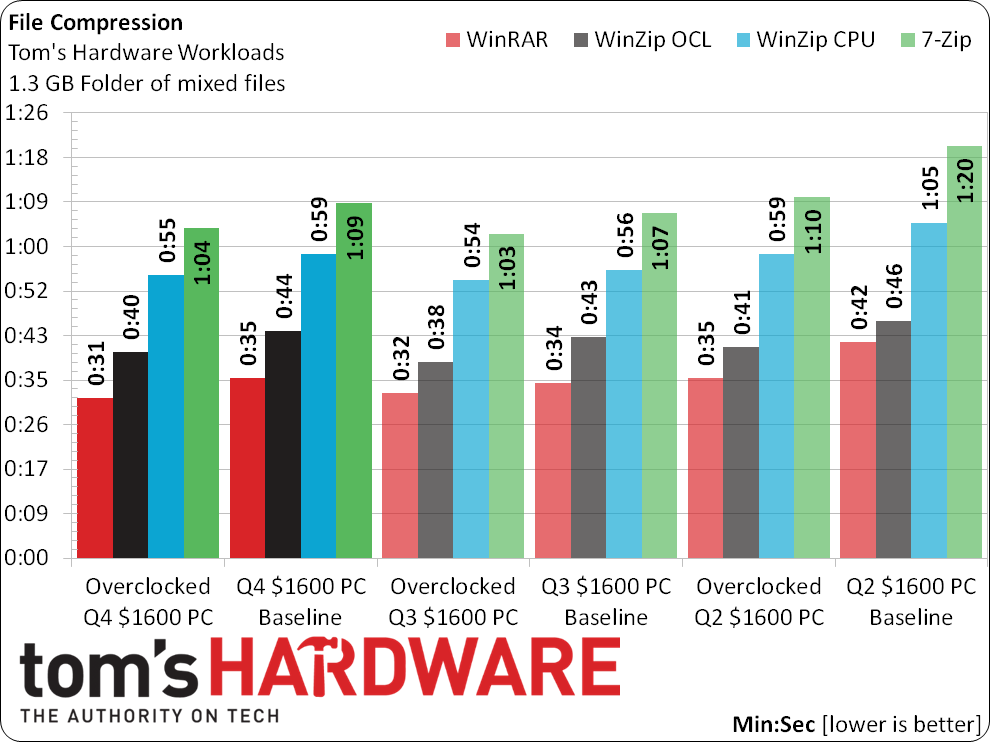
The Q4 system falls behind the Q3 build in three out of four file compression tests, and the differences are tougher to define. I’m fortunate that those losses are small.
Current page: Benchmark Results
Prev Page How We Tested Our $1600 Performance PC Next Page Power, Heat, Efficiency And Value-
cmi86 With $60 for a case you could have done so much better than that atrocious smurf turd. If you want me to spend $1,600 on a PC it better look the part as much as it plays the part. NZXT source 210, Antec GX-500, Bitfenix Neo-100, Rosewill Redbone, Thermaltake CA1B2/Commander/Versa and the list goes on and on and on... and on.Reply
BTW, These were only $50 cases netting you $10 on your budget. -
Onus Never mind the atrocious color, how was the case otherwise? Sturdy? Any sharp edges? Front panel cable lengths? Cable management space?Reply
You addressed my thoughts on the oversized PSU; if 650W of similar quality were not cheaper, I might have done the same thing.
I can't help but wonder how SLI of two lesser cards would have performed. Won't two GTX760s beat a GTX980? -
elbert I would have tried to wiggle around 2x 970's for about $660ish. Saved money on the heatsink with a CM 212 evo and a bit cheaper ssd.Reply -
Onus It might have been hard to squeeze out that $60 without raising eyebrows, but perhaps that might have been done. Use the same cooler Don used though;'no reason to waste money on the Hyper EVO. It is almost certainly a better cooler, but not worth the price difference compared to Don's or one of the other 120mm competitors (including the older Hyper212+).Reply -
UltimateDeep Disappointing, your could cut cost a bit more on the cooler or the case and go for a 128GB SSD and go for GTX 970s in SLI. You could get a LOT more with 970s in SLI.Reply -
jasonelmore Honestly, the whole reason to get a 4790K is because it runs 4.4Ghz Stock. With no overclock. 99% of motherboards will automatically overclock all 4 cores to 4.4ghz using Multi-core enhancement setting.Reply
Why void your warranty for 200mhz OC? not needed for such small gains. 4.4 is fast enough even for 4k gaming -
Vorador2 Spending almost 1000$ on the graphics card and CPU and pairing them up with just freaking 8 Gb of RAM is an insult. I know is the price to fit both on a 1600$ budget, but still...it feels completely unbalanced.Reply -
Crashman Reply
It's a fairly mid-grade case with rolled edges and so forth, and reasonable room for cables. Thermaltake's window is a little hard and thin, which is mostly a shipping issue, and I was a little disappointed that it was too narrow to hold this RAM/Cooler combo in its intended orientation. It would make a very NICE $60 to $70 case, but there are many better options at $80+ (its original price).14919563 said:Never mind the atrocious color, how was the case otherwise? Sturdy? Any sharp edges? Front panel cable lengths? Cable management space?
But it wouldn't have been $60. Remember, I ordered a $560 card and ended up with a $600 card. So going back to the planning stage, 2x 970's would have been $100 more.14920018 said:
It might have been hard to squeeze out that $60 without raising eyebrows14919897 said:I would have tried to wiggle around 2x 970's for about $660ish. Saved money on the heatsink with a CM 212 evo and a bit cheaper ssd.
Intel isn't tracking whether-or-not you overclock...but the reason to pick a 4790k over a 4770k is that, in my experience, Intel is tossing a lot of heat-problem cores into the 4770K parts bin.14920879 said:Honestly, the whole reason to get a 4790K is because it runs 4.4Ghz Stock. With no overclock. 99% of motherboards will automatically overclock all 4 cores to 4.4ghz using Multi-core enhancement setting. Why void your warranty for 200mhz OC? not needed for such small gains. 4.4 is fast enough even for 4k gaming

