Intel 750 Series 400GB Versus Samsung SM951 512GB
We're pitting Intel's 400GB SSD 750 against Samsung's 512GB SM951 because they're the fastest PCIe-based drives in their respective categories today.
Why you can trust Tom's Hardware
PCMark 8 Advanced Workload
To learn how we test advanced workload performance, please click here.
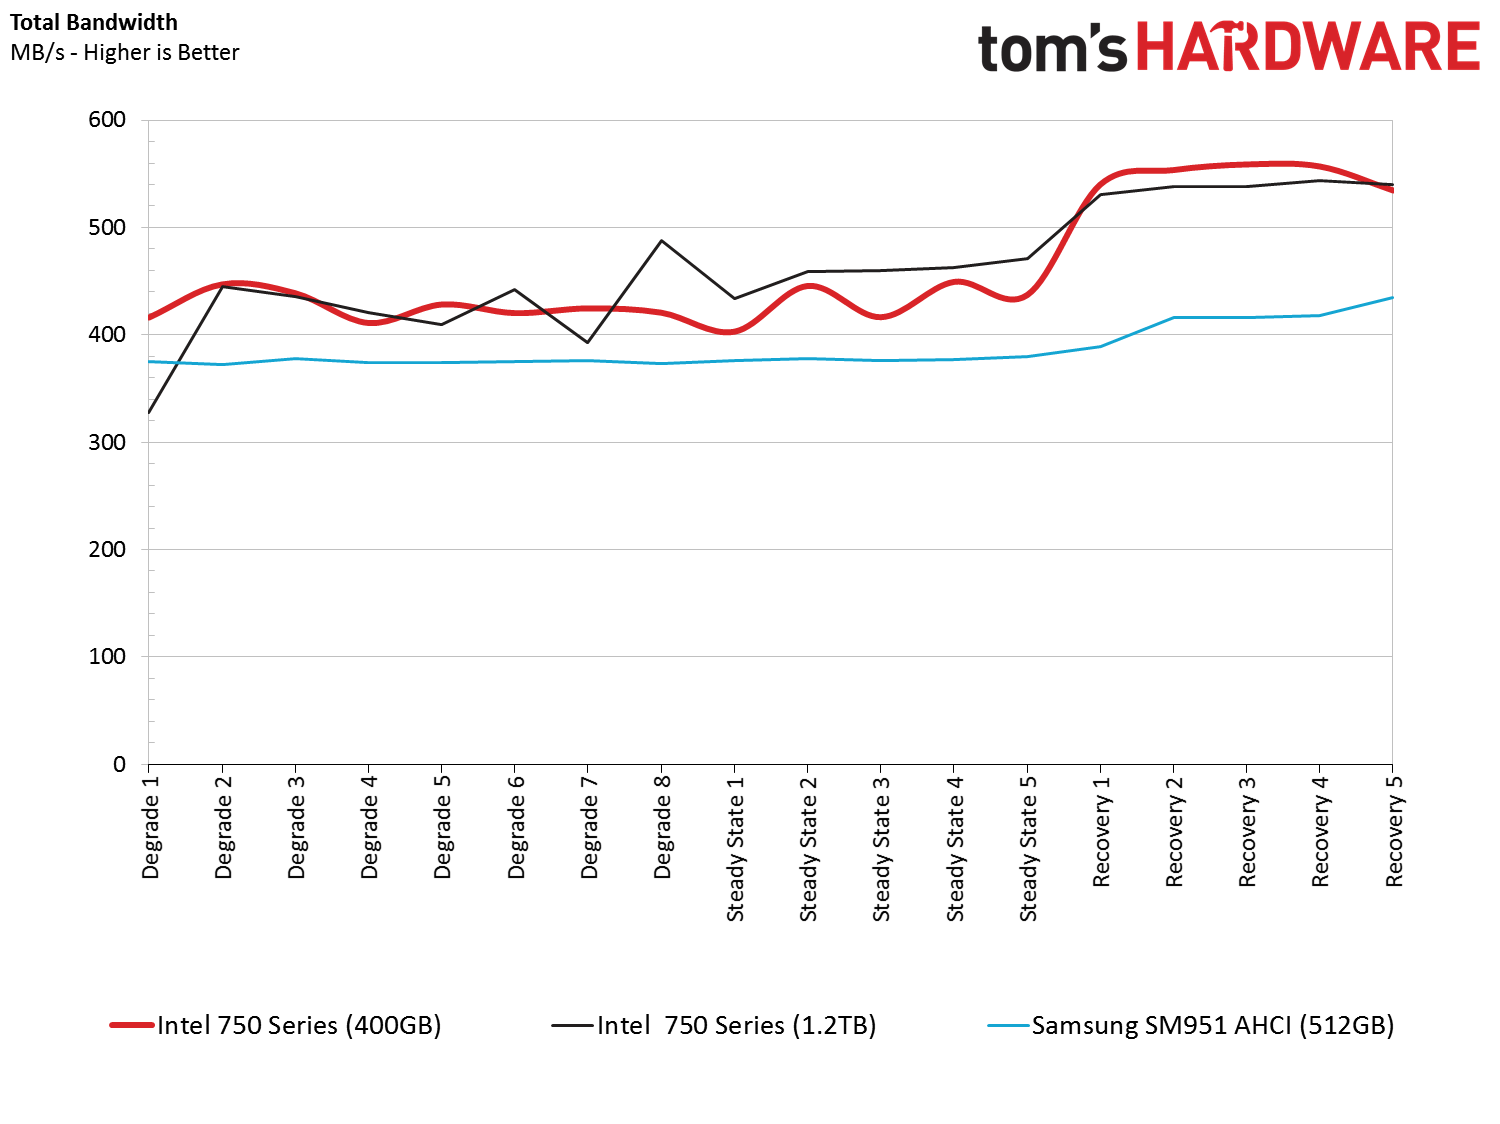
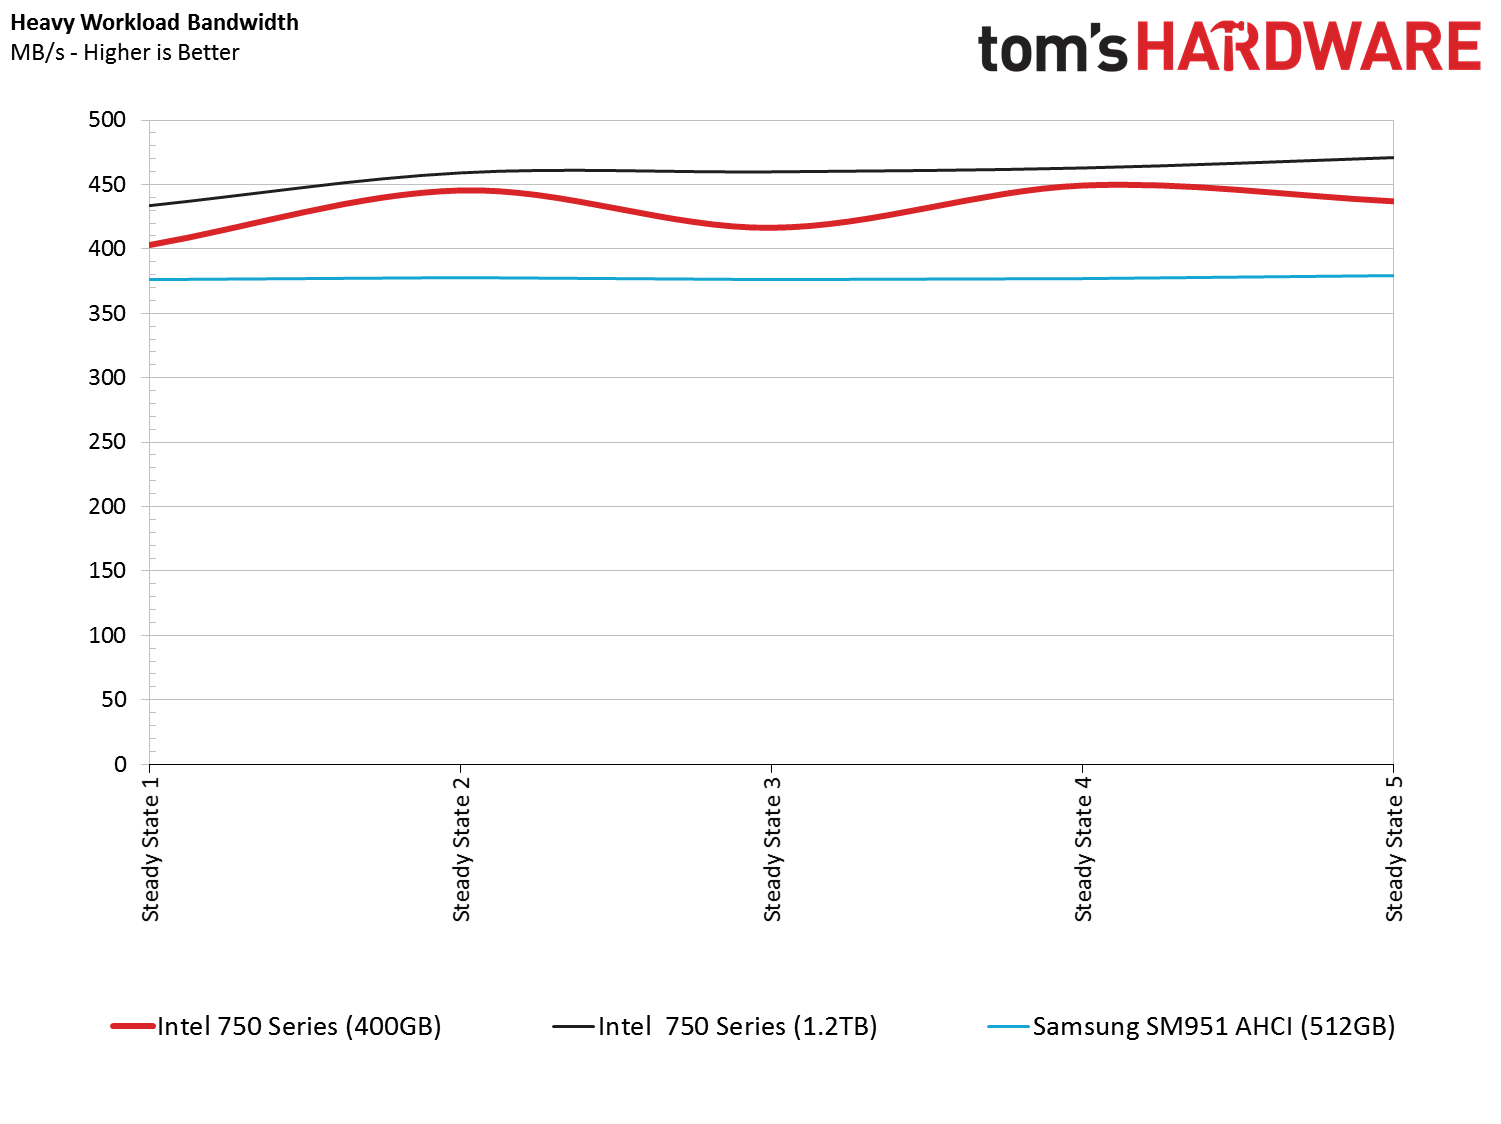
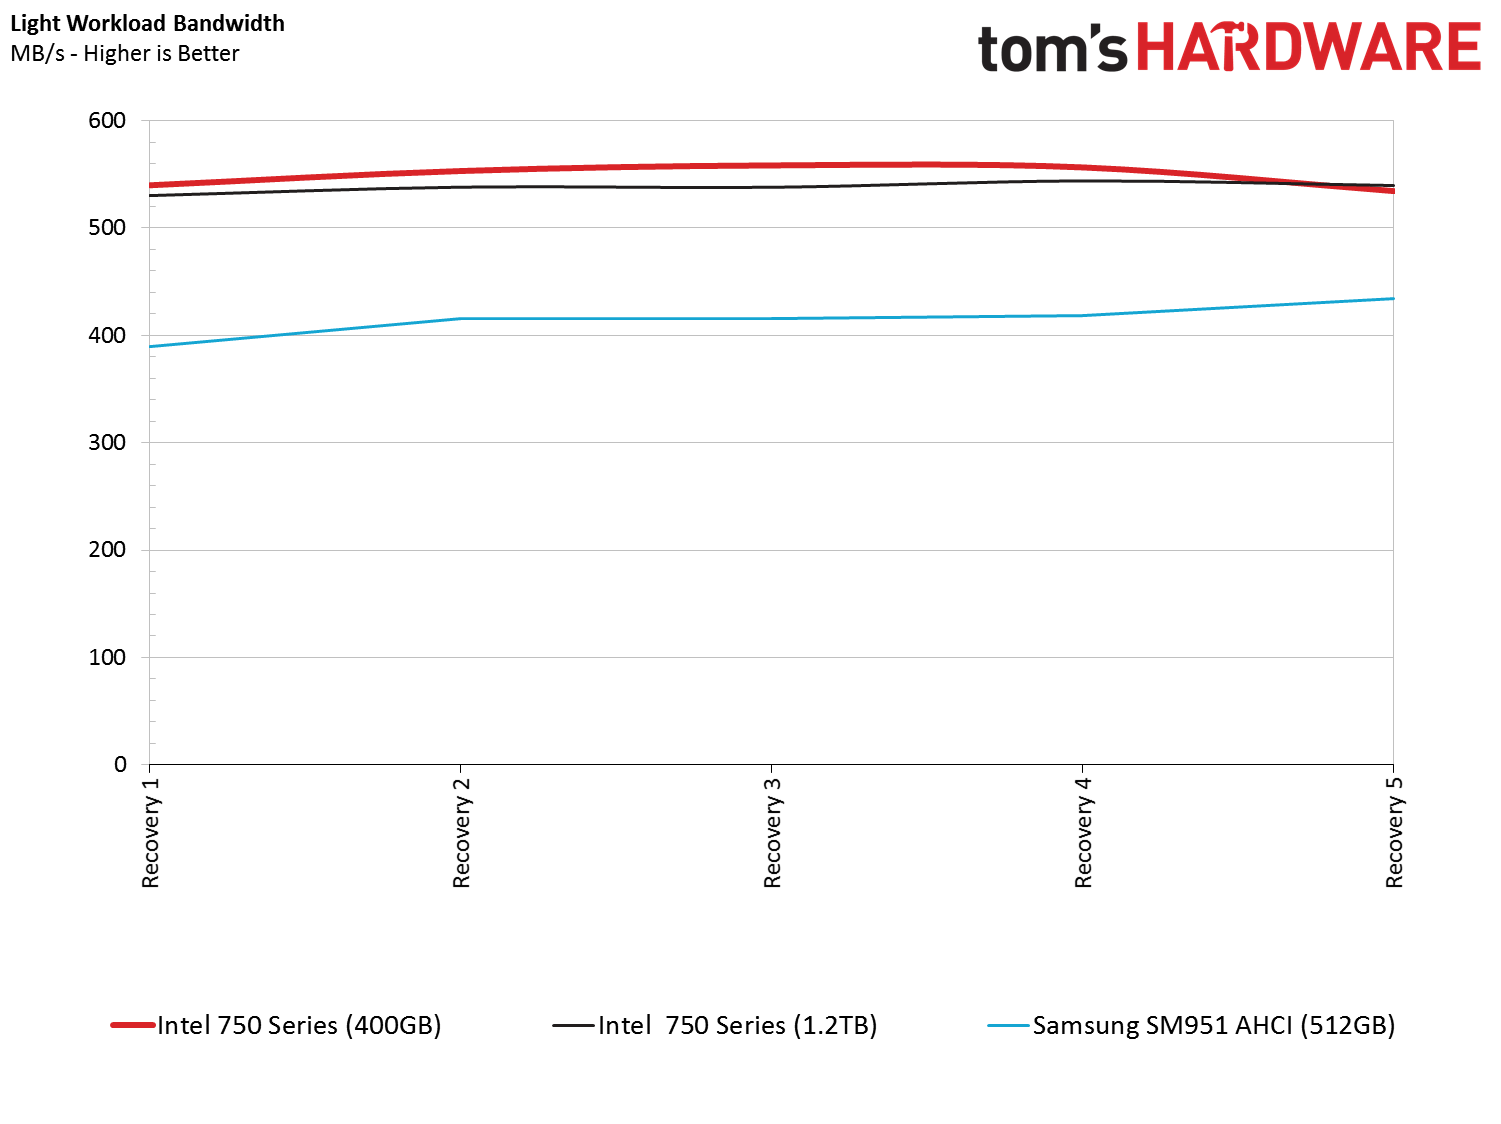
Without other drives in the chart messing with the y-axis, we get a clear picture of the performance available under different conditions. In the previous set of tests, Samsung's SM951 was slightly faster than Intel's SSD 750s. This set uses the same data; however, with controlled preconditioning, the Intel drives are faster. This is a better representation of performance in a system under heavy to moderate usage. We like to think that these metrics mimic long-term use, after all of the cells have been filled and the drive is forced to clean up dirty pages in the NAND. If a term exists for this condition, it would be client steady state.
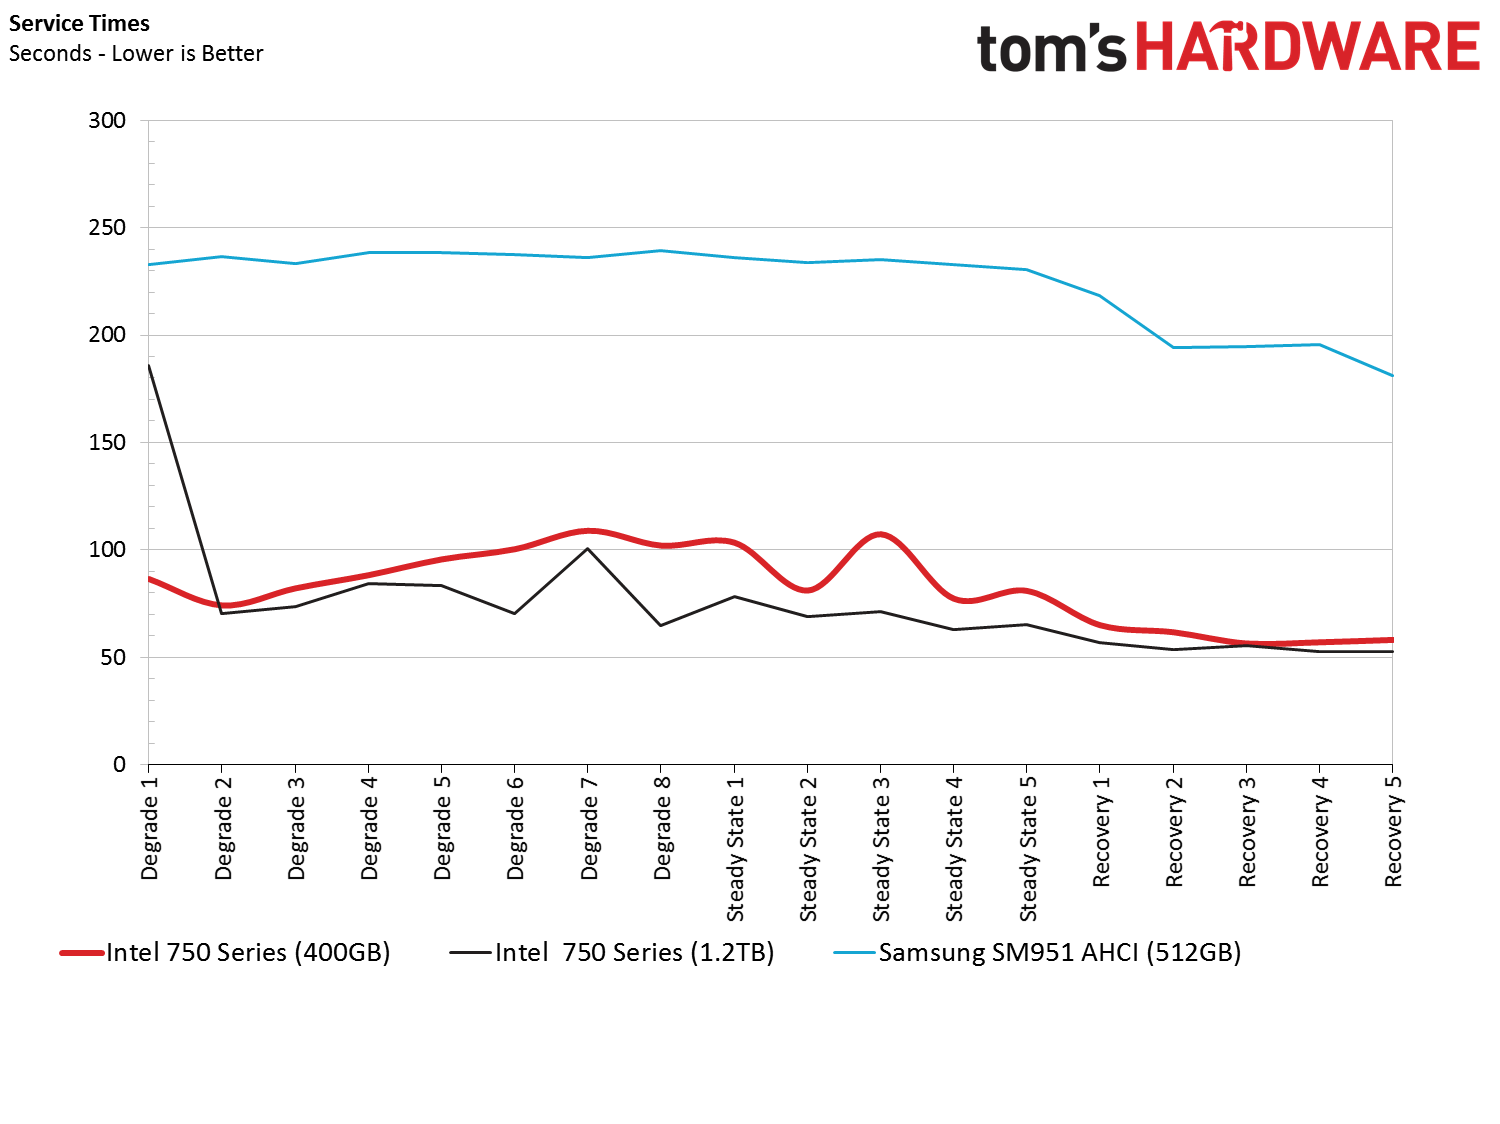
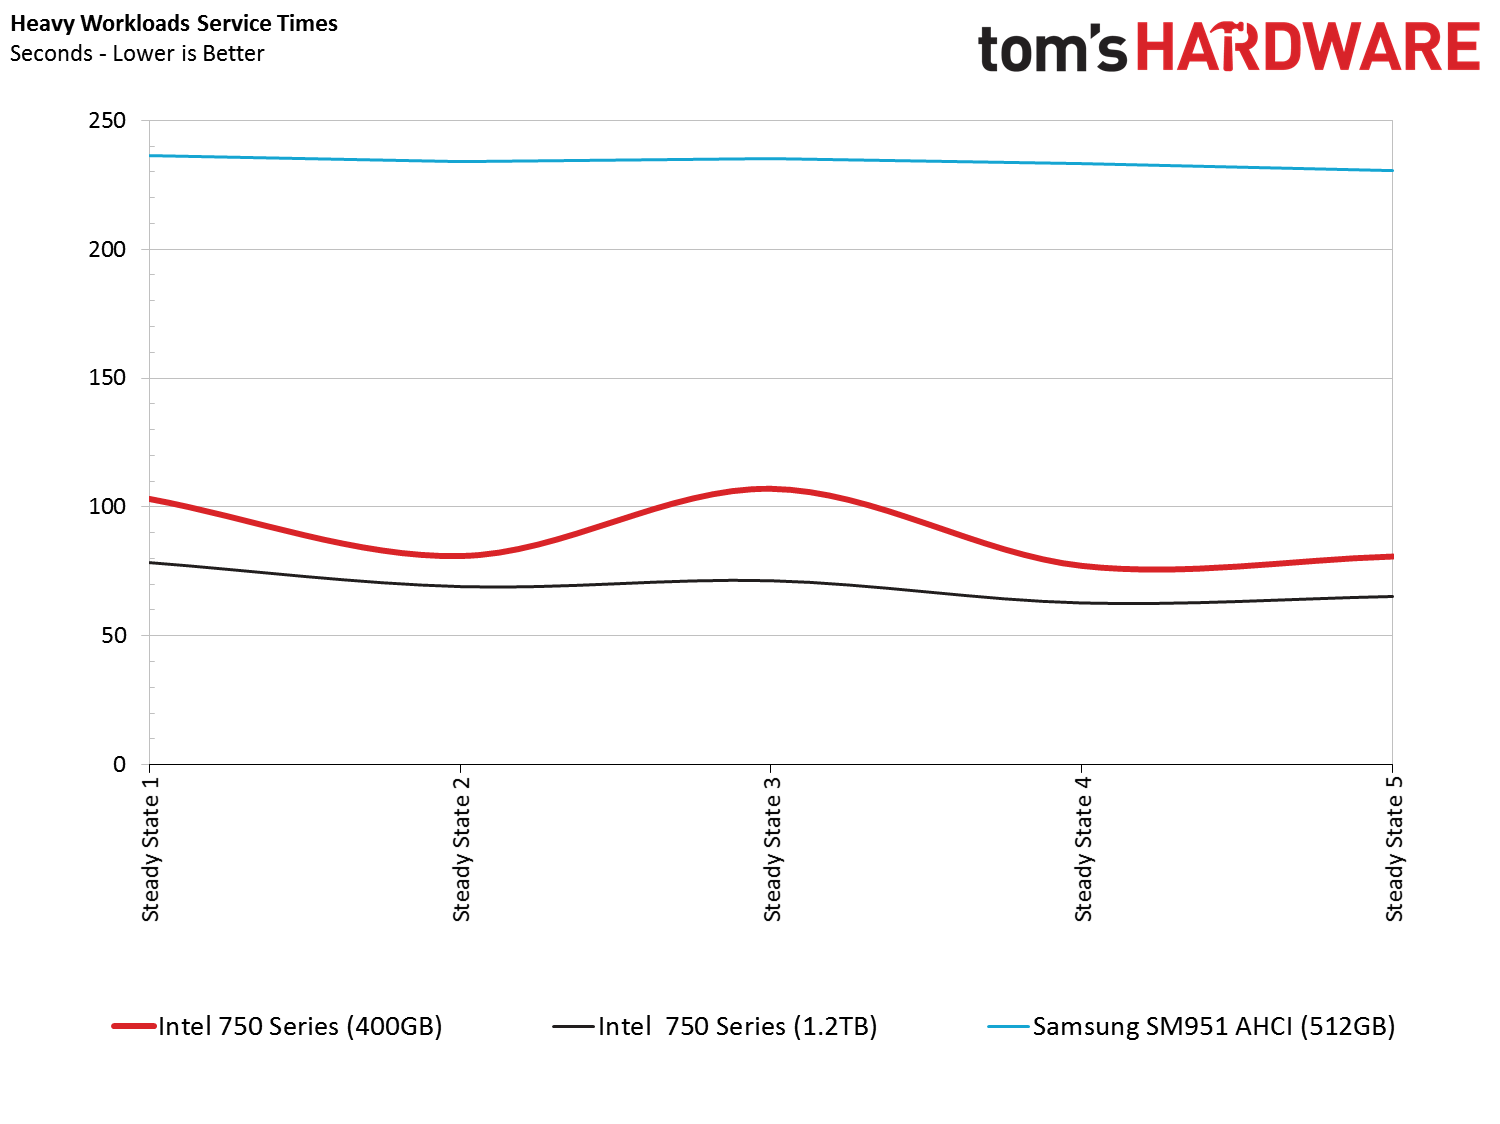
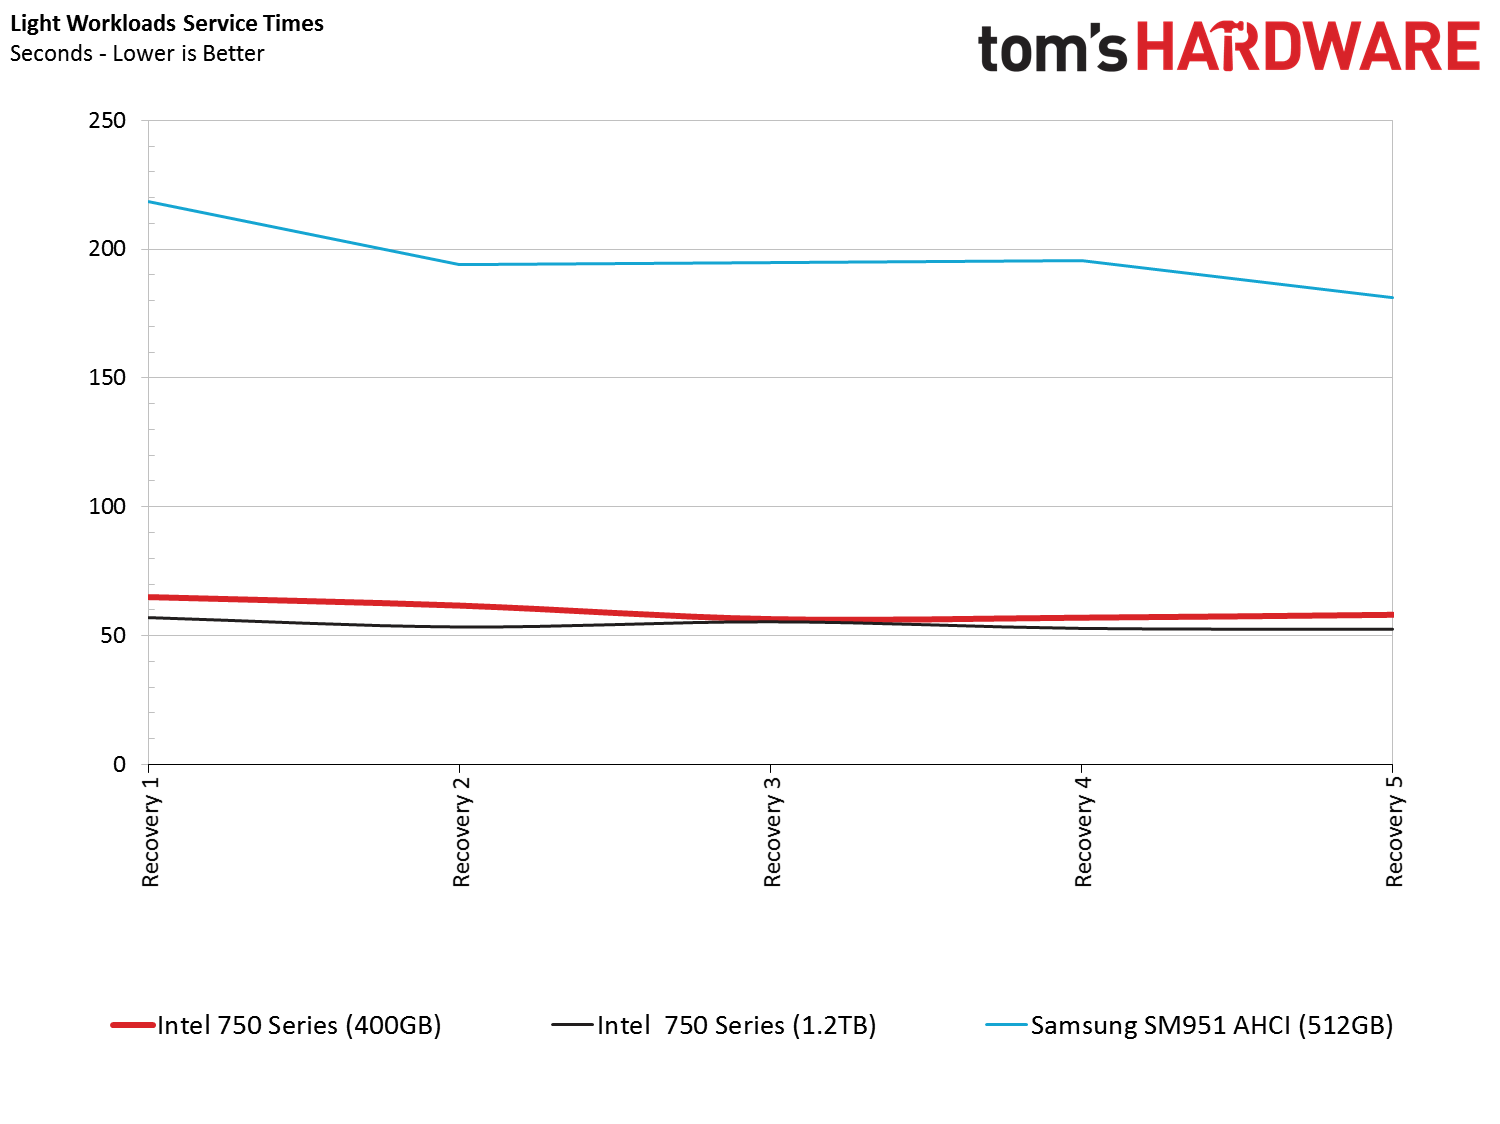
If you really want to know which drive delivers the best experience, the service times in client steady state are the most important results to look at. The light workload service time chart best represents what most readers do with their PCs, and we often point to Recovery 4 as a determinant of which product is best.
Based on performance alone, the SSD 750s are better in daily use, particularly as they age and their memory cells are left dirty. But the judgement isn't cut-and-dried as that. Samsung's AHCI-attached SM951, like many Samsung SSDs before it, needs more time to clean up dirty cells through garbage collection and wear-leveling. The test we're running is controlled, so we can't manually extend the idle time past five minutes. If we could stretch it to 10 minutes or more, we suspect that the results would be much closer.
Get Tom's Hardware's best news and in-depth reviews, straight to your inbox.
Current page: PCMark 8 Advanced Workload
Prev Page PCMark 8 Real-World Software Next Page Final Thoughts
Chris Ramseyer was a senior contributing editor for Tom's Hardware. He tested and reviewed consumer storage.
-
BoredErica Hey, I would love to see a new article about trace-based analysis of hard drive load. I've got some money to splurge on storage I don't strictly NEED, but actually I have no idea what to buy. Just a thought. :)Reply -
Arabian Knight agaiiiinReply
How about testing the Intel 750 card in Raid 0 ?
please add another Card and try software raid . -
PaulBags RE: Sequential Steady State, what is the percent scale in that graph? I assume one end is writes and one read, but which? Graph needs to be properly labeled.Reply -
PaulBags Sequential steady state vs random steady state, switching between IOPs and MB/s, yay that's comparible. Bah, I'm done with this article. Bppppppt.Reply -
Blueberries I'd take a 750 over the SM951 any day, you just can't beat the latency and random read/write performance. The SM951 is probably hands down the best SSD right now for the typical PC user, all things considered; having neck-and-neck or better performance at low queue depths and of course a much faster boot time.Reply
Get the 750 if you're an enthusiast and you can afford it. Otherwise the SM951 is going to be the best performance you've experienced in your life. -
Osiricat Hi! Anything about temps? I read in earliers reviews that SM951 warms up to 70-75ºC, for some reason intel added passive cooling over theirs memory chips!Reply -
CRamseyer The industry standard is to measure random performance in IOPS and sequential performance in throughput. Why would you want to compare sequential IOPS to random IOPS or sequential throughput to random throughput?Reply
The sequential steady state shows read percentage. 100% read to 0% read. It's mainly an enterprise test I imported a few years ago in my testing to see the bathtub curve of the devices under test.
As for RAID with these drives. I'm not sure if a RAID Report is really needed. You can't boot from devices in Windows software RAID. If 5% of the market cares about these premium parts to start with then RAID performance has to amount to 5 to 10% of those readers. I don't think there are enough readers to justify the time and expense for that level of testing. If Intel wants to provide the parts I don't mind testing and writing the article.
Chris -
PaulBags Reply
So that I can see the difference? How much of a performance drop is there with random vs sequential? Yes I don't get to decide how my data travels, but is random throughput significantly above the sata 6gb ceiling or does interface not _really_ matter yet unless you have a lot of sequential reads/writes to do? Additionally, what kind of performance is there when there is mixed sequential and random; somewhere in between the two or would comparing the two be completely irrelevant?15929620 said:The industry standard is to measure random performance in IOPS and sequential performance in throughput. Why would you want to compare sequential IOPS to random IOPS or sequential throughput to random throughput?
...
Chris -
CRamseyer Random performance is never higher than the limits of SATA 6Gbps unless you have a product like the Memblaze or P320H that can deliver full PCIe bandwidth random 4K reads and writes. Those are both enterprise products that cost more than a used Honda.Reply
Measuring 4K data in throughput is like telling someone the length of a dollar bill in miles.