Zombie Loading: Intel Patches Slow Down SSDs as AMD Gains Ground
From Spectre / Meltdown last year to Zombieload and Fallout most recently, Intel CPUs have had more than their fair share of security vulnerabilities. Unfortunately, fixing these security holes comes at a cost as, with each patch, Intel and its partners shut down an avenue of attack by eliminating processes that had allowed for faster performance.
Unfortunately, as our tests show below, the mitigations have had a huge impact on storage speeds on systems with Intel processors, affecting the times it takes your SSD to do everything from loading games to copying files. In test after test, we saw Intel's storage performance dive several percentage points after last year's Spectre / Meltdown patches and then lose a few points more with the new Zombieload fixes. Where AMD, which hasn't suffered from all of these vulnerabilities, trailed Intel in storage performance before patches, it has now caught up or even moved ahead on many workloads.
To find out just how much the patches affect storage performance and how team blue stacks up to team red in storage performance, we ran some tests with two desktops: one powered by an Intel Core i7-9700K and the other by an AMD Ryzen 7 2700X.
Hardware Configuration
It's noteworthy that the Core i7-9700K we used for testing isn't a Hyper-Threaded processor. Intel advises that customers in riskier environments should disable Hyper-Threading to ensure 100% protection from the latest vulnerabilities, so the performance impact can be higher than outlined here. Intel's 9700K also has in-silicon mitigations that help reduce the impact of some previous vulnerabilities, so be aware that older processors will lose more performance that outlined below. AMD's processors are immune to the MDS vulnerabilities, but do lose a minimal amount of performance from the existing Spectre patches.
| Intel | ASRock Z390 Taichi Ultimate – FW: 4.10 (newest microcode)i7 9700K – 8C/8T - Up to 4.9GHz Boost Freq.Noctua NH-U14SIntel Optane SSD 905P – 1.5TBMSI GT720Kingston HyperX Predator RGB DDR4 - 2x8GB @3000MHz |
| AMD | ASRock Z390 Taichi Ultimate – FW: 3.10 (newest microcode)R7 2700X – 8C/16T - Up to 4.3GHz Boost Freq.Noctua NH-U14SIntel Optane SSD 905P – 1.5TBMSI GT720Kingston HyperX Predator RGB DDR4 - 2x8GB @3000MHz |
Software Configuration
We recently conducted a fresh round of testing with all of the latest Spectre and Meltdown patches for another article, but just days after, Intel announced the latest Microarchitectural Data Sampling (MDS) vulnerabilities, more broadly called Zombieload, RIDL, and Fallout.
We have two sets of data for comparison today. One test configuration consists of Windows 10 64-bit, OS Build 17763.504 with Meltdown and Spectre patches disabled via the InSpectre application on the Intel system, representing a "clean" unpatched system. We also tested with all Meltdown, Spectre, and MDS mitigations enabled with that same Windows build on both systems.
We included our original testing on the Intel system with with Windows OS Build 17763.475 and the Spectre and Meltdown patches enabled, but without the MDS patches. This will allow us to see the impact of the latest round of mitigations compared to the previous patches.
Get Tom's Hardware's best news and in-depth reviews, straight to your inbox.
Game Scene Loading – Final Fantasy XIV
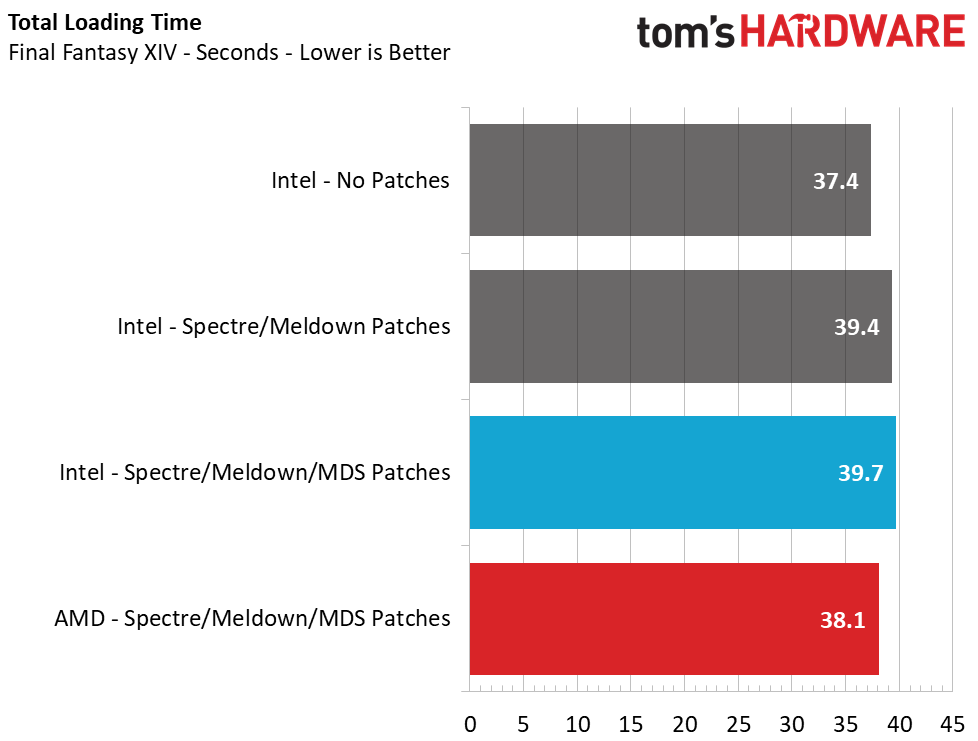
We know that the patches aren't going to make a significant impact on frames per second (FPS) during gaming, but we're concerned about slower game loading times. Game loading is dependent upon the speed of the underlying storage system, hence why SSDs load game levels so quickly, but the reduced storage performance borne of the patches should have some impact.
The Final Fantasy XIV StormBlood benchmark is a free real-world game benchmark that easily and accurately compares game load times without the inaccuracy of using a stopwatch, so it's perfect for this task.
In our game load test, there is a 6.2% reduction in Intel's performance with the Meltdown/Spectre patches enabled, and about a 1% additional loss when we add the MDS patches to the mix. That's bad news for Intel because now the AMD system takes a 4% lead.
Transfer Rates – DiskBench
Flinging around files on your PC is a pretty common task, and the ability to move and create files quickly also gives us a decent idea of performance with other types of workloads, like compressing and decompressing files. We use the DiskBench storage benchmarking tool to test file transfer performance with our own custom 50GB block of data. Our data set includes 31,227 files of various types, like pictures, PDFs, and videos. We copy the files to a new folder and then follow up with a read test of a newly-written 6 GB file.
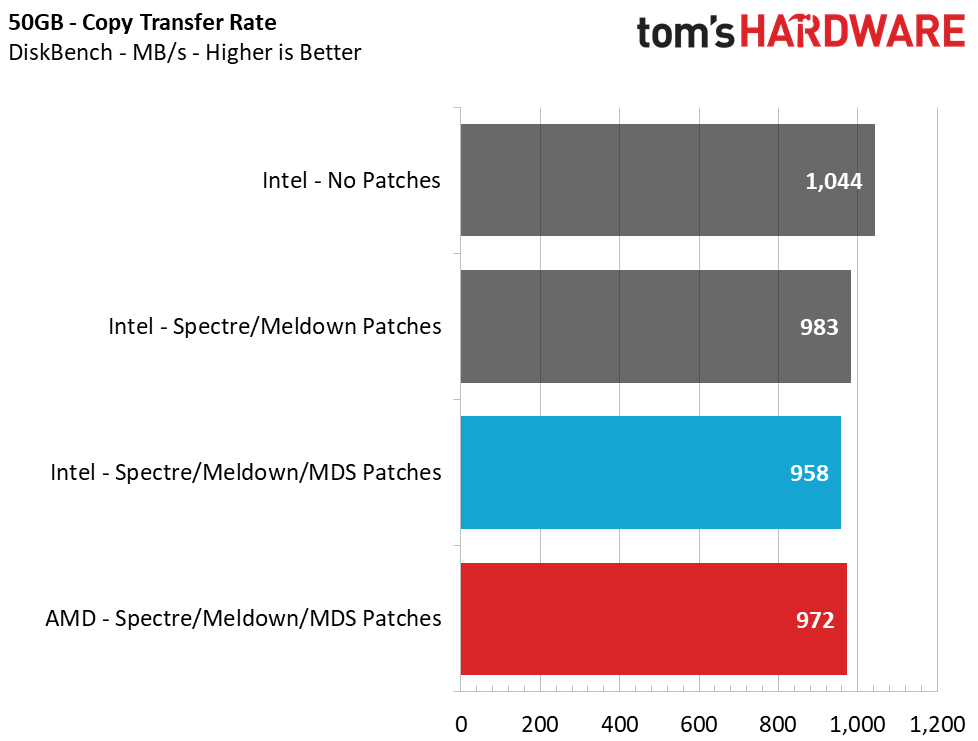
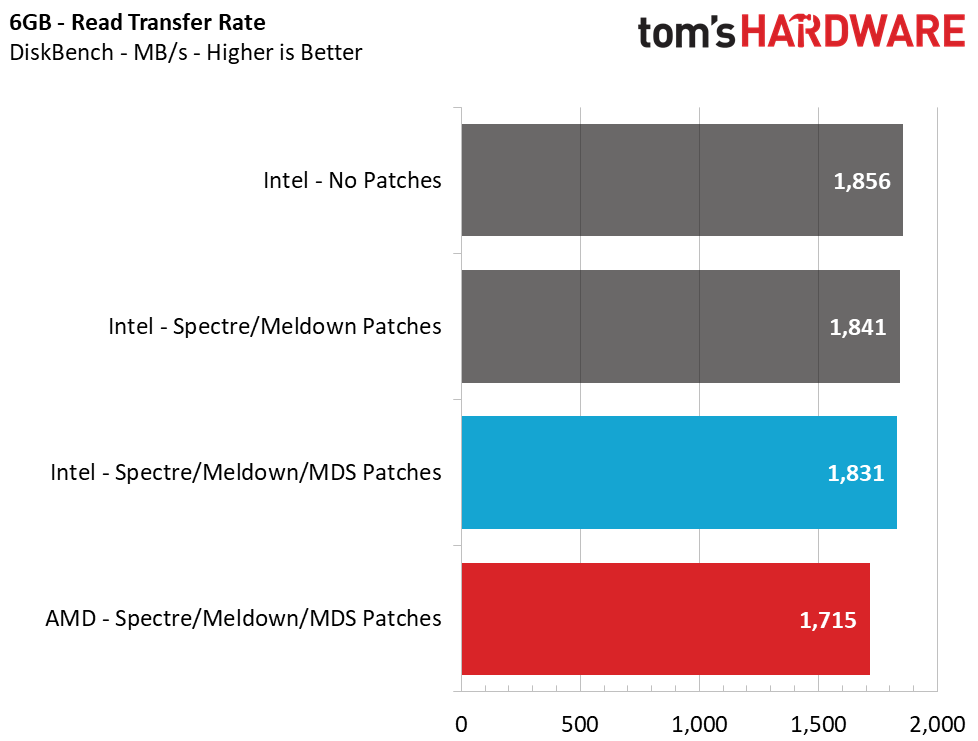
DiskBench reveals an 8.2% loss in Intel's file copy performance and a 1.4% loss in sequential read performance by having the Meltdown/Spectre patches enabled. Adding in the MDS mitigations showed an additional 2.5% impact on copy performance and 0.5% impact on read performance.
Compared to our AMD system, we see that Intel still offers about 1.5% faster file copies, but it loses by 6.3% during the file reading test.
Trace Testing – PCMark 8 Storage Test 2.0
PCMark 8 is a trace-based benchmark that uses Microsoft Office, Adobe Creative Suite, World of Warcraft, and Battlefield 3 to measure the performance of storage devices in real-world scenarios. This jack-of-all-trades test gives us a good gauge of overall performance in common PC tasks.
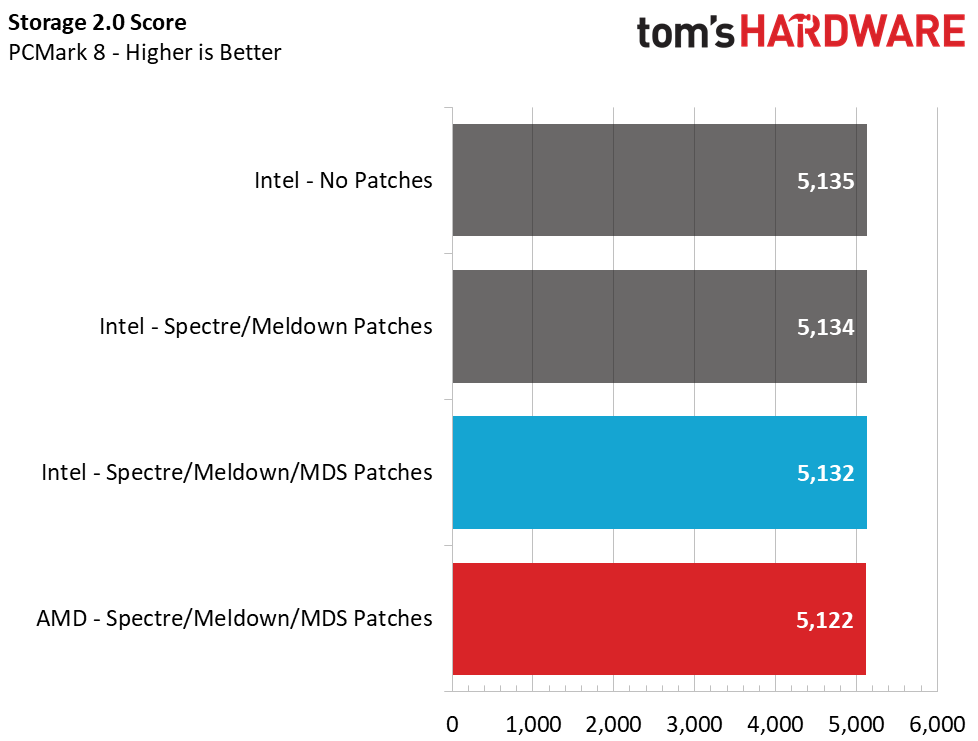
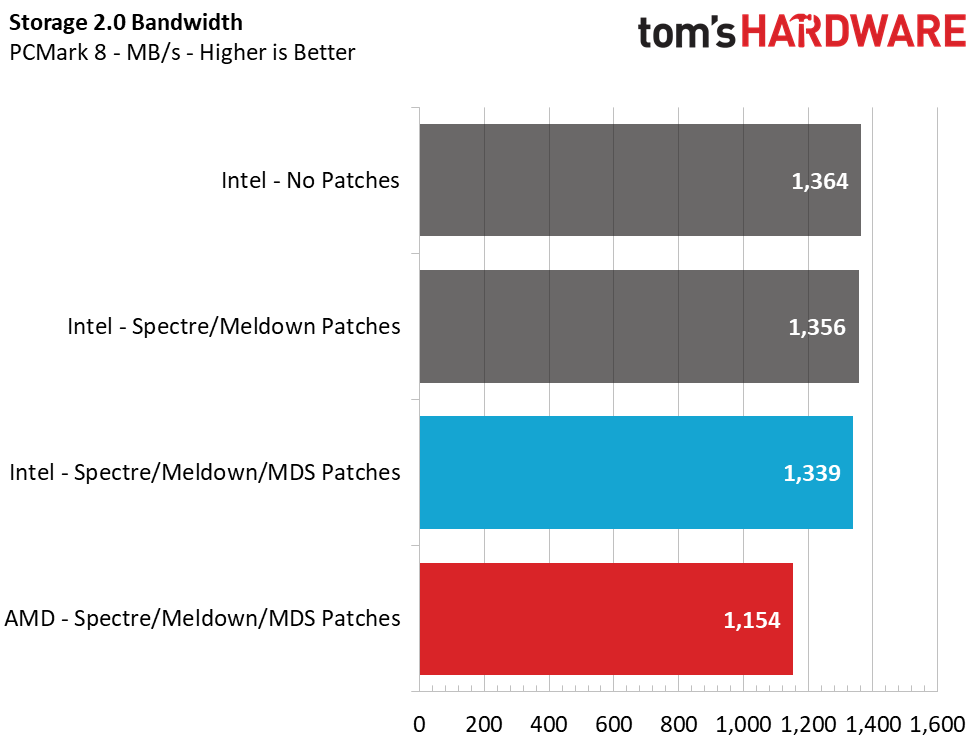
In PCMark 8, the total score didn’t change much by enabling and disabling the patches, but the average bandwidth sure did. With slower random and sequential performance, Intel's average bandwidth decreased 2%. The AMD system scored just 0.2% lower than Intel in this test, and its bandwidth was about 14% lower as well. Even with the Ryzen 2700X's extra threads and faster performance in synthetic storage tests (which we'll see below), the Intel system's higher frequency allowed it to outperform the AMD system.
Application Testing – SYSmark 2018
Like PCMark, SYSmark uses real applications to measure system performance. SYSmark takes things much further, though. The software uses fourteen different applications that run real workloads with real data sets to measure how overall system performance impacts the user experience. BAPCo's SYSmark 2014 SE installs a full suite of applications for its tests, which includes Microsoft Office, Google Chrome, Corel WinZip, several Adobe software applications, and GIMP. That also makes it a great test to measure the amount of time it takes to install widely-used programs after you install a fresh operating system.
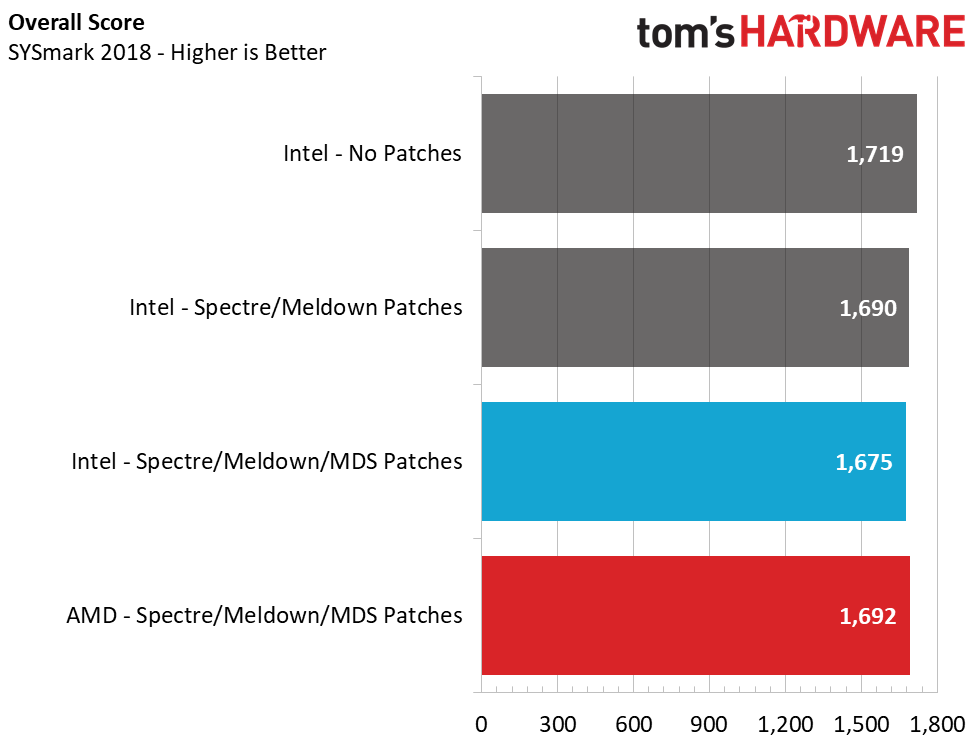
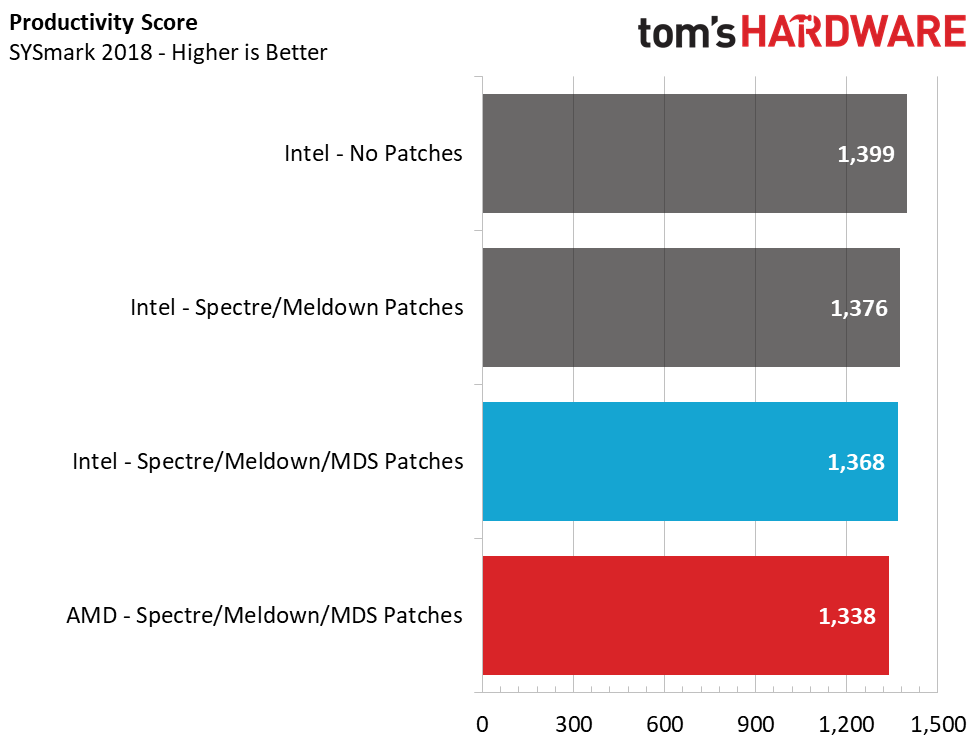
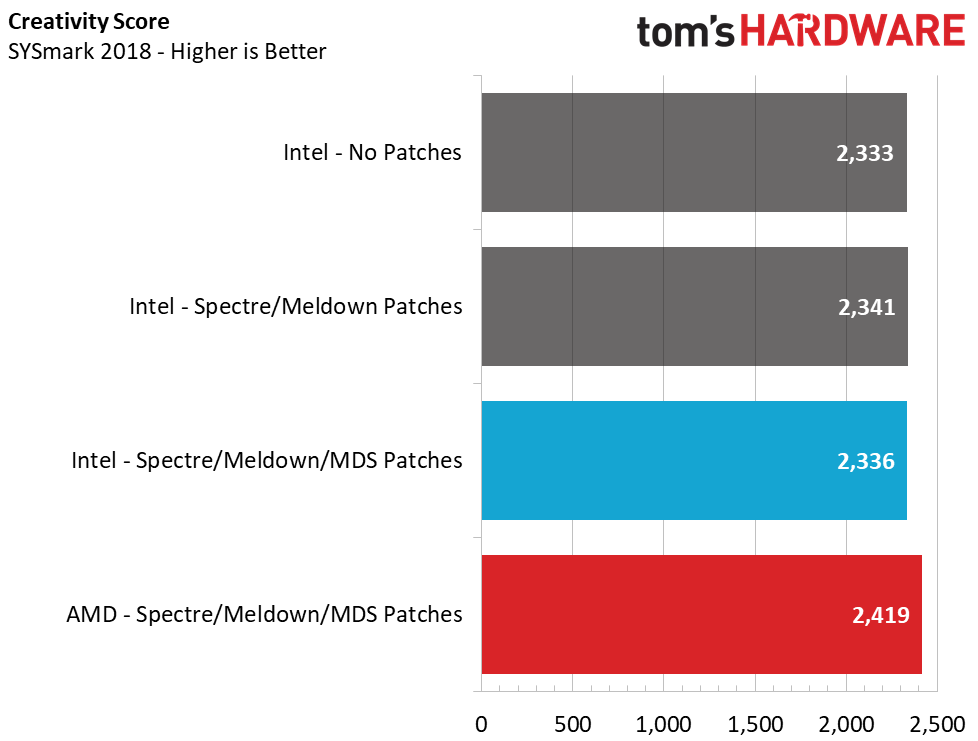
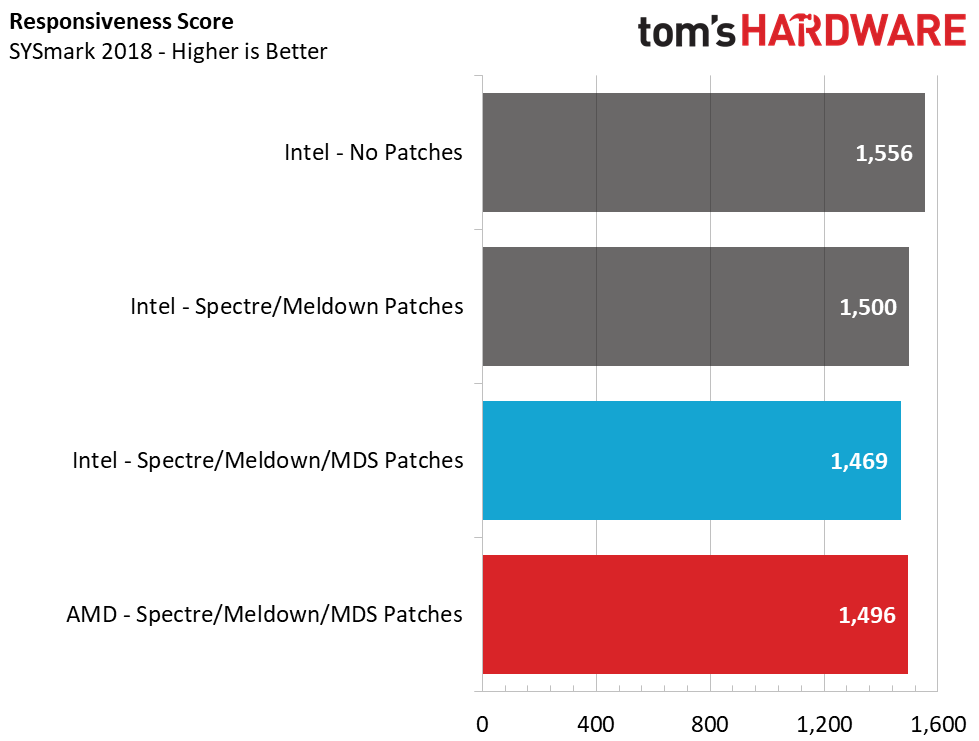
In SYSmark 2018, Intel drops 2.6% in the overall performance score after we enable the patches. But even more telling, Intel loses nearly 6% in the system responsiveness metric, which measures snappiness. This stems directly from sensitivity to storage changes more than the other aspects of the test. These aren't huge changes overall, but it gives AMD a 1% lead in the overall score and a 2% lead in responsiveness.
Synthetics – CrystalDiskMark
Now we'll turn to synthetic tests to see just how the patches resulted in the lower performance in the real-world workloads above. CrystalDiskMark (CDM) is a simple file size benchmarking tool that offers plenty of measurements for comparison.
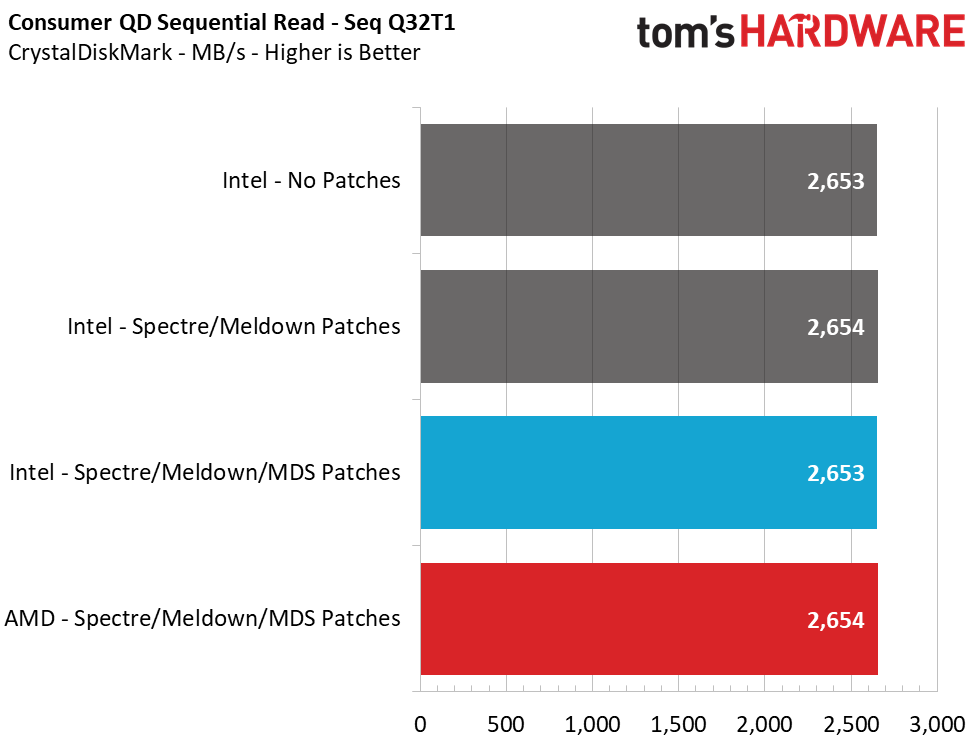
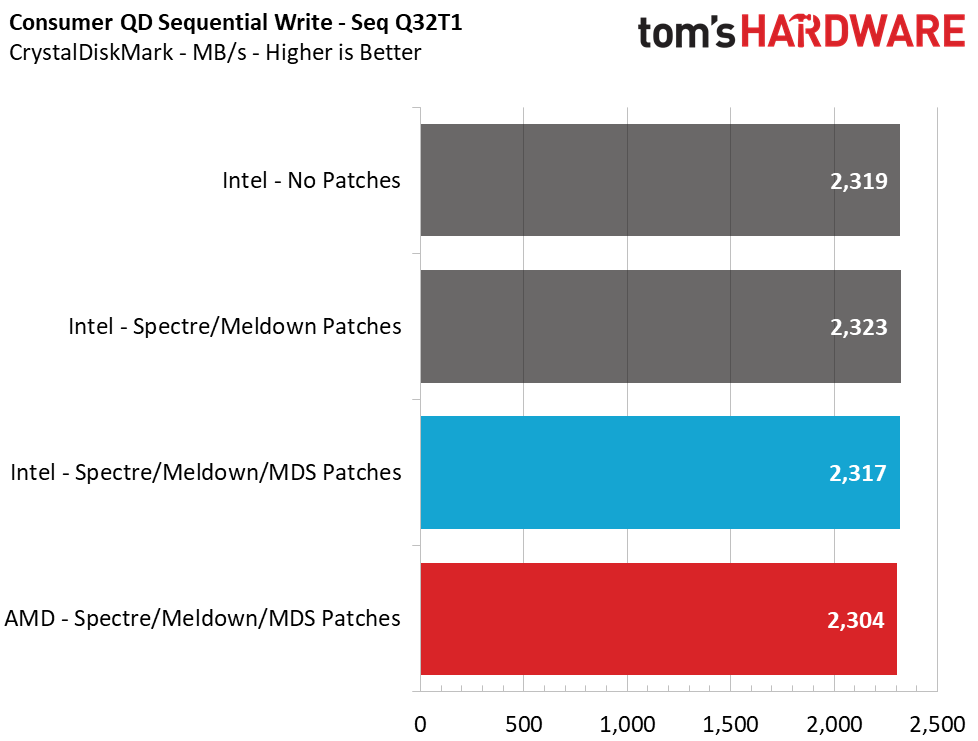
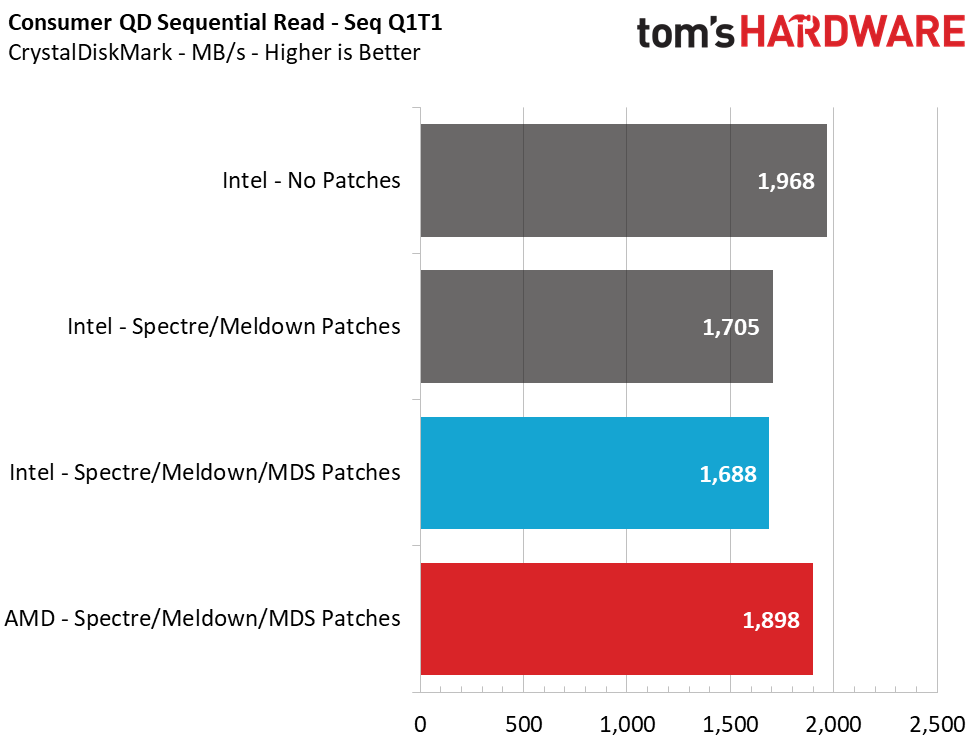
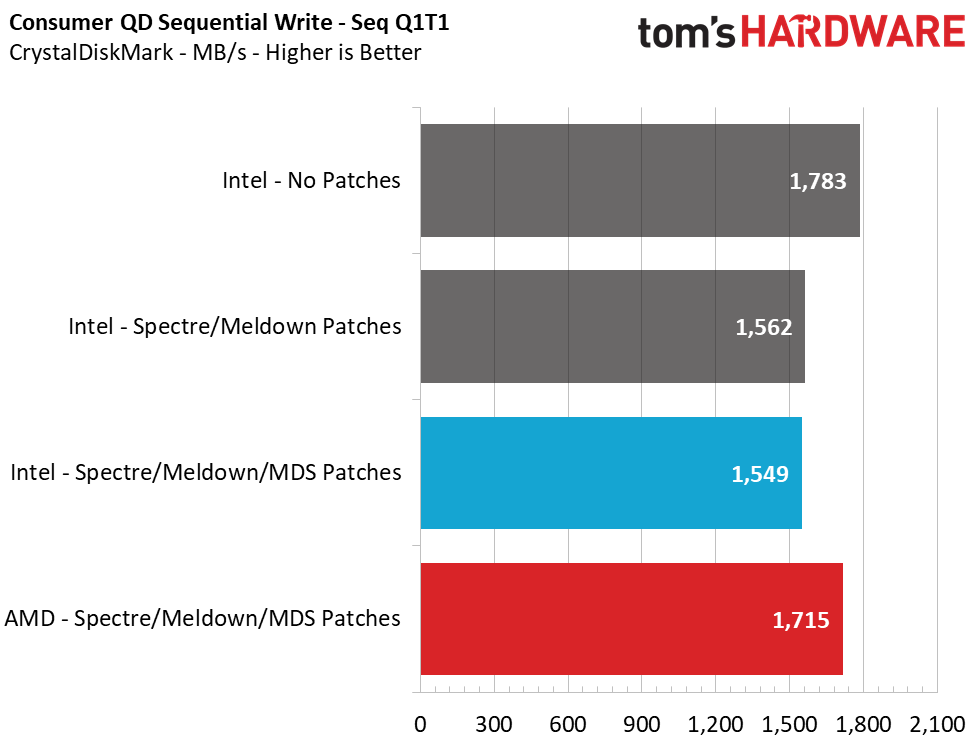
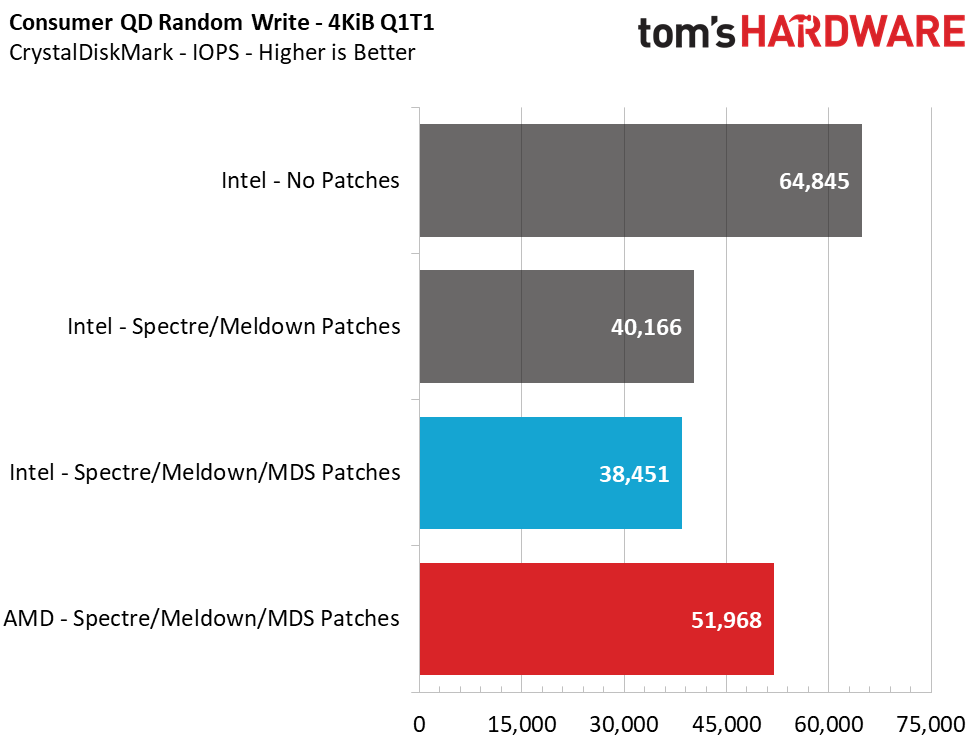
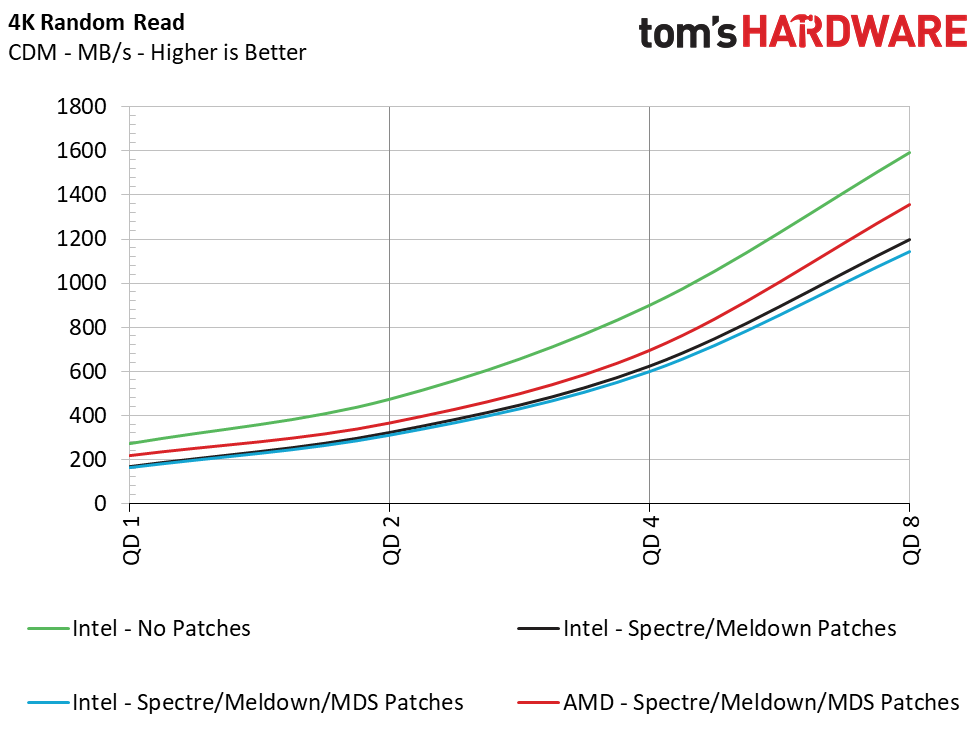
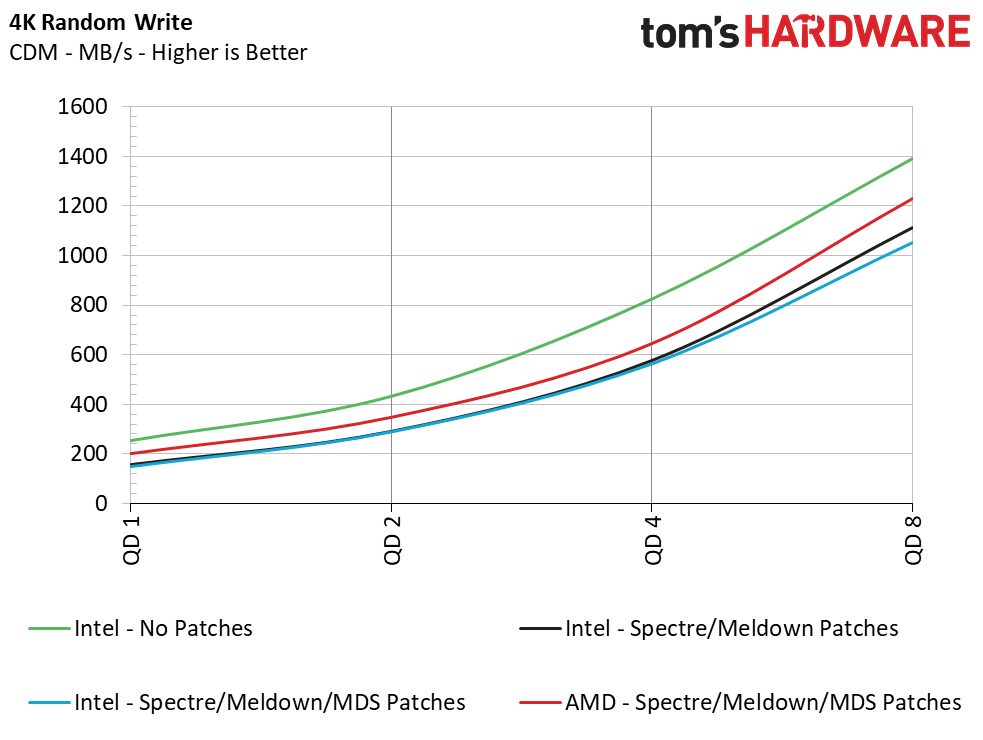
Sequential performance at a queue depth (QD) of 32, which represents a very heavy load you won't see often on a PC, shows no difference in performance with the Meltdown/Spectre patches toggled on and off. But Intel lost 14% of its performance when we tested at a more realistic QD of 1. This means that transfers of a single file will see a significant slowdown. Looking at how the new MDS patches have impacted performance over the previous implementations, we see another ~1% reduction in performance.
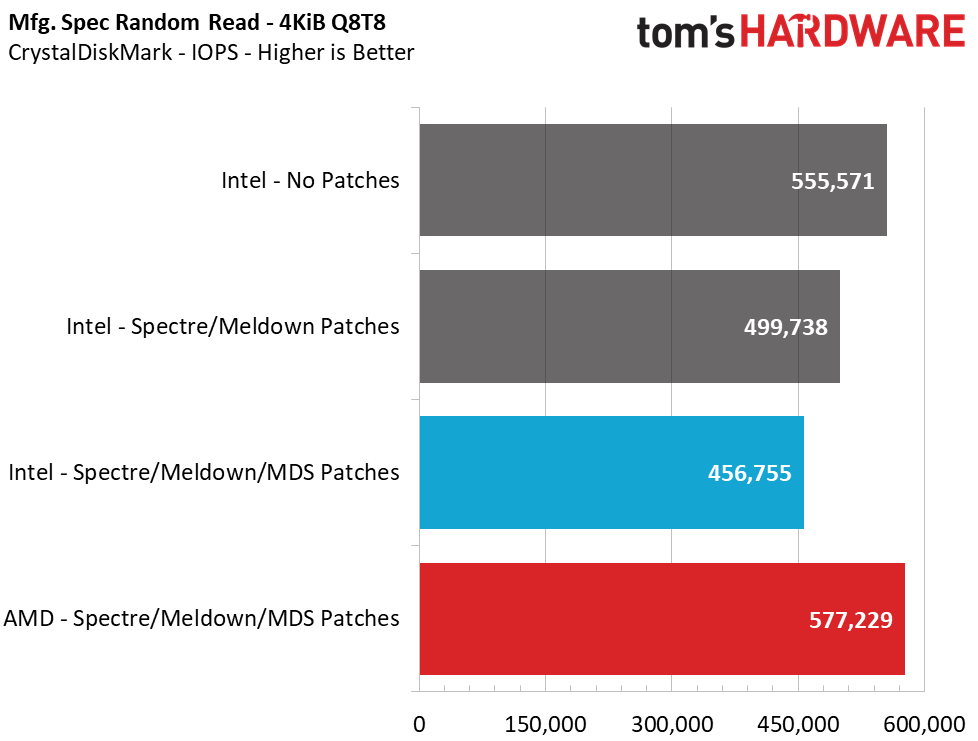
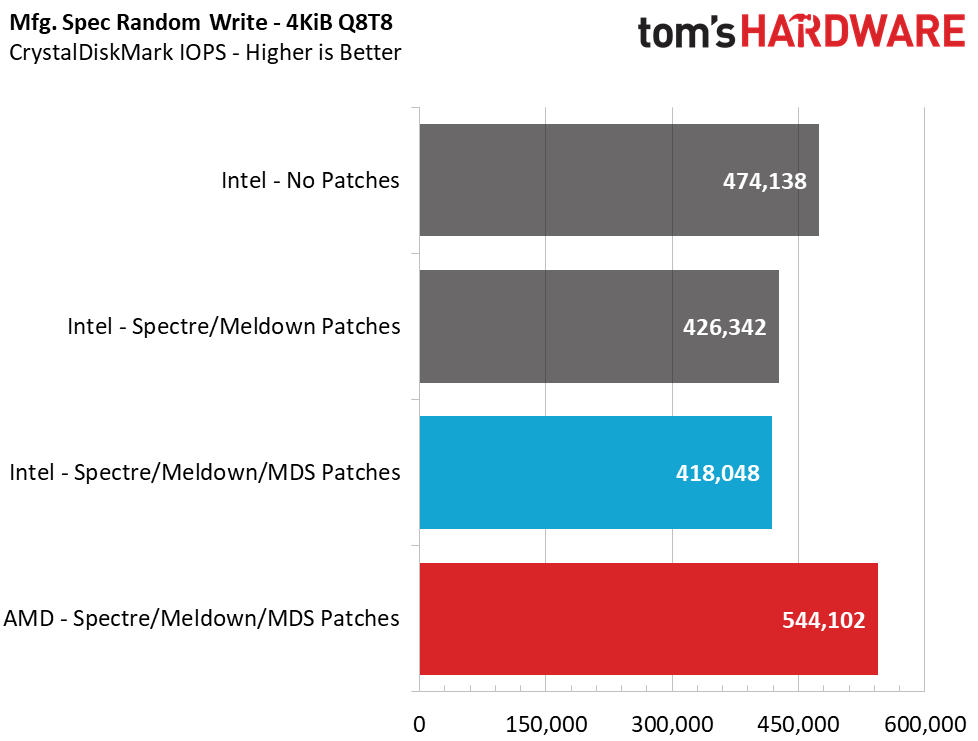
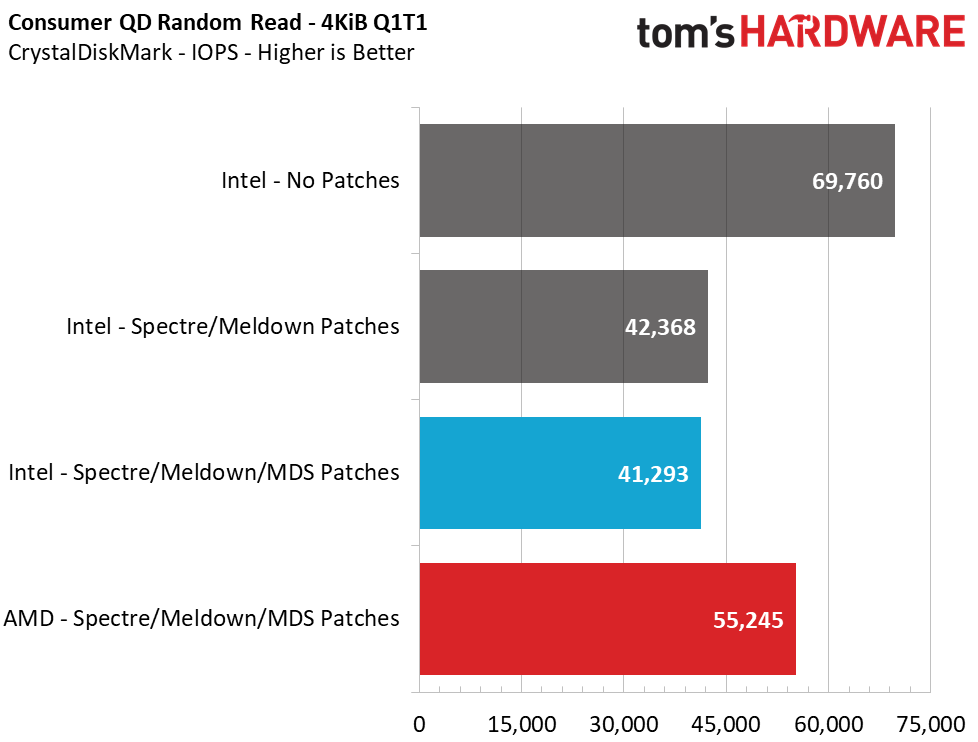
Unfortunately, 4K random performance is impacted the most. This is, by far, the most common type of file access inside an operating system, like Windows, so it is a disappointing sign. At a high QD of 64, we see an 18% loss in read performance and a 12% loss in write performance, but this heavy load isn't common for a PC. Most PC workloads fall in the QD1-2 range, and workstation users can hit upwards of QD8. When testing at these lower QDs, we see a staggering 41% reduction in read and write performance from enabling the Meltdown/Spectre patches. Adding in the new MDS fixes, we can see an additional 2.5% to 6% performance loss.
When compared to the AMD system, we see that the difference in sequential performance is also negligible at a high QD of 32, but at QD1, AMD is actually 10.7% - 12.4% faster than the Intel system. That lead widens when we compare 4K random performance. At QD64, the AMD system dished out 26% more read performance and 30% higher write performance. Just as we observed during high-QD workloads, the AMD system outperformed the Intel system in light workloads (low QDs). The AMD system provides 33-35% more performance than the Intel test mule. Scaling the workload up to QD2-QD8 reveals a 15-20% lead for AMD in reads and writes, too.
Conclusion
Intel, and the chipmaking industry at large, have their hands full lately. Not only are new vulnerabilities appearing from left and right, but the patches often equate to big losses in performance. AMD hasn't been as exposed to these vulnerabilities, and as a result, the red team has caught up to Intel quite a bit and even taken the lead in some areas.
In synthetic testing, the performance impact can be huge--upwards of a 41% reduction in 4K random metrics. But the performance drop in real-world applications isn't quite as frightful. Our application testing measured a ~1-10% reduction in performance, depending on the test. While the difference isn’t huge, now we are faced with performance losses due to these patches if we want to keep our data safe.
If you have an Intel CPU with Hyper-Threading, things can get worse. Disabling Hyper-Threading is the only way to be fully protected from the MDS vulnerabilities, leading Google to disable Hyper-Threading on its Chrome OS 74 (and later). If you have a processor with Hyper-Threading, that can cost you up to 40% of your performance in applications. The price for full protection in some cases comes at the cost of a feature that users have already paid for: To assure 100% protection from the latest vulnerabilities, you essentially have to transform your expensive 8C/16T Core i9-9900K into an 8C/8T Core i7-9700K.
Even worse for Intel, AMD has caught up in storage performance, and even surpassed Intel in some instances, due to the latest patches. AMD’s Simultaneous Multi-Threading (SMT), which is similar to Intel's Hyper-Threading., also isn’t affected by the latest wave of attacks. That could open up an even larger gap in application performance and change the value comparison in the hotly-contested mid-range price bands.
Intel is working mitigations into silicon for next-gen CPUs as we speak, but how many more vulnerabilities will there be, and will the industry be able to fully catch up? How much slower could systems get over the coming months due to new mitigations? The answers to these questions are unknown, but things are sure looking good for AMD right now.
MORE: Best SSDs
MORE: How We Test HDDs And SSDs
MORE: Best External Hard Drives and SSDs
MORE: All SSD Content

Sean is a Contributing Editor at Tom’s Hardware US, covering storage hardware.

