Intel Core i5-9400F CPU Review: Cutting On-Die Graphics For A Slightly Lower Price
Why you can trust Tom's Hardware
VRMark, 3DMark and AotS: Escalation
VRMark, 3DMark
We aren't big fans of using synthetic benchmarks to measure performance, but 3DMark's DX11 and DX12 CPU tests provide useful insight into the amount of horsepower available to game engines.
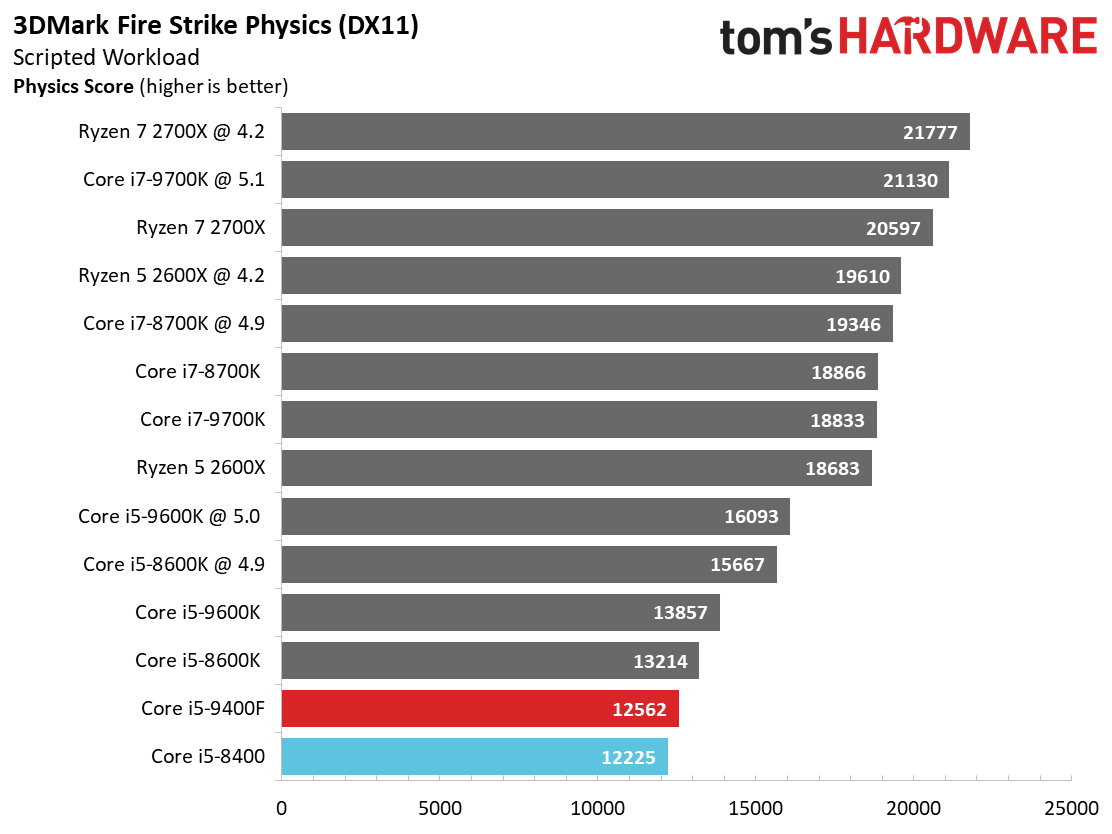
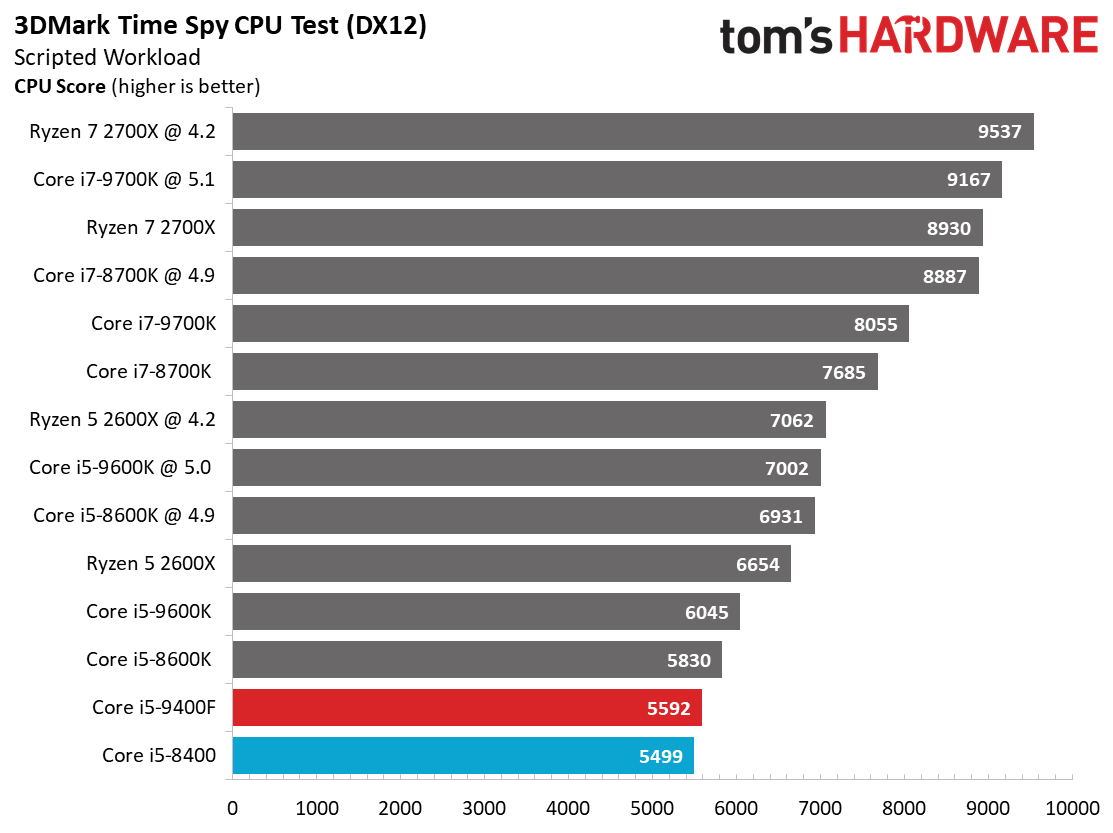
The 3DMark DX11 and DX12 CPU tests tend to scale linearly based on core count, so the Core i5-9400F yields minor improvements over the similarly-equipped six-core -8400 of 2.76% and 1.69%, respectively. The less expensive six-core Ryzen 5 2600X provides far more performance in these tests, and it also sells for ~$5 more. That higher score is a byproduct of the Ryzen's extra threads. Just remember, though, multi-threaded performance doesn't always help, since game engines don't always scale as well as synthetic benchmarks.
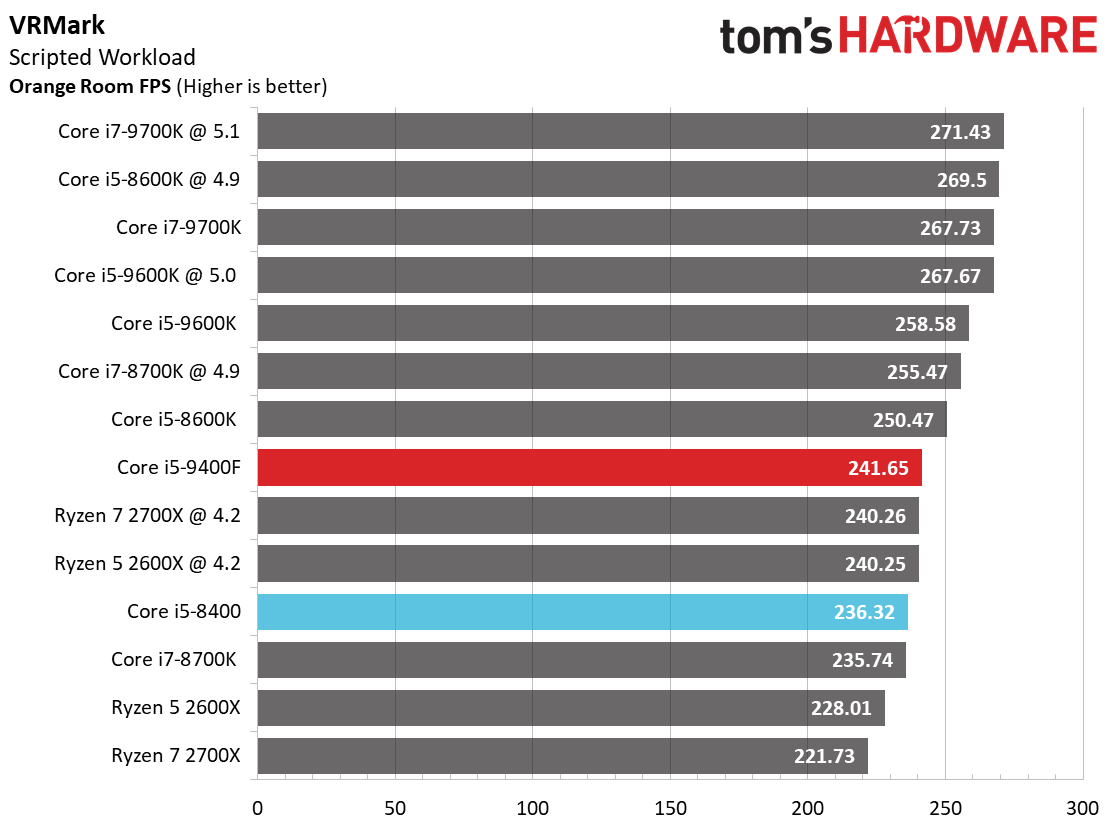
In our experience, VRMark values per-core performance, which is a mixture of frequency and instructions per cycle (IPC) throughput. The benchmark lets you gauge your system's suitability for use with the HTC Vive or Oculus Rift, even if you don't currently own an HMD. UL defines a passing score as anything above 109 FPS. Intel's -9400F notches a small win over the -8400, but opens up an impressive lead over the stock Ryzen 5 2600X. Overclocking AMD's chip to 4.2 GHz allows it to nearly match the -9400F, though.
Ashes of the Singularity: Escalation
Ashes of the Singularity: Escalation is a computationally intensive title that scales well with thread count.
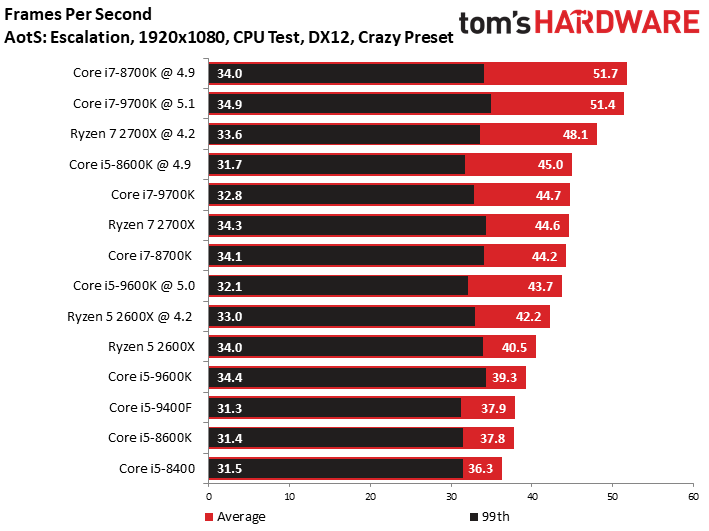
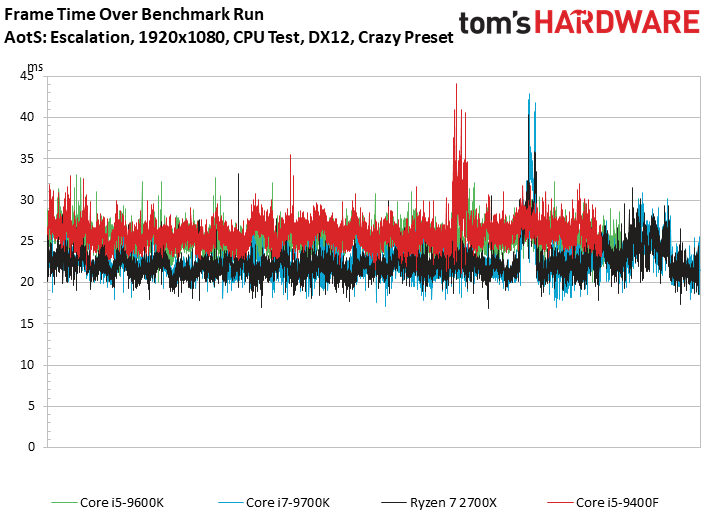
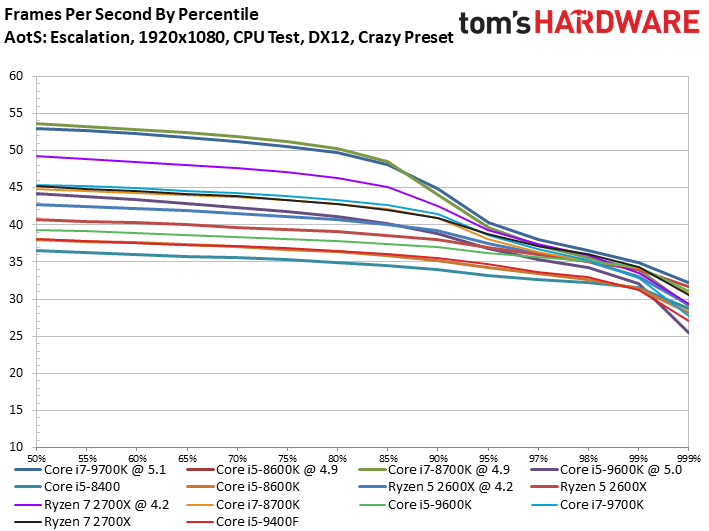
The Core i5-9400F takes a 1.6 FPS lead over the previous-gen -8400, but trails the Ryzen 5 2600X. Overclocking helps AMD's CPU to extend its advantage, while the Core i5-9400F languishes under its locked multiplier.
MORE: Best CPUs
MORE: Intel & AMD Processor Hierarchy
Get Tom's Hardware's best news and in-depth reviews, straight to your inbox.
MORE: All CPUs Content
Current page: VRMark, 3DMark and AotS: Escalation
Prev Page Test Setup Next Page Dawn of War III, GTA: V, Hitman
Paul Alcorn is the Editor-in-Chief for Tom's Hardware US. He also writes news and reviews on CPUs, storage, and enterprise hardware.
-
tennis2 Would like to see some testing done to determine how core count affects games these days with the "core count race" going on. It still seems like 4-6 cores is where the cutoff is before frequency is the determining factor of frame rates.Reply
Also show if/how online multiplayer changes that conclusion. -
R_1 in the comparison chart you have the 9400f having graphics and the 9400 as not having graphics.Reply -
NightHawkRMX 9400f would be a good deal if it had a higher turbo or overclocking support. Z390 boards suitable for overclocking are expensive as well.Reply
Otherwise, Ryzen 5 2600x has 6 more threads, higher turbo, overclocking support, and cheap overclocking boards than negate the slightly higher chip price.
Still waiting on Computex. -
Karadjgne I'm still wondering why there's even testing of single core performance. In the rendering test, multi-core, the Ryzens dominated Intel. Very next test was a single core performance test where as usual, Intel was stronger. Why? I can't think of any single core rendering, or games for that matter. It's kind of archaic to my mind. A multi-core test on software that that uses multiple cores makes perfect sense. It shows how well the software responds to the amount of threads. Saying an intel beats a Ryzen in single core rendering is.....Reply
(I'm not gonna use those words in polite company) -
pete_101 I see the CPU has a base frequency of 2.9 and a turbo of 4.1 GHz, but this will be a single core maximum speed. Although it's locked, it should be possible in the mobo BIOS to set all 6 cores to run at this frequency.....if you have a good enough cooler.Reply -
NightHawkRMX There should be an 8 thread Cinebench test to compare CPUs. Most games only use around 8 threads or a little more (battlefield comes to mind). An 8 thread test would be the most accurate way to test gaming CPUs.Reply -
Anubis666 It's funny how prices are different in different countries.. In one thread ,a guy says 15-20$ less than Ryzen 2600 so just go with the i5 9400f..Reply
Here in India i5 9400f is 60$ cheaper than Ryzen 2600 and 95$ cheaper than 2600X..
I'm still confused to go with i5 9400f over 2600 just for the multi thread.. As I wanted it for playing , recording Games,Edit and upload to YouTube and, probably streaming Dota 2 in near future.
The price of i5 9400f is tempting but I'm not sure it can able to do stuff I mentioned above with close to ease..
I'm sure coming Ryzen 3000 is even high price due to high demand in here.