Lexar NM790 SSD Review: A Pleasant Surprise

The Year of the Rabbit Brings a Svelte SSD.

Lexar NM790
(Image: © Tom's Hardware)

Tom's Hardware Verdict

The Lexar NM790 is an all-around excellent PCIe 4.0 NVMe SSD that would work great in a laptop, desktop, or PS5. It’s also priced effectively at 4TB to offer a compelling TLC-based alternative for high capacity.

Pros

  • +

    Good to excellent all-around performance, good sustained

  • +

    Very power-efficient

  • +

    4TB with TLC, and single-sided

  • +

    Pricing is reasonable, but best at 4TB

Cons

  • -

    YMTC flash type could vary

Why you can trust Tom's Hardware Our expert reviewers spend hours testing and comparing products and services so you can choose the best for you. Find out more about how we test.

The Lexar NM790 pleasantly surprises with new hardware rivaling even high-end PCIe 4.0 NVMe SSDs. Typical compromises and trade-offs aren’t made, as it packs in 4TB of TLC in a svelte, single-sided design. This SSD is worth a look if you want a lot of fast, efficient storage for your laptop, desktop, or PS5. There are only minor caveats that are worth overlooking, given the unexpected performance results, but this SSD still fills a certain space with other options remaining viable depending on your needs.

Lexar is not an unknown brand, but they have shifted towards YMTC flash in recent times. YMTC’s flash has seen some controversy due to US-China political complications, and there have even been rumors that YMTC has borrowed some intellectual property for its NAND. This makes reviewing drives with the newest 232-Layer flash a bit tricky as many manufacturers want to distance themselves, a problem further exacerbated due to the use of China-based Maxio’s SSD controllers. However, this hardware is seeing better availability in the U.S., and the NM790 shows why that’s hard to ignore.

Specifications

Swipe to scroll horizontally
Header Cell - Column 0 512GB1TB2TB4TBHeader Cell - Column 5
Pricing$48.96$69.99$109.88$195.16
Form FactorM.2 2280M.2 2280M.2 2280M.2 2280
Interface / Protocolx4 PCIe 4.0 | NVMe 2.0x4 PCIe 4.0 | NVMe 2.0x4 PCIe 4.0 | NVMe 2.0x4 PCIe 4.0 | NVMe 2.0
ControllerMaxio MAP1602Maxio MAP1602Maxio MAP1602Maxio MAP1602
DRAMNo (HMB)No (HMB)No (HMB)No (HMB)
Flash Memory232-Layer YMTC TLC232-Layer YMTC TLC232-Layer YMTC TLC232-Layer YMTC TLC
Sequential Read7,200 MBps7,400 MBps7,400 MBps7,400 MBps
Sequential Write4,400 MBps6,500 MBps6,500 MBps6,500 MBps
Random Read800K1000K1000K1000K
Random Write800K900K900K900K
SecurityN/AN/AN/AN/A
Endurance (TBW)500TBW1000TBW1500TB3000TBW
Part NumberLNM790X512G-RNNNU/GLNM790X001T-RNNNU/GLNM790X002T-RNNNU/GLNM790X004T-RNNNU/G
Warranty5-Year5-Year5-Year5-Year

The Lexar NM790 comes in 512GB, 1TB, 2TB, and 4TB capacities, currently at $48.96, $69.99, $109.88, and $196.15, respectively. These prices are all at least somewhat competitive, but the 4TB is likely the most popular option as it’s priced extremely well for that much storage. The drive reaches up to 7,400 / 6,500 MBps for sequential reads and writes and 1000K / 900K random read and write IOPS, which is competitive with even top-tier PCIe 4.0 SSDs. All versions have a five-year warranty with an endurance rating of 1000TB of writes per TB capacity.

Software and Accessories

Lexar currently has no software available for its SSDs. We recommend CrystalDiskInfo to get health information for your SSD and free imaging/cloning software like Clonezilla for backup.

A Closer Look

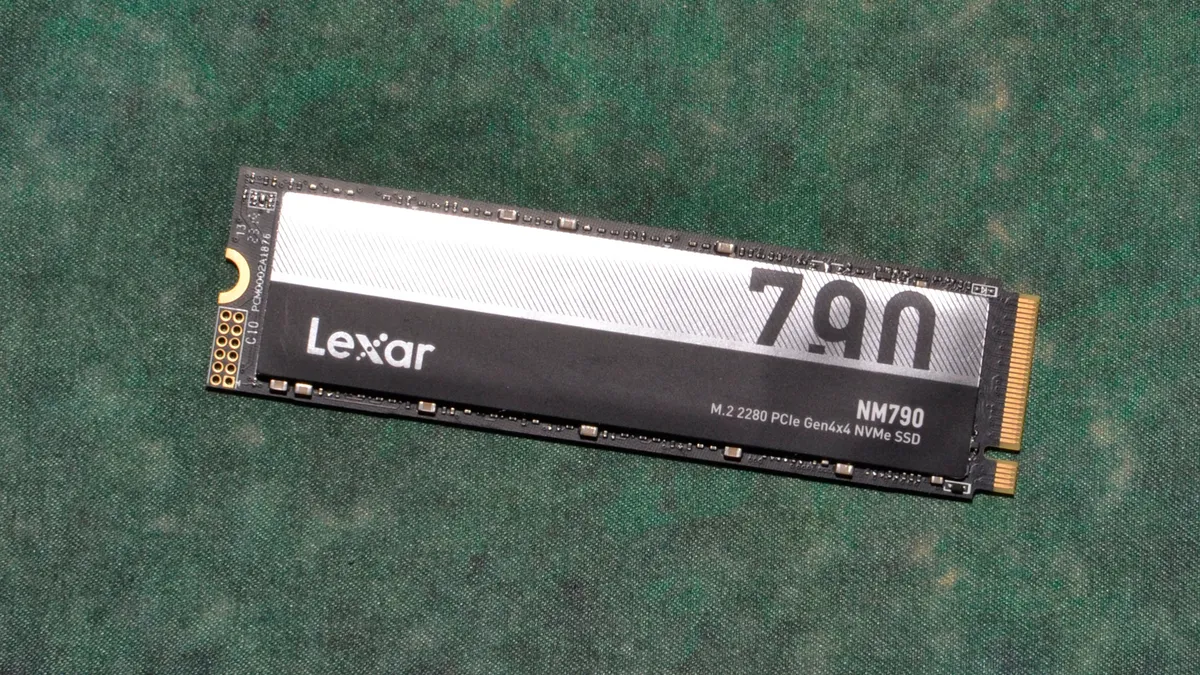
This looks like your standard M.2 NVMe SSD, but careful attention reveals that this drive is single-sided. This is quite the feat for a 4TB TLC drive. Some laptops may require a single-sided SSD, and, in general, such SSDs are easier to work with and cool. The NM790 is a good alternative to the QLC Crucial P3 Plus if you need 4TB in this form factor.

There's also the Samsung 990 Pro 4TB that just launched (testing for this review was completed prior to that drive, though you can see the Lexar NM790 numbers in that review). That's arguably a better drive, but the increase in price looks to be quite steep. We'll need to see where prices settle on the 990 Pro 4TB over time, but the MSRP is over 50% higher than the current Lexar street pricing.

(Image credit: Tom's Hardware)

The Maxio MAP1602 is a fast, DRAM-less controller that we first saw on the Acer Predator GM7. Although that drive originally came with YMTC’s 2nd generation 128-Layer TLC, there was speculation that it could come with the newer 232-Layer TLC. Lexar would not officially confirm the latter on the NM790, but testing suggests that’s what is on this drive. This flash competes with Micron’s 232-Layer TLC, which so far has been mostly going to PCIe 5.0 SSDs.

The controller, for its part, is a 4-channel, 12nm design that can push the limits of PCIe 4.0 with its 2400 MT/s bus. Some drives with this controller will drop down to 1600 MT/s to compete more directly with popular budget drives like the WD Black SN770, the Silicon Power UD90, the Team MP44L, the HP FX900, and other drives hovering around the 5 GBps point. With the full bus and 1Tb TLC dies, as is the case with the NM790, this controller can instead compete even with high-end 4.0 drives while being less expensive.

MORE: Best SSDs

MORE: Best External SSDs and Hard Drives

MORE: How We Test HDDs And SSDs

MORE: All SSD Content

Shane Downing
Freelance Reviewer

Shane Downing is a Freelance Reviewer for Tom’s Hardware US, covering consumer storage hardware.

  • edzieba
    A few requests for chart usability:
    -Plot the ATTO charts on a log-lin scale. The crucial portions are the low-QD areas, and those are just an unreadably thick overlaid line.
    - Along with the data-rate/time IOMeter plots, add data-rate/data-transferred plots. This allows drives to be compared in terms of buffer size, and most workloads scale by filesize rather than by data-independant-duration.
    Reply
  • WrongRookie
    Wow! That's seriously good from Lexar.
    Reply
  • JarredWaltonGPU
    edzieba said:
    A few requests for chart usability:
    -Plot the ATTO charts on a log-lin scale. The crucial portions are the low-QD areas, and those are just an unreadably thick overlaid line.
    - Along with the data-rate/time IOMeter plots, add data-rate/data-transferred plots. This allows drives to be compared in terms of buffer size, and most workloads scale by filesize rather than by data-independant-duration.
    So, to the first point about ATTO, please note that these are not low queue depth results. They're block size transfer rates. The drives are tested using the default QD of 4 — not necessarily fully realistic, but at least better than QD32 stuff. :) Anyway, ATTO is very much synthetic and I wouldn't depend too much on its results as a true indicator of performance. What it really shows is how performance scales with larger block sizes and reads/writes. I think a lot of SSDs are tuned for maybe 256KB blocks, or at least they'll do way better at 256KB than at 4KB.

    The other issue is that if we switch to logarithmic, it just trades "viewability" of the low block sizes for "unreadability" of the larger block sizes. Like this:

    283
    Most SSDs still clump together at small sizes, while larger sizes don't look particularly different. Most people are less familiar with log scaling, and I'd very much worry that anyone looking at the above chart would think, "Oh, there's almost no difference between any of the drives past the 4KiB mark!" We could also provide both standard and log scaling versions of the charts, though, so I'll see what Shane thinks.

    Your second question, I'm not sure what you're trying to get at. We show how the drives handle sustained 1MiB writes for 15 minutes, as well as a "zoomed in" 150 seconds view. Then we have a chart that shows the steady state performance at the end of the 15 minutes. It's not meant to be a real-world workload, but just a worst-case sustained writes workload. We note how big it indicates the pSLC cache is on the drive being reviewed, though of course that's for an empty drive.

    But I will say that in my experience, drives that have higher steady state numbers don't tend to feel slower over time, particularly as they get filled up. It's one of the reasons I really dislike QLC drives. I have yet to use one in any long-term scenario where I end up thinking, "This is fine." Take a 2TB QLC, put 1.5TB of data on it, and on a lot of drives they'll start feeling more like a moderately fast HDD than an SSD!
    Reply
  • edzieba
    JarredWaltonGPU said:
    So, to the first point about ATTO, please note that these are not low queue depth results. They're block size transfer rates.
    Yep, that was a brainfart, tried to write both points up at once, split them apart, and copied the wrong value.
    The log chart does show where some drives diverge in the low transaction size area that most strongly determine perceived responsiveness (e.g. immediate UI interactions) and show an order-of-magnitude difference in performance where the linear chart squashes that to nothing to highlight a ~4x difference in performance.
    Your second question, I'm not sure what you're trying to get at. We show how the drives handle sustained 1MiB writes for 15 minutes, as well as a "zoomed in" 150 seconds view. Then we have a chart that shows the steady state performance at the end of the 15 minutes. It's not meant to be a real-world workload, but just a worst-case sustained writes workload. We note how big it indicates the pSLC cache is on the drive being reviewed, though of course that's for an empty drive.
    Charting with the data transferred across X rather than time gives an instant visualisation of how much data can be moved in one lump before the drive drops to steady-state performance (e.g. "I move 50GB BD images around, Drive X is slightly faster at peak for 30GB then drops, but Drive Y is a bit slower at peak but will sustain that for 60GB, so is better for my use-case even with a lower peak performance number"). Wall-time before saturation does not give you any meaningful information, because workload duration depends on data-rate and data-size, and you have then only charted one of those rather than both (i.e. you are charting an X axis where the X value is dependant on the Y value rather than independent ).
    It would also drive home to people that do not regularly transfer large files that they will be experiencing the peak performance almost all the time rather than the saturated performance.
    Reply
  • Avro Arrow
    I'm assuming that Lexar is normally good. I recently had a Lexar 2TB burn itself up on me. I even tried mounting a heatsink on it but it still died. It lasted for less than a year (thanking my lucky stars that I back everything up).
    Reply
  • bazoka1945
    Avro Arrow said:
    I'm assuming that Lexar is normally good. I recently had a Lexar 2TB burn itself up on me. I even tried mounting a heatsink on it but it still died. It lasted for less than a year (thanking my lucky stars that I back everything up).
    which lexar did you have and how much temp c thank you :)
    Reply
  • Avro Arrow
    bazoka1945 said:
    which lexar did you have and how much temp c thank you :)
    The part number was LNM610P002T-RNNNG. I don't recall what the peak temperature was but the thing clearly had something wrong with it because it was idling at 62°C. I seem to remember the temperature going into the mid 70s but I'm not 100% certain. It was CrystalDiskInfo that first alerted me to the problem.

    Now, I don't blame Lexar for this because anything made by human hands will have "X" number of bad units per thousand. I've used Lexar products before and they've worked perfectly. I think that perhaps the entire batch of LNM610P002T-RNNNG drives had problems because they didn't have any to replace mine. Instead I sent them my Canada Computers invoice and they refunded me the invoice total. I'd call that pretty good customer service so I commend them on that.

    At the end of the day, ALL forms of memory are made by Samsung, Hynix or Micron regardless of what brand is stamped on the product. The first time that I bought Silicon Power RAM, I had never heard of them before but, since I knew that it had to be made by one of the above 3 companies, I honesty didn't care what brand it was.

    Canada Computers had some nice sale on the Team MP33 2TB PCIe3 NVMe drive (I think it was like $90CAD) and so I just bought two of those to replace the LNM610P002T-RNNNG. It felt pretty good to double my gaming drive space from 2 to 4TB. ;)
    Reply