Why you can trust Tom's Hardware Our expert reviewers spend hours testing and comparing products and services so you can choose the best for you. Find out more about how we test.
Comparison Products
As the Lexar NM790 uses unfamiliar hardware, we tested it against a wide range of SSDs. This includes older drives such as the WD Red SN700, the original Sabrent Rocket, the Rocket Q, the Rocket Q4, and the Team Cardea Z44Q. More recent drives include the Sabrent Rocket 4 Plus and Rocket 4 Plus-G, the Team Cardea A440 Pro, the Seagate FireCuda 530, and the Netac NV7000. Lastly, we have the fastest PCIe 5.0 drive, the Crucial T700. The NM790 is technically a budget-class drive, so let’s see how it matches up against mainstream veterans.
Trace Testing - 3DMark Gaming Storage Benchmark
Built for gamers, 3DMark’s Storage Benchmark focuses on real-world gaming performance. Each round in this benchmark stresses storage based on gaming activities including loading games, saving progress, installing game files, and recording gameplay video streams.


The NM790 is the fastest PCIe 4.0 SSD tested here, topping this chart aside from the PCIe 5.0 Crucial T700. The controller is able to fully open up and is not let down by this flash. This puts the Phison E18 and similar class controllers, like the SM2264 and IG5236, in a bit of a bind, but it’s worth mentioning that those fall behind the WD Black SN850X, SK hynix Platinum P41/Solidigm P44 Pro, and 990 Pro. The NM790 is best positioned to dislodge the older E18 and IG5236 designs rather than reach for the performance crown.
Trace Testing – PCMark 10 Storage Benchmark
PCMark 10 is a trace-based benchmark that uses a wide-ranging set of real-world traces from popular applications and everyday tasks to measure the performance of storage devices.


Drives that do well in 3DMark also tend to do well in PCMark 10. This holds true with the NM790 as it gets very good numbers again.
Transfer Rates – DiskBench
We use the DiskBench storage benchmarking tool to test file transfer performance with a custom, 50GB dataset. We copy 31,227 files of various types, such as pictures, PDFs, and videos to a new folder and then follow-up with a reading test of a newly-written 6.5GB zip file.


The 2400 MT/s bus and ample amount of flash dies really help the NM790 push the bandwidth for file copying. Here, it beats the other 4.0 drives tested with its 232-Layer flash helping it edge out the competition. Micron’s 176-Layer TLC is beginning to show its age when paired with the older E18 SSD controller design.
Synthetic Testing - ATTO / CrystalDiskMark
ATTO and CrystalDiskMark (CDM) are free and easy-to-use storage benchmarking tools that SSD vendors commonly use to assign performance specifications to their products. Both of these tools give us insight into how each device handles different file sizes.


Performance in the ATTO write workload looks good and smooth, although the reads are a bit flatter at larger block sizes. The NM790’s controller is best with 16 dies or 2TB with this flash, so this effect may not be present with smaller capacities. Sequential reads and writes in CrystalDiskMark are fast, with a minor dip for the latter when compared to some of the other drivers in the lineup.
Random read latency is average, and random write latency is among the worst. This is partly due to the controller, which will not be as powerful as 8-channel designs with dedicated DRAM. There’s also the fact that the flash is a six-plane design, which enhances bandwidth per die but does not necessarily improve latency. Of course, the hardware trade-offs are worthwhile as this combination is quite power-efficient.
Sustained Write Performance and Cache Recovery
Official write specifications are only part of the performance picture. Most SSDs implement a write cache, which is a fast area of (usually) pseudo-SLC programmed flash that absorbs incoming data. Sustained write speeds can suffer tremendously once the workload spills outside of the cache and into the "native" TLC or QLC flash.
We use Iometer to hammer the SSD with sequential writes for 15 minutes to measure both the size of the write cache and performance after the cache is saturated. We also monitor cache recovery via multiple idle rounds.

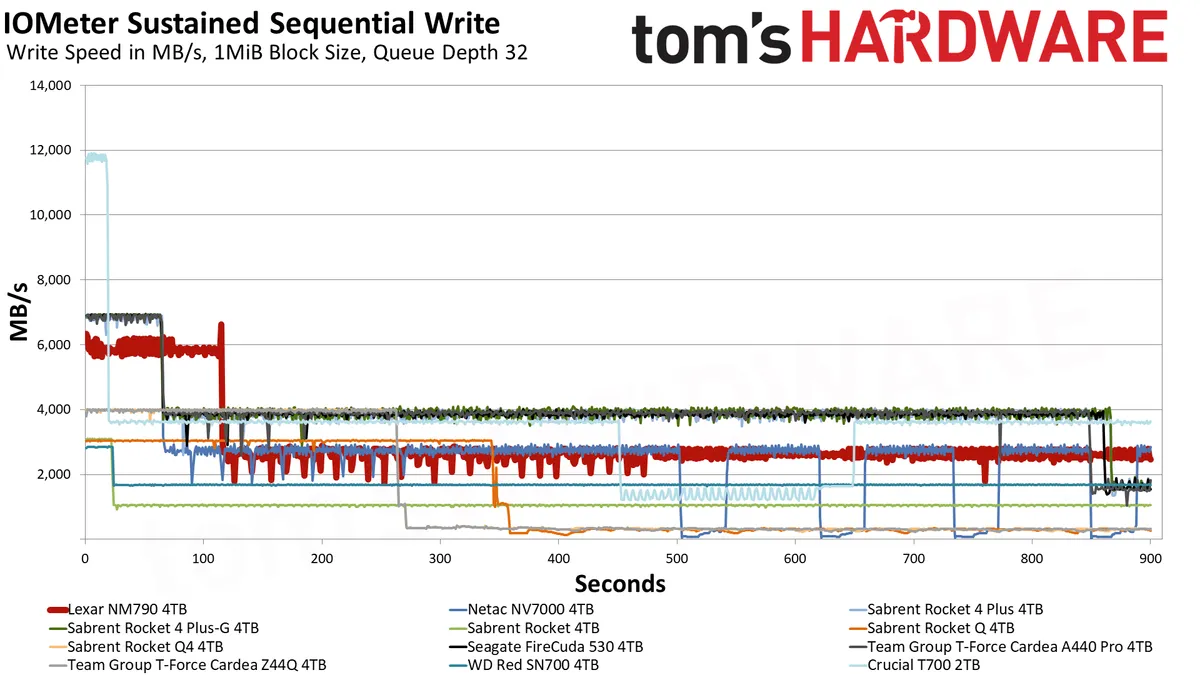

The 4TB NM790 averages upwards of 5.9 GB/s in pSLC mode and 2.6 GB/s in TLC mode. This is an excellent result for a 4-channel solution, and the cache is plenty large, to boot. While sustained writes are not a realistic workload, this does help demonstrate post-pSLC performance and reveals the speed of the flash. pSLC recovery generally has the NM790 holding in TLC mode, which is adequately fast and prevents unnecessary wear.
Power Consumption and Temperature
We use the Quarch HD Programmable Power Module to gain a deeper understanding of power characteristics. Idle power consumption is an important aspect to consider, especially if you're looking for a laptop upgrade as even the best ultrabooks can have mediocre storage.
Some SSDs can consume watts of power at idle while better-suited ones sip just milliwatts. Average workload power consumption and max consumption are two other aspects of power consumption, but performance-per-watt is more important. A drive might consume more power during any given workload, but accomplishing a task faster allows the drive to drop into an idle state more quickly, ultimately saving energy.
For temperature recording we currently poll the drive’s primary composite sensor during testing with a 24C ambient.


The NM790 is incredibly power-efficient. This is just one reason why there has been so much anticipation for faster, DRAM-less drives in the 4.0 space. You can get high-end performance with great efficiency, and it’s great for laptops, too, especially as it’s single-sided. The denser flash also helps bump up the capacity, which makes the whole package even more attractive if it’s priced right.
Less power usage usually translates to lower temperatures, too. The NM790 peaked below 70C in our testing, well outside the critical temperature range. It should work great in laptops, and getting 4TB without resorting to QLC is a massive win for that segment.
Test Bench and Testing Notes
| CPU | Intel Core i9-12900K |
| Motherboard | Asus ROG Maximus Z790 Hero |
| Memory | 2x16GB G.Skill DDR5-5600 CL28 |
| Graphics | Intel Iris Xe UHD Graphics 770 |
| CPU Cooling | Enermax Aquafusion 240 |
| Case | Cooler Master TD500 Mesh V2 |
| Power Supply | Cooler Master V850 i Gold |
| OS Storage | Sabrent Rocket 4 Plus 2TB |
| Operating System | Windows 11 Pro |
We use an Alder Lake platform with most background applications such as indexing, Windows updates, and anti-virus disabled in the OS to reduce run-to-run variability. Each SSD is prefilled to 50% capacity and tested as a secondary device. Unless noted, we use active cooling for all SSDs.
Bottom Line
The Lexar NM790 is an all-around excellent SSD with little to lament. All-around performance is good to great, including sustained performance, and it achieves this with excellent efficiency. This DRAM-less, 4-channel design rivals the best PCIe 4.0 drives while taking less power to do it. This means it runs cooler, too, and the single-sided design - even at 4TB - makes it excellent for any machine. It’s a particularly good alternative to QLC drives at 2TB and especially 4TB, and the pricing on the latter will make it and similar drives incredibly popular options. For top performance, the 4TB WD Black SN850X is still the way to go with the SK hynix Platinum P41/Solidigm P44 Pro lacking a 4TB option, although Samsung has that on the way for the 990 Pro.
The consumer SSD market has been consumed by ongoing price drops, making it difficult to make solid pricing projections. Some drives we’ve reviewed this year in which we complained about MSRP are already selling for half or less the initial price. There’s a lot of competition, so while it seems the NM790 is always an easy pick, the reality is there are some areas where it’s a particularly good value. This is at 4TB, where it’s difficult to find a drive of this caliber at current pricing. One alternative example would be the Silicon Power XS70, which has switched to the problematic InnoGrit IG5236 controller to reach 4TB less expensively. That controller has had some issues, particularly with YMTC’s TLC.
That experience helps underline the importance of hardware consistency as a trade-off for inexpensive capacity. The NM790 is in the same boat as the MAP1602, and YMTC’s 232-Layer flash is not as well-tested as Phison’s E18 and Micron’s 176-Layer TLC. There’s bound to be trepidation, not least because other, lesser brands - including no-names - are using the same hardware. Some caution is warranted, but Lexar is one of the more reliable choices. We would still suggest the SN850X, Platinum P41/P44 Pro, or 990 Pro at 1TB and 2TB if you're looking for top performance and willing to pay a premium. At 4TB, the NM790 is in a very good place, although we can easily recommend it at any capacity if you're looking for an affordable drive.
MORE: Best SSDs
MORE: Best External SSDs and Hard Drives
MORE: How We Test HDDs And SSDs
MORE: All SSD Content