Quiet Gaming Cases, Part 3: Lian Li, Nanoxia, And SilverStone
Part three of our quest for quiet gaming brings us three final enclosures from Lian Li, Nanoxia, and SilverStone. Have we finally found the perfect product to silence a noisy graphics card? We’ll find out by comparing all nine contenders in today's piece.
Heat, Noise, And Heat Versus Noise
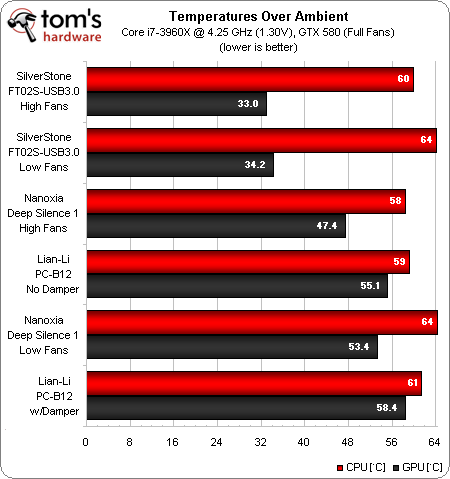
SilverStone’s Fortress 2 USB 3.0 tops our thermal performance chart as the coolest-running solution, due entirely to its excellent graphics cooling. On the other hand, it also exhibits fairly high CPU temperatures. Since heat pipes are designed to operate in a normally-oriented tower, SilverStone causes the heat pipes of most CPU coolers to behave differently by rotating the motherboard and CPU cooler 90°, while at the same time improving just about every other thermal condition.
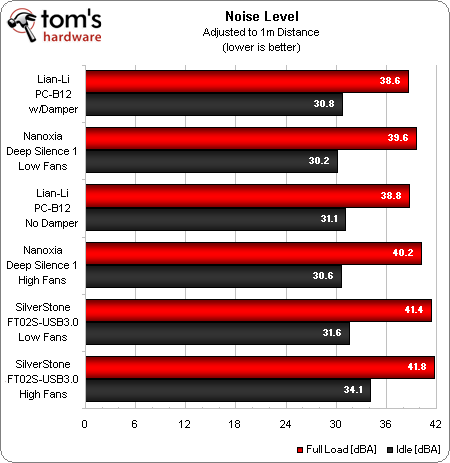
The warmest cases in the above chart are revealed to be some of the quietest in the chart below. SilverStone’s cool-running FT02S-USB3.0 barely stays within our 42 dB(A) quiet case cutoff. We blame the orientation of the motherboard on this one. The top-venting GPU exhaust is much closer to our meter than the rear-vented exhaust of normally-oriented cases.
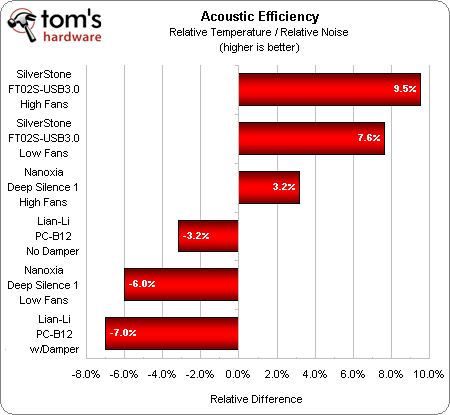
The first step in comparing temperature to noise is to turn a lower temperature result into a higher score. To begin, we average the temperature reading of all cases, and divide that number by each case’s average temperature to produce an inverse percentage-based thermal performance scale. Each case’s average noise level is then divided by the average for all cases, creating a direct percentage-based acoustic performance scale.
The term Relative in the Acoustic Efficiency chart refers to how each case relates, percentage-wise, to the class average of 100% efficiency. Since efficiencies greater than 100% are impossible, we simply move the baseline class average to 0% by subtracting the number 1 from each result.
Although it barely ducks in under our quiet case limits, the FT02S-USB3.0’s temperatures are low enough to put it on top of our heat-to-noise comparison.
Get Tom's Hardware's best news and in-depth reviews, straight to your inbox.
Current page: Heat, Noise, And Heat Versus Noise
Prev Page Test Settings Next Page Quality And Value: Part 3 Cases, Analyzed-
e56imfg Reply
Newegg e-mailed me saying that the Nanoxia DS1 ETA is 1/3010447762 said:Where to buy the Silencio 650 or the Nanoxia Deep Silence ? -
abbadon_34 I never ceased to amazed by these beastly cases from Silverstone. Before I die I hope to toss down $300 for some monster.Reply -
johnsonjohnson e56imfgNewegg e-mailed me saying that the Nanoxia DS1 ETA is 1/30Reply
Thanks for that; I was wondering when it would arrive. -
My brother has the older FT02B with the red inside and I have the P280. I'm super happy to see how these cases performedReply
He is running dual AMD 5850's with axial fans and a Corsair H50 water cooler cooling an AMD 8150, it's very quiet even at full fan.
In my P280 I have a OC Intel i7-3770k with an Antec 920 water cooler and 2 scythe 2k rpm fans, with the scythe at full power and the 920 on aggressive thermal settings it keeps he 4.7ghz oc under 50 deg c under almost all loads while not being excessively loud. -
Onus The Define R4 appears to be lacking a HDD activity LED; baffling. Those who don't like it wouldn't have to use it, but what about those who do?Reply
It would be interesting to repeat the tests with an axially-cooled graphics card. After all, that style of cooler would be the choice of someone building for low noise. Of particular interest would be the resulting temperature differences, especially of the Silverstone.
-
1369ic I ordered an R4 yesterday before finding these articles and was happy to see it get the approved award. Now it wins a recommended buy award and UPS tells me it's on the truck to be delivered today. First time in my life I've had such luck. I am replacing an aging Antec P180, and almost got the 280, but went with the R4 because I liked the look better -- and it's currently $80 with free shipping on Newegg.Reply -
cknobman As nice as the Fractal R4 is I still would go with my Antec P280 case especially considering after discounts I picked it up for only $80.Reply
Toms, thanks for doing this series it was really nice to see the time and in depth detail put into this. I will be bookmarking these for reference on my future builds. -
Au_equus 1369icI ordered an R4 yesterday before finding these articles and was happy to see it get the approved award. Now it wins a recommended buy award and UPS tells me it's on the truck to be delivered today. First time in my life I've had such luck. I am replacing an aging Antec P180, and almost got the 280, but went with the R4 because I liked the look better -- and it's currently $80 with free shipping on Newegg.Half finished building with it last night. Once you get th R4, you can tell that a lot of thought went into building this case. I'm still a novice when it comes to cable management, but FD makes it real easy. For $80, IMO, you're getting a steal.Reply -
tripkick Is there any chance that you could review the NZXT H2 in the future? I was hoping to see it on your review list and how it compares to the R4. I am looking to upgrade my old Antec P180 and wondered how those two cases stack up against the P180 and its newer version P183.Reply


