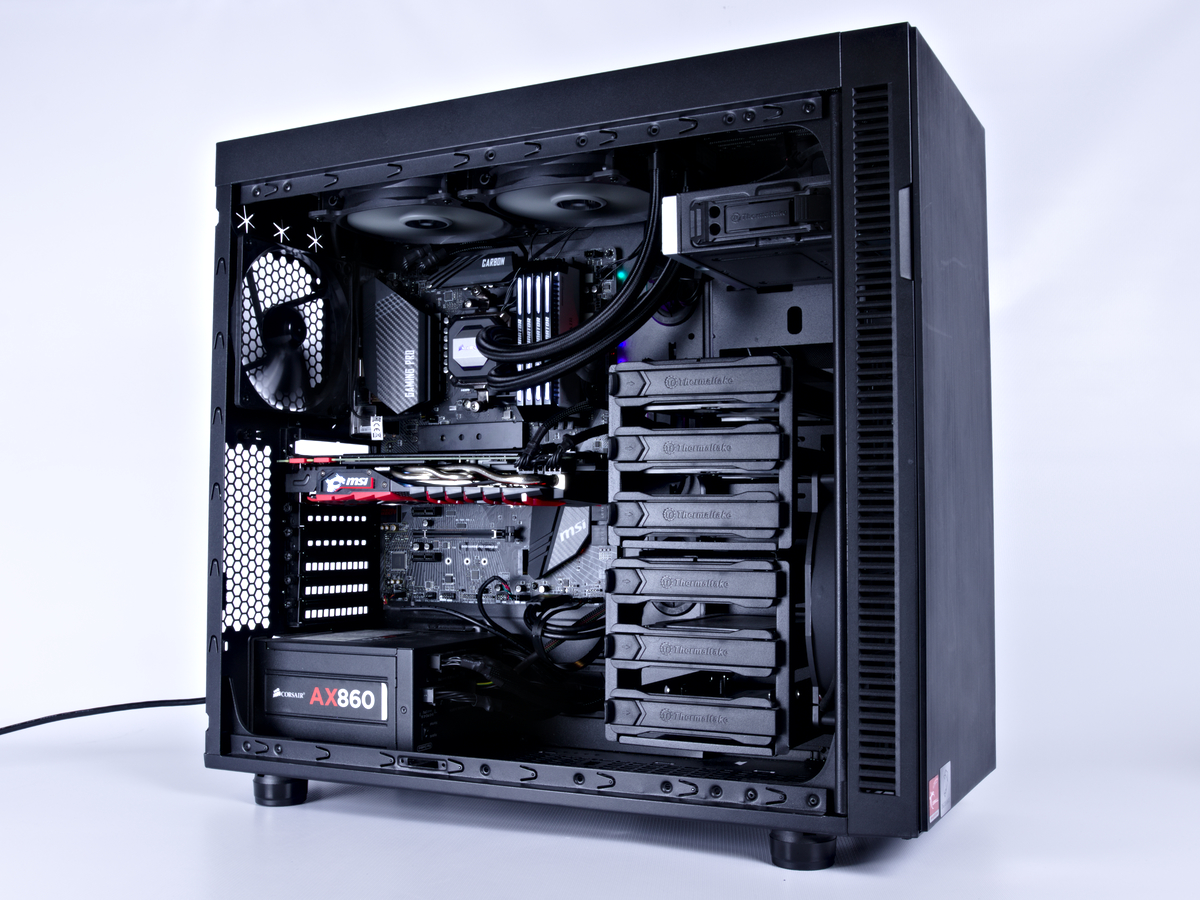
MSI B450 Gaming Pro Carbon AC: Mixed Mid-Range Impressions
Why you can trust Tom's Hardware
Test Configuration and Benchmarks
Test Configuration
| Benchmark Settings | |
| Synthetic Benchmarks and Settings | Row 1 - Cell 1 |
| PCMark 8 | Version 2.7.613Home, Work, Storage, Applications (Adobe & Microsoft) |
| SiSoftware Sandra | Version 2016.03.22.21CPU Arithmetic, Multimedia, CryptographyMemory Bandwidth |
| IOmeter | 4k Random Read, 4k Random Write128k Sequential Read, 128k Sequential Write |
| Cinebench R15 | Build RC83328DEMOOpenGL Benchmark |
| CompuBench | Version 1.5.8Face Detection, Optical Flow, Ocean Surface, Ray Tracing |
| 3D Tests ansd Settings | Row 7 - Cell 1 |
| 3DMark 13 | Version 4.47.597.0Test Set 1: Skydiver, 1920x1080, Default PresetTest Set 2: Firestrike, 1920x1080, Default PresetTest Set 3: Firestrike Extreme, 2560x1440 Default Preset |
| Application Tests and Settings | Row 9 - Cell 1 |
| HandBrake CLI | Version: 0.9.9Sintel Open Movie Project4.19 GB 4k mkv to x265 mp4 |
| LAME MP3 | Version 3.98.3Mixed 271MB WAV to mp3Command: -b 160 --nores (160 Kb/s) |
| Adobe After Effects CC | Release 2015.3.0Version 13.8.0.144PCMark driven routine |
| Adobe Photoshop CC | Release 2015.5.020160603.r.88 x64PCMark driven routine (light and heavy) |
| Adobe InDesign CC | Release 2015.4Build 11.4.0.90 x64PCMark driven routine |
| Adobe Illustrator | Release 2015.3.0Version 20.0.0 (64-bit)PCMark driven routine |
| Blender | Version 2.68aBMW 27 CPU Render BenchmarkBMW 27 GPU Render Benchmark |
| 7-Zip | Version 16.02THG-Workload (7.6 GB) to .7z, command line switches "a -t7z -r -m0=LZMA2 -mx=9" |
| Game Tests and Settings | Row 18 - Cell 1 |
| Ashes of Singularity: Escalation | Version 2.50.28527High Preset - 1920x1080, Mid Shadow Quality, 1x MSAACrazy Preset - 1920x1080, High Shadow Quality, 2x MSAAHigh Preset - 3840x2160, Mid Shadow Quality, 1x MSAACrazy Preset -3840x2160, High Shadow Quality, 2x MSAA |
| F1 2015* | 2015 Season, Abu Dhabi Track, Rain1920x1080 - UltraHigh Preset, 16x AF3840x2160 - UltraHigh Preset, 16x AF |
| Metro Last Light Redux | Version 3.00 x64High Quality, 1920x1080, High TesselationVery High Quality, 1920x1080, Very High TesselationHigh Quality, 3840x2160, High TesselationVery High Quality, 3840x2160, Very High Tesselation |
| The Talos Principle | Version 2672521920x1080 - Medium Preset, High Quality, High Tesselation, 4x AF1920x1080 - Ultra Preset, VeryHigh Quality, VeryHigh Tesselation, 16x AF3840x2160 - Medium Preset, High Quality, High Tesselation, 4x AF3840x2160 - Ultra Preset, VeryHigh Quality, VeryHigh Tesselation, 16x AF |
Being on the edge of two different build segments, we’ve chosen a mix of boards for comparing the B450 Gaming Pro Carbon AC. We first present the MSI X470 M7 AC as a control for our testing to show what a top-shelf X470 board is equipped to do and how it performs. The “lower” top-tier Asus X470-TUF Gaming steps up to the plate since its cost savings got it the value win in previous articles. Lastly, the Gigabyte B450 Aorus Pro WIFI was a great performer on our testbench during the initial B450 launch, so we want to see how a similarly specced B450 board compares head-to-head.
Synthetics, Applications, Gaming and Overall Performance
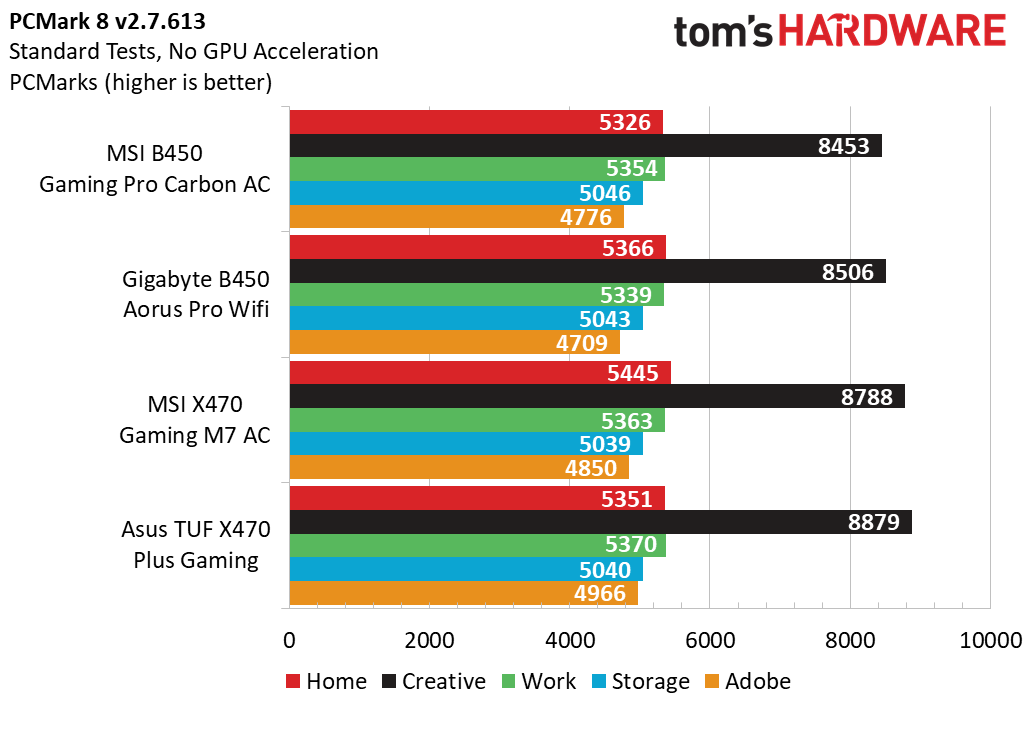
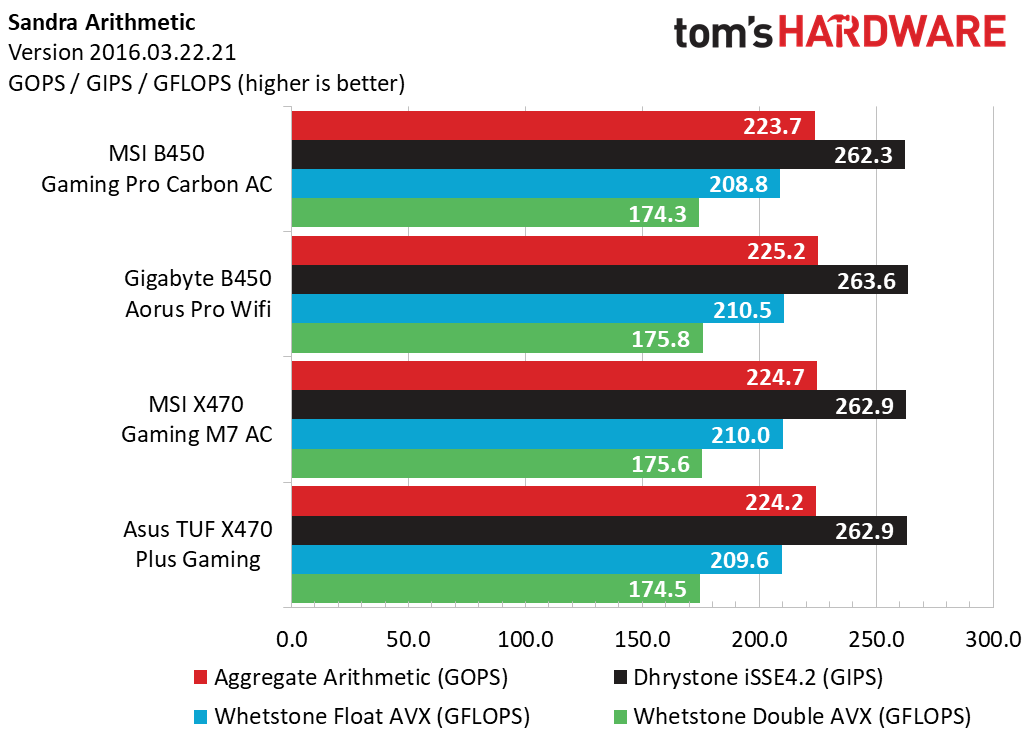
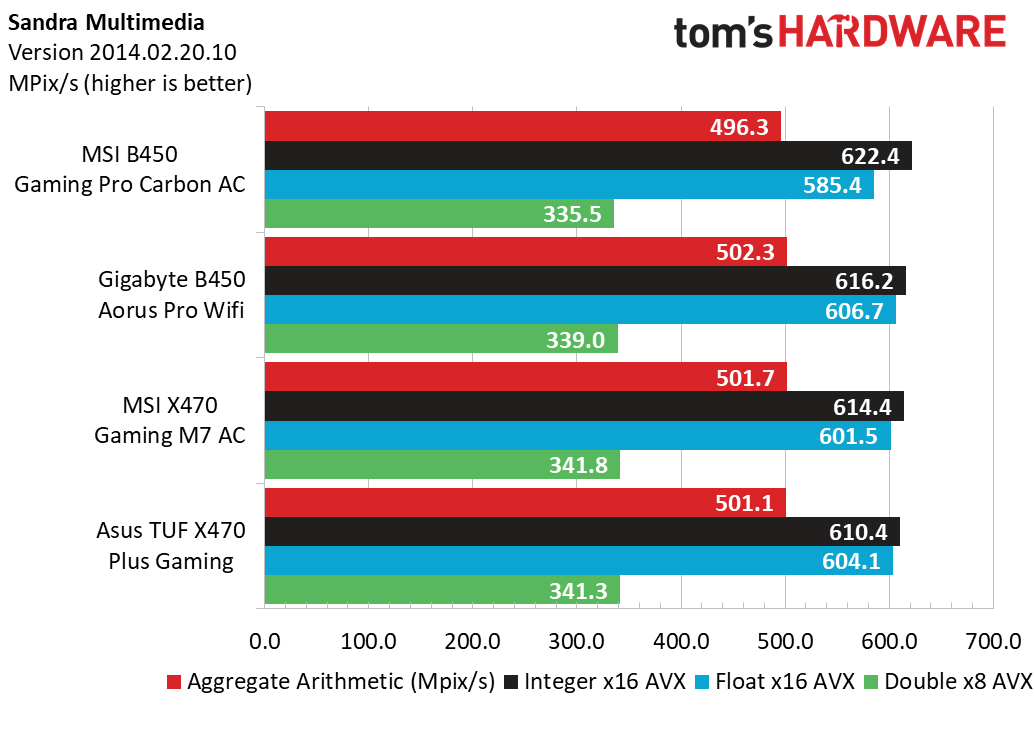
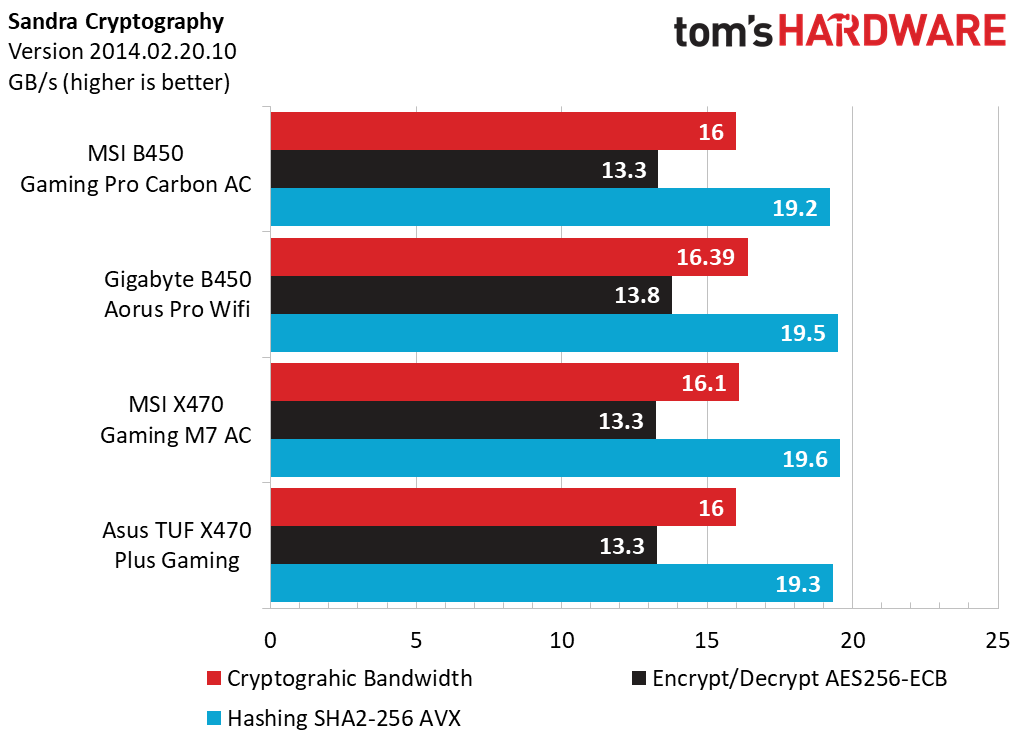
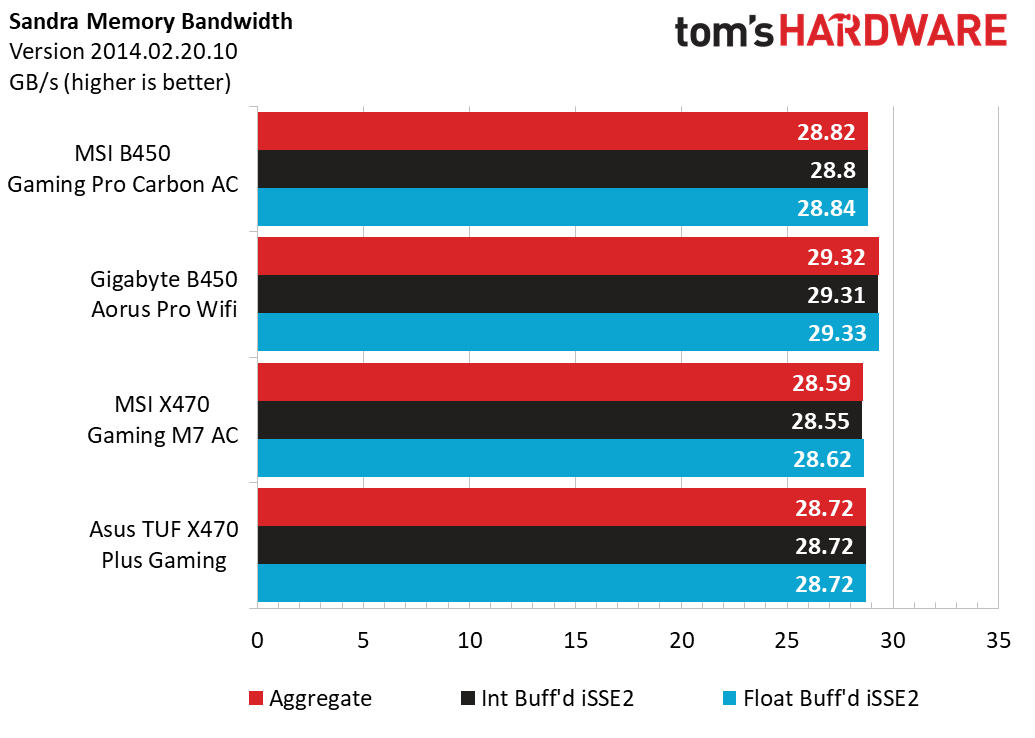
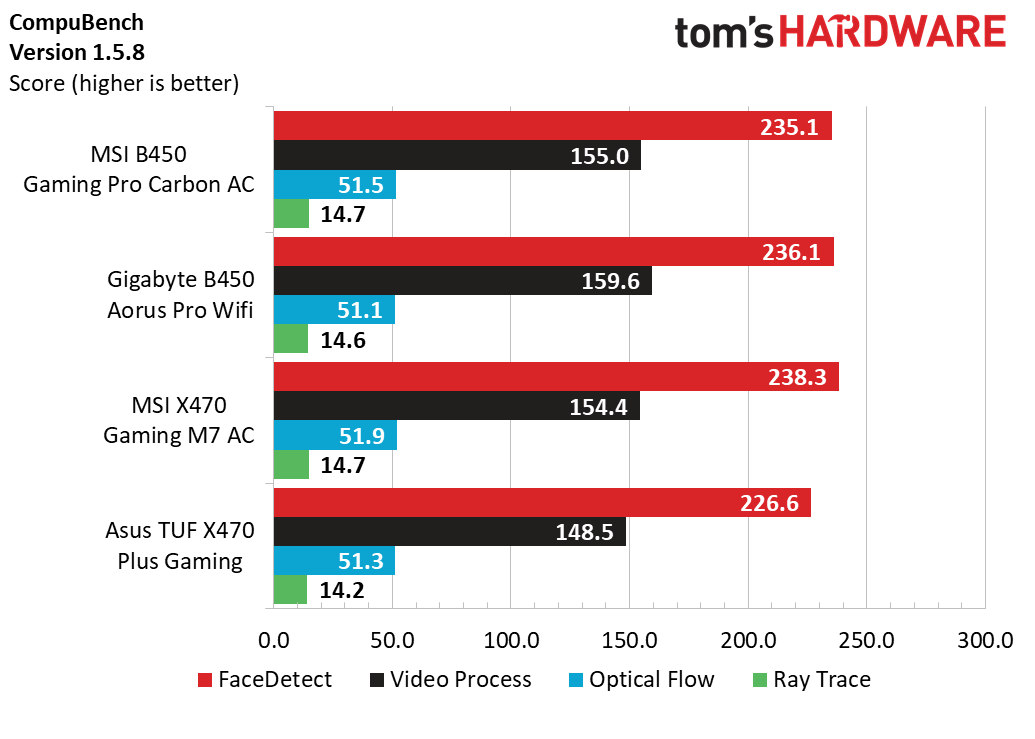
All products in review today saw our Ryzen 7 2700X and memory clocked at DDR4-2400 out of the box, so synthetic results should be tight and consistent. PCMark shows a lead of nearly 5 percentage points for the Asus X470 TUF Plus in Creative and Adobe workloads, compared to its B450 cousins. Sandra tightens up all these margins, with notable exceptions in Cryptography and Memory Bandwidth favoring the Gigabyte B450 sample.
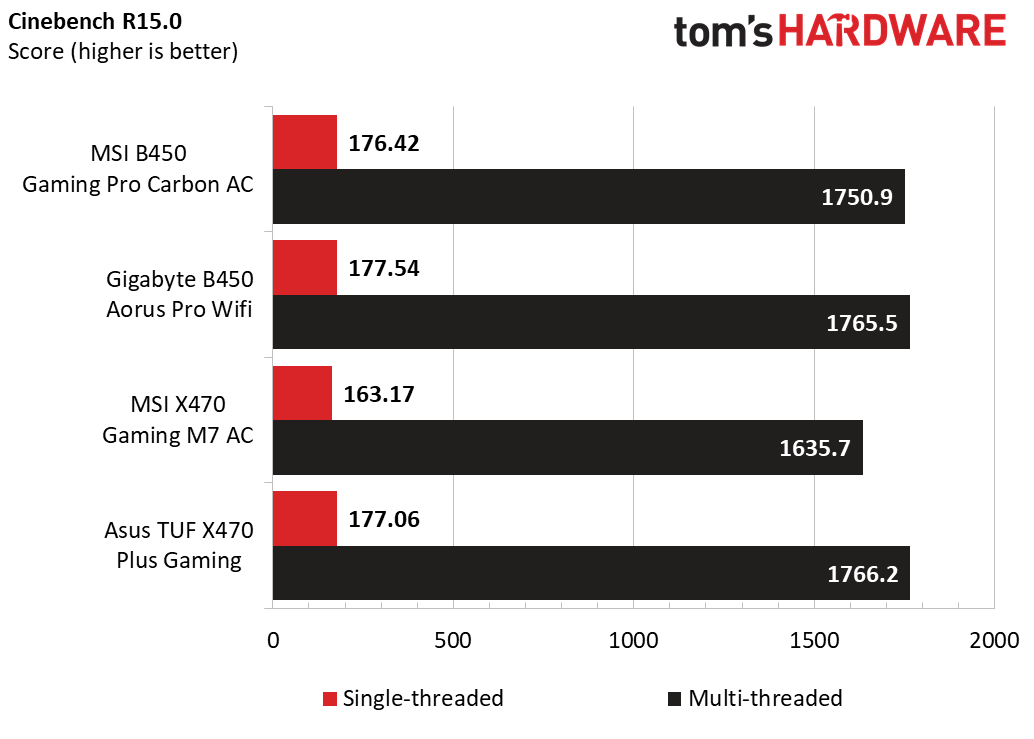
This behavior continues to the Cinebench runs, with the MSI X470 lagging by 7 percentage points to the rest of the pack while the MSI B450 manages to stay in the running with average results. Both MSI boards finally decide to come out of their cages with Compubench, showing positive performance when compared directly to the Asus TUF sample.
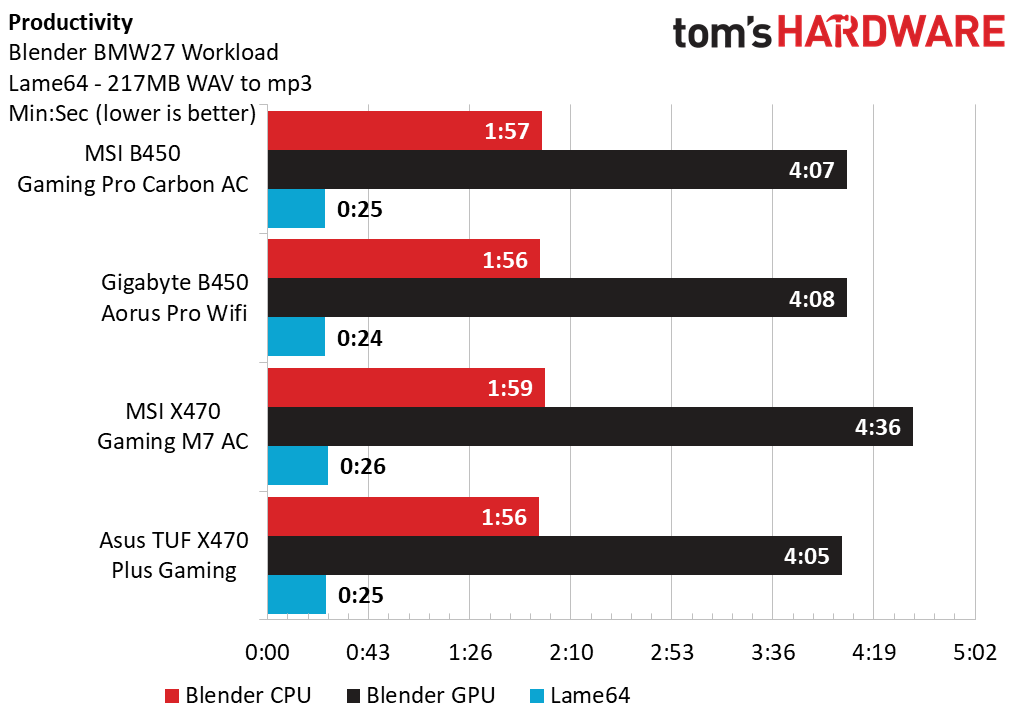
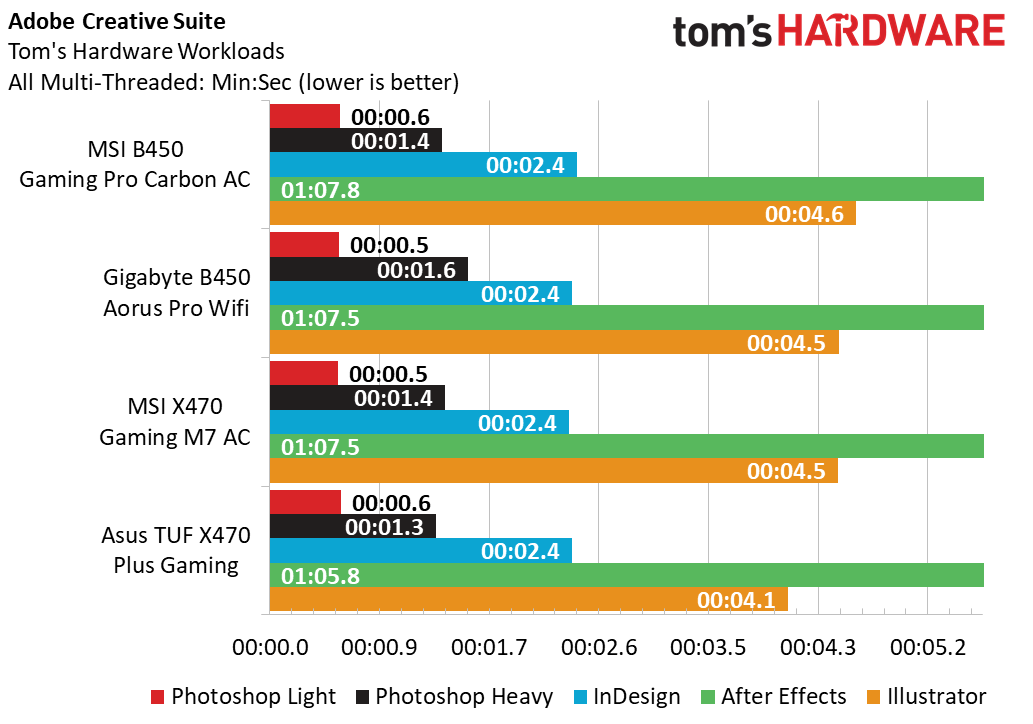
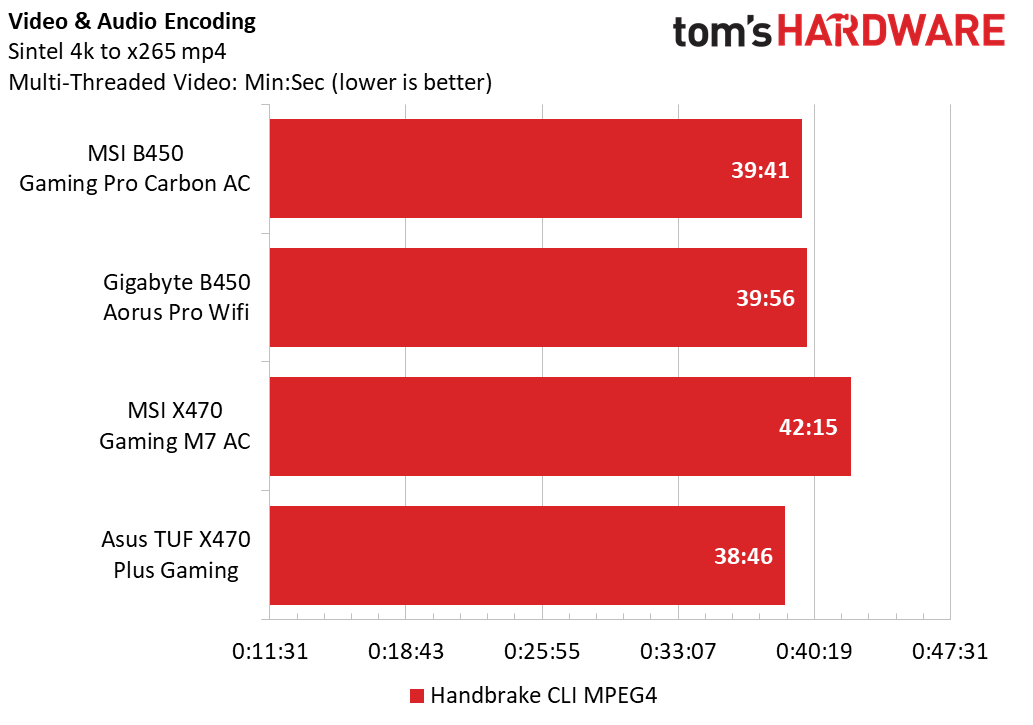
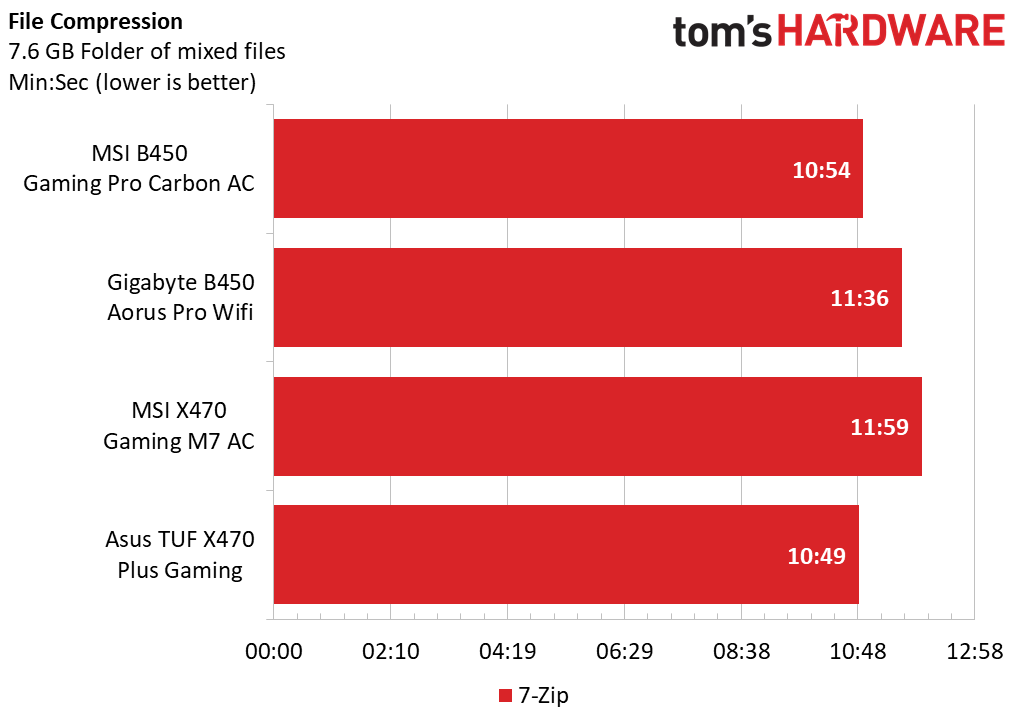
Applications start to show a little bit of extra noise in the system, but the facts remain: The Asus TUF continues to dominate the performance data. The MSI X470 lags behind in several critical benchmarks, including Blender and Handbrake, which represent many content creators’ multi-threaded workloads.
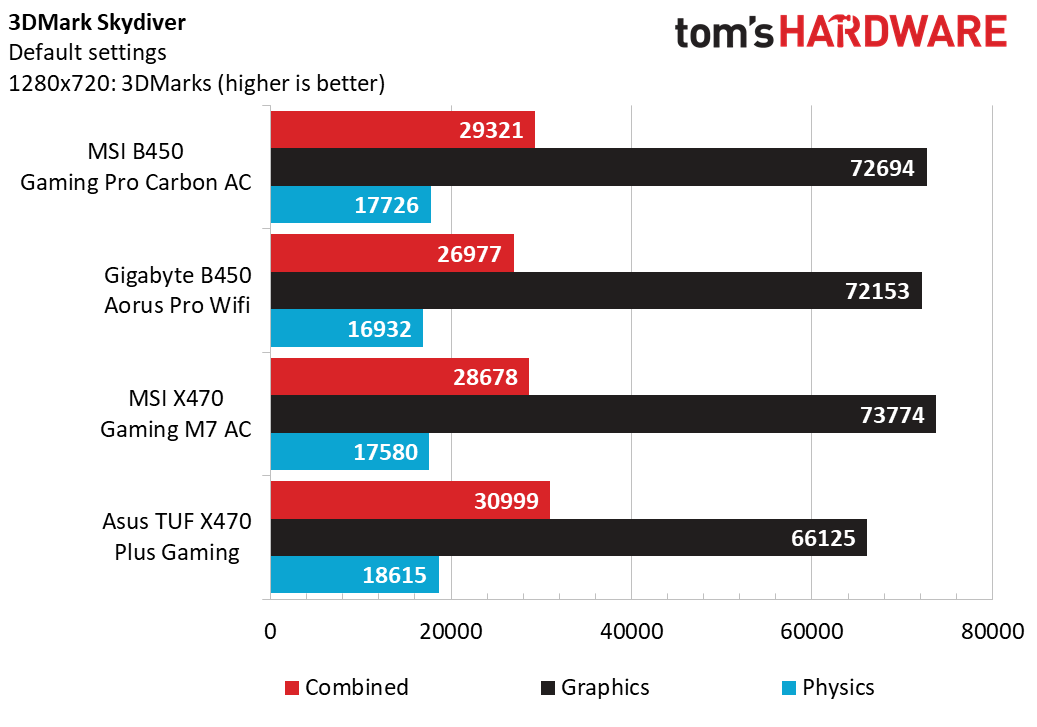
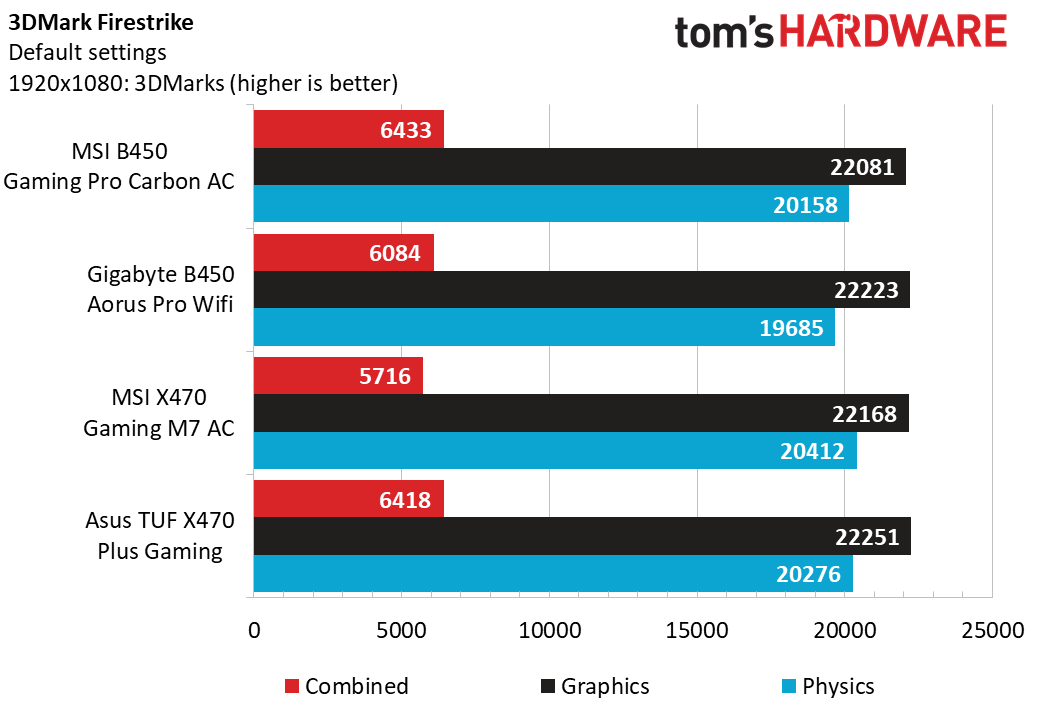
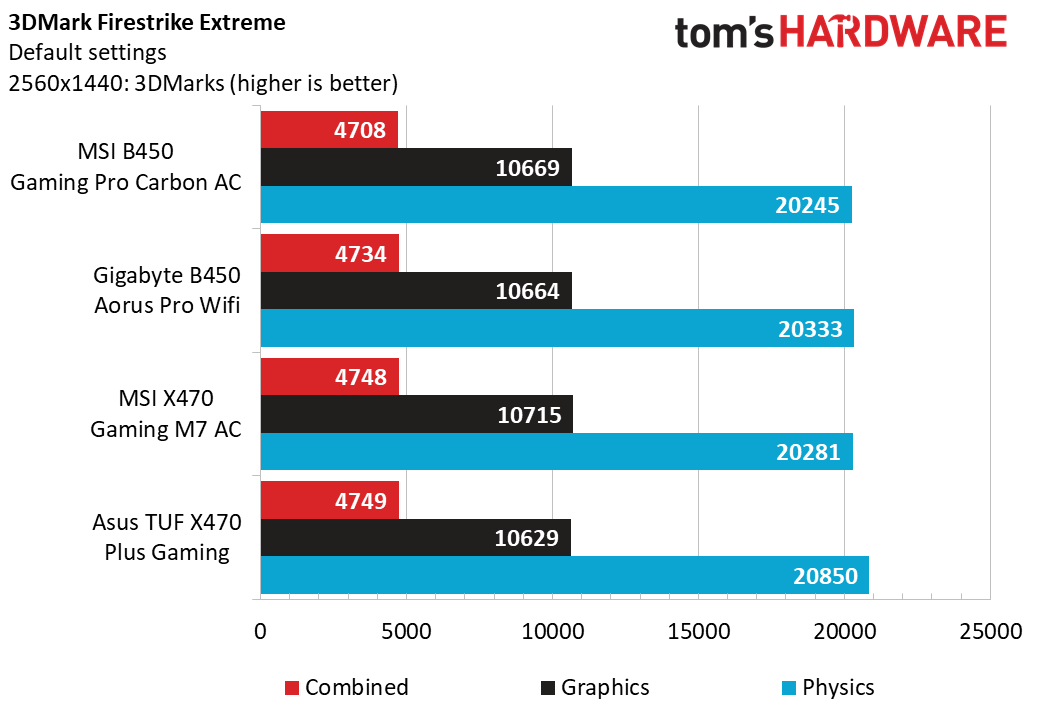
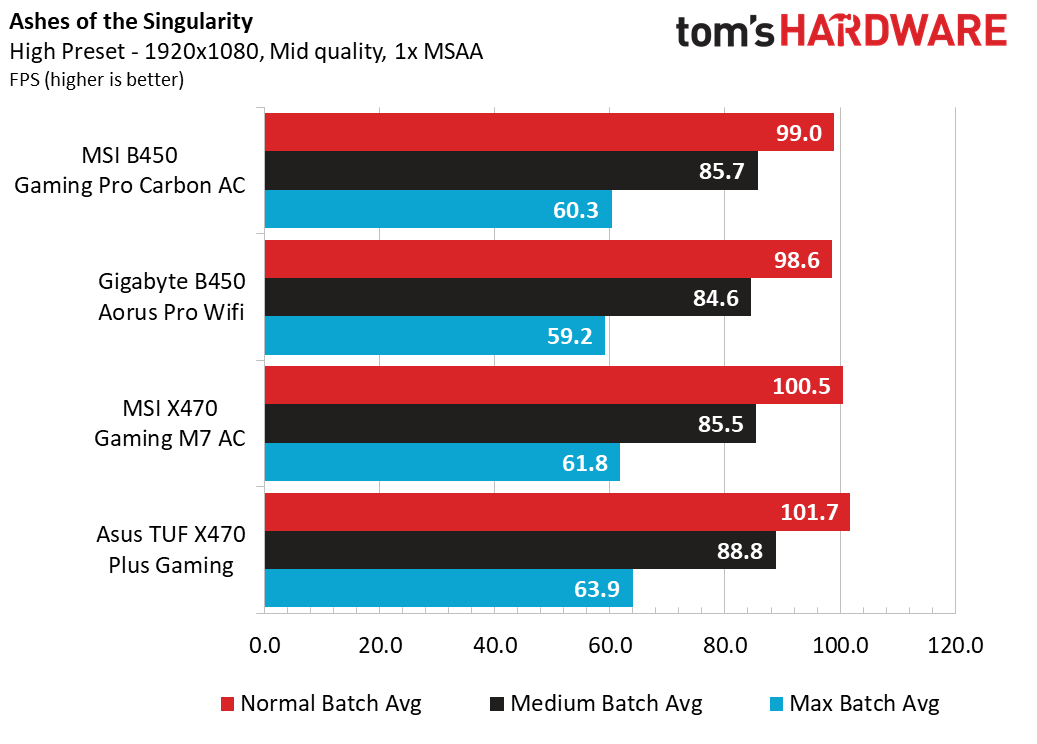
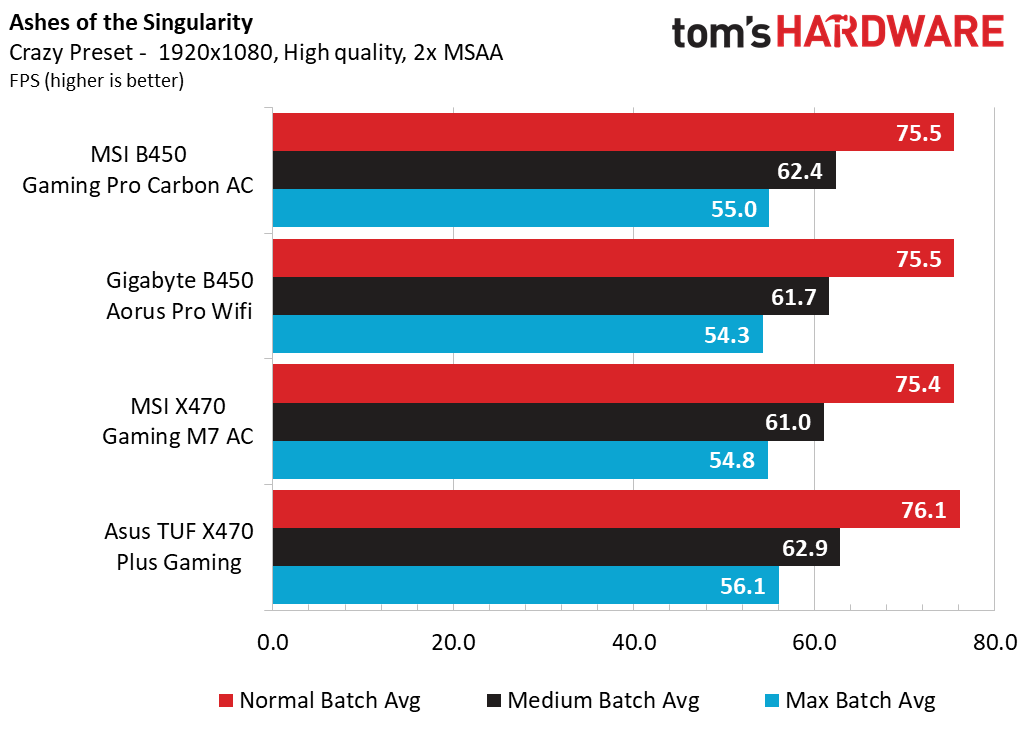
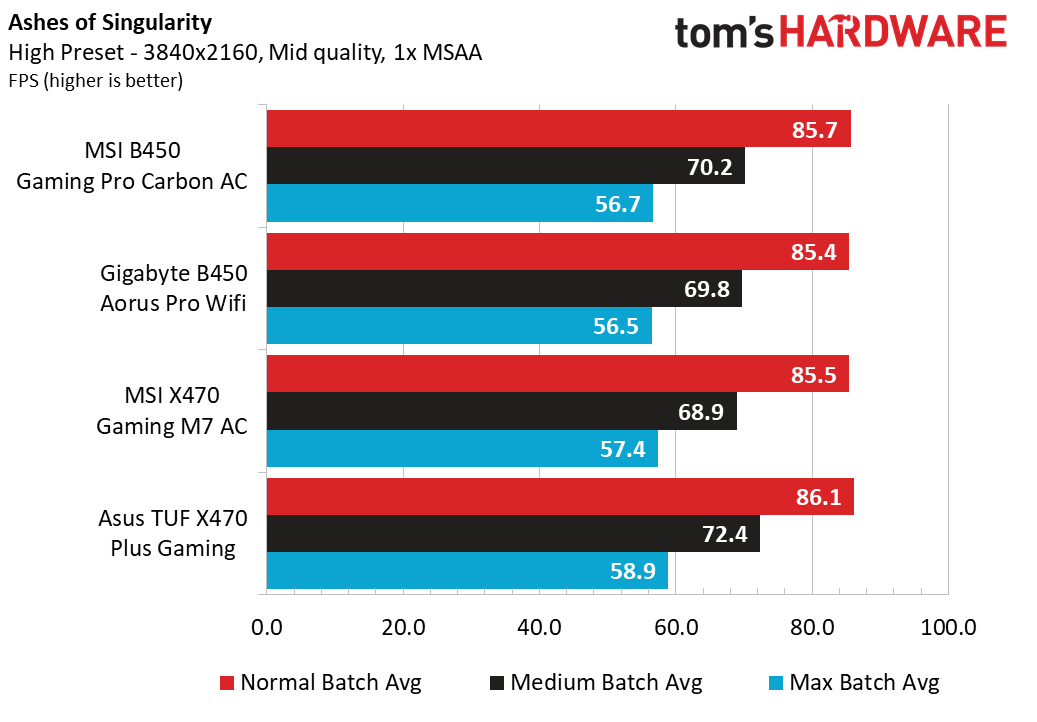
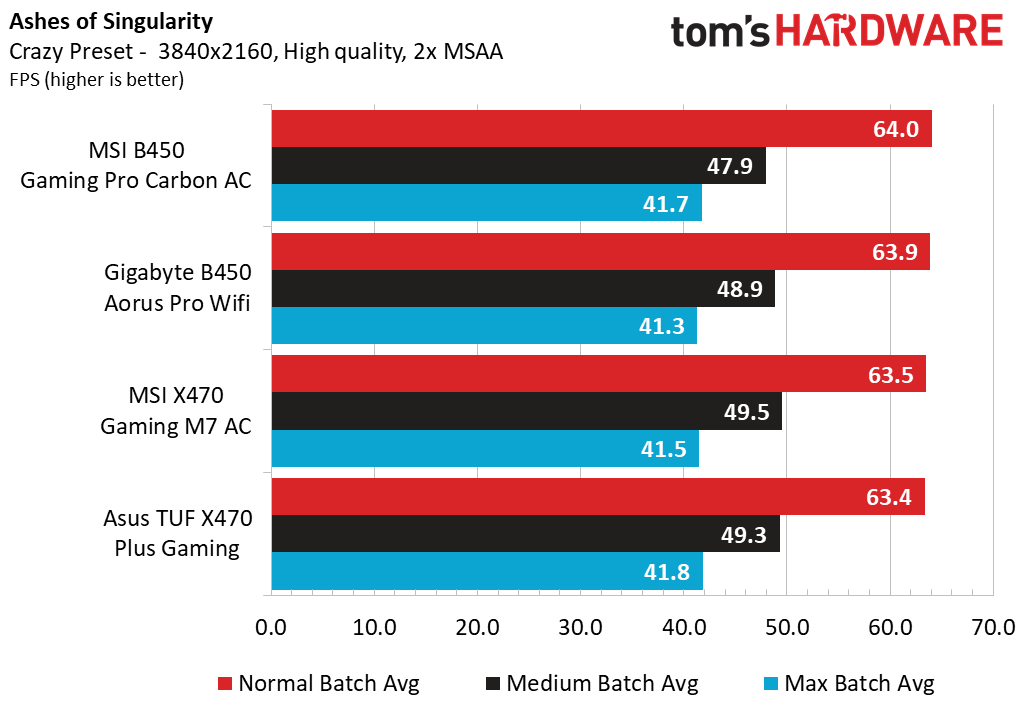
Putting on our gamer hat, the MSI B450 starts to come out of its shell a bit with strong finishes in 3DMark Skydiver and Firestrike. Ashes of the Singularity: Escalation’s built-in benchmark favors processing power and shows a tight field when comparing raw framerates between each of the competitors. A mere 3-frame advantage translates to a 4-percentage point win for the TUF board.
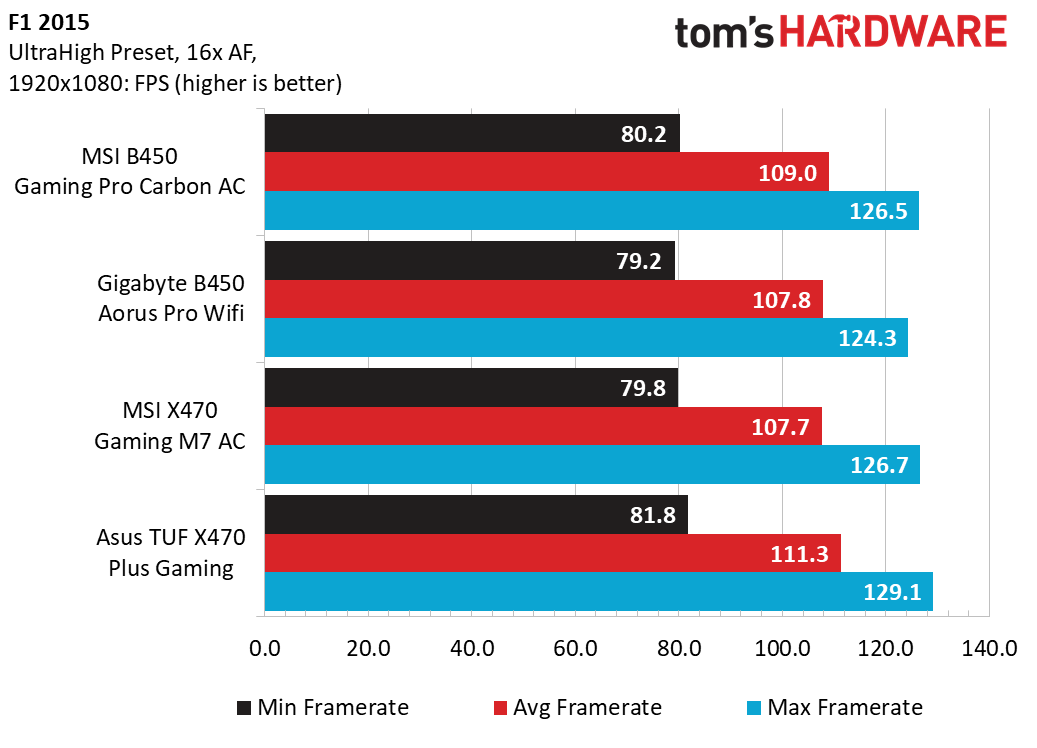
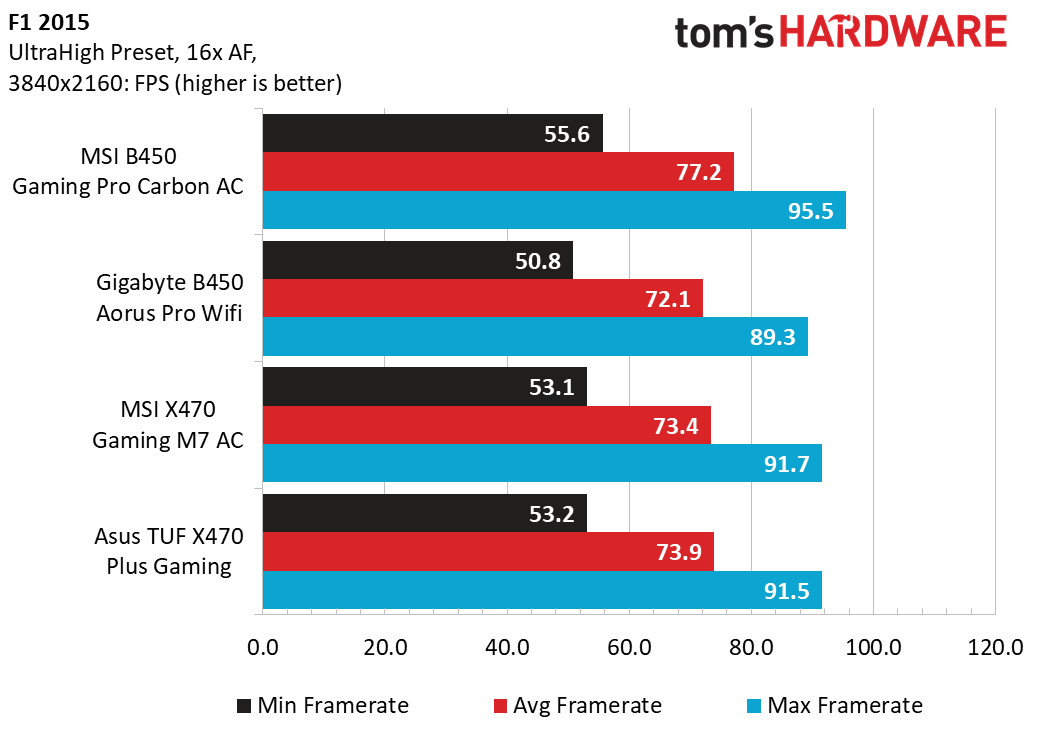
F1 2015 is showing its age, but it still manages to provide enough load and stability for benchmarking purposes. At 1080p, the average framerate gap is a modest 4 frames per second, and the MSI B450 Gaming Pro Carbon AC surges ahead by a sizable 3 frames per second at 4K at the Ultra High preset.
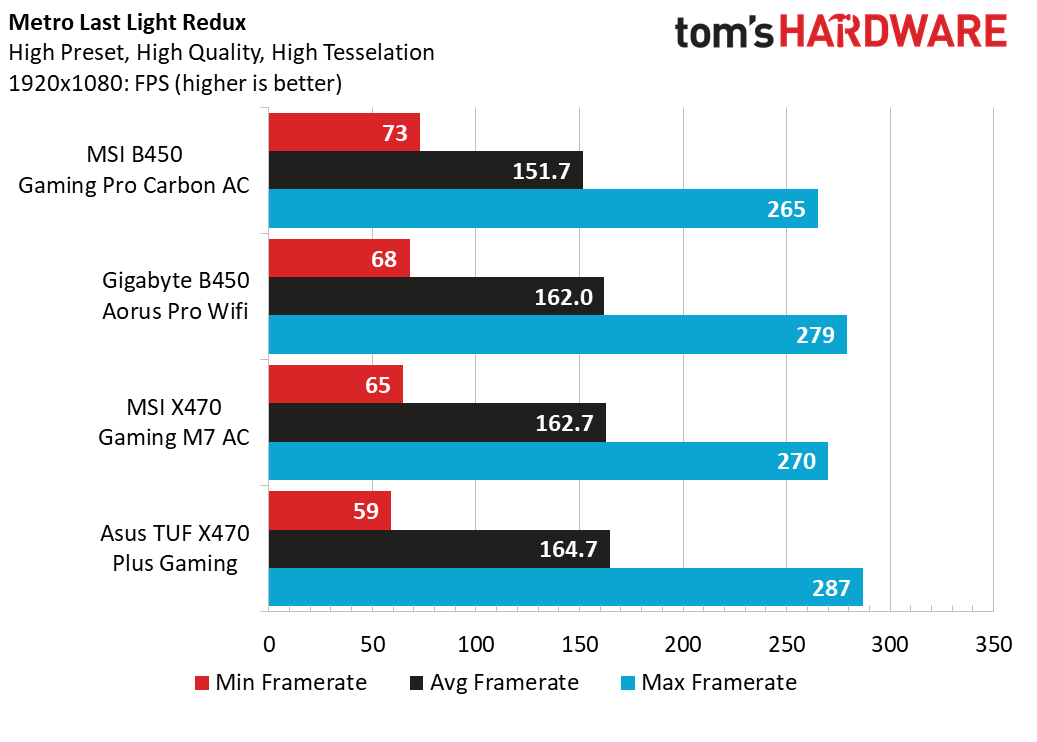
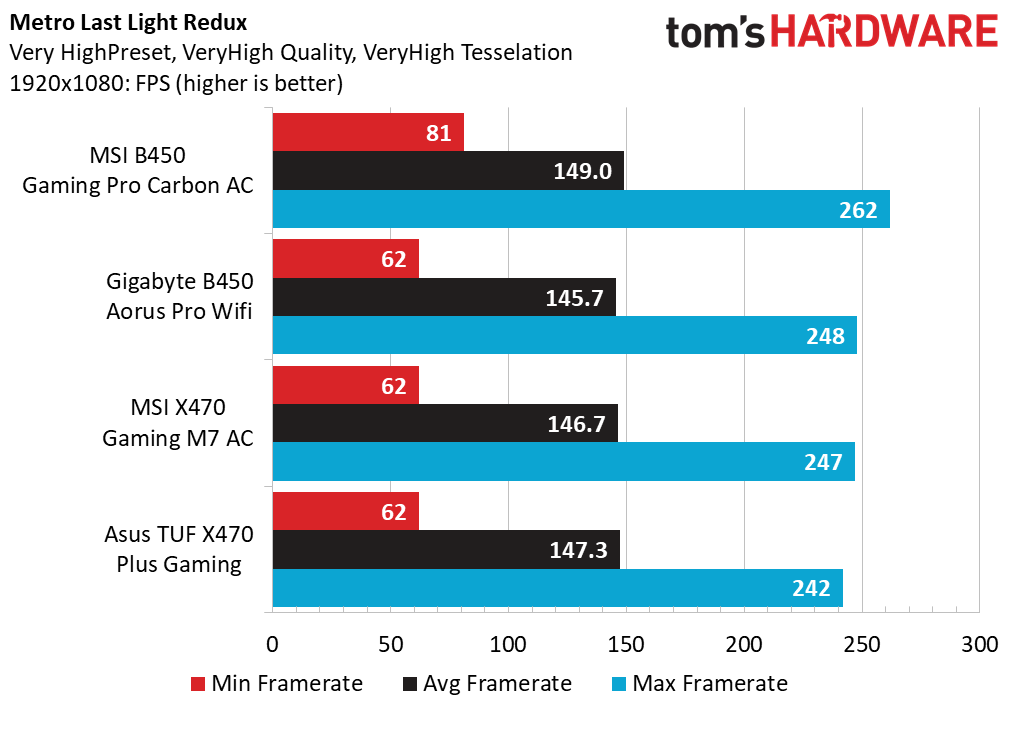
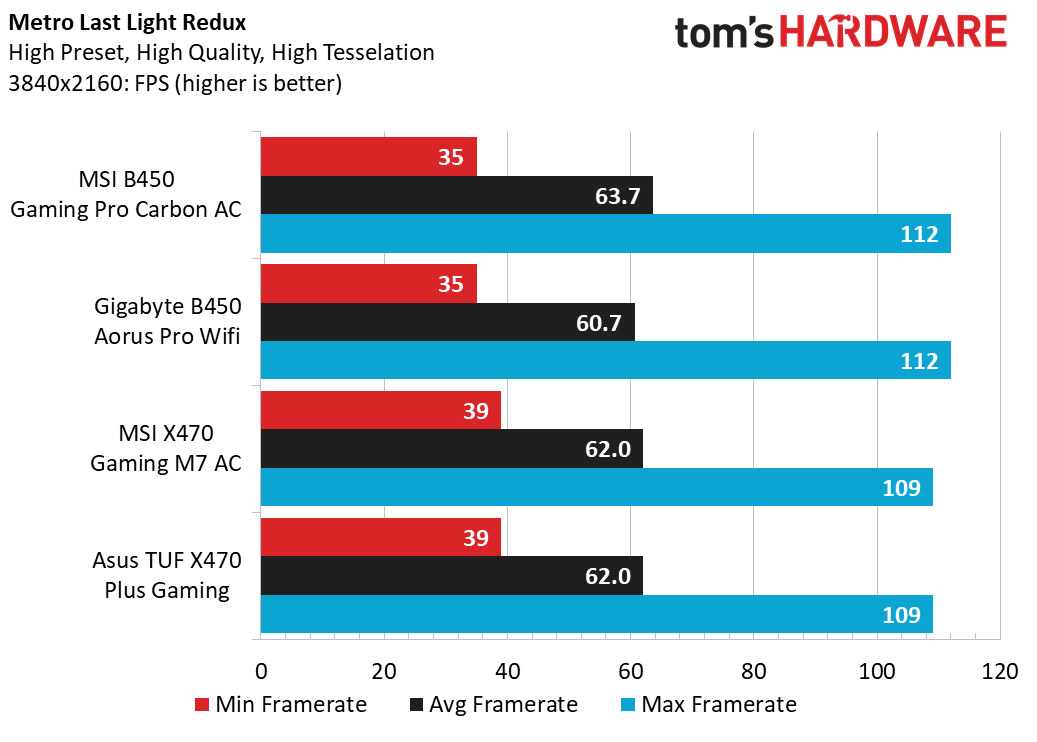
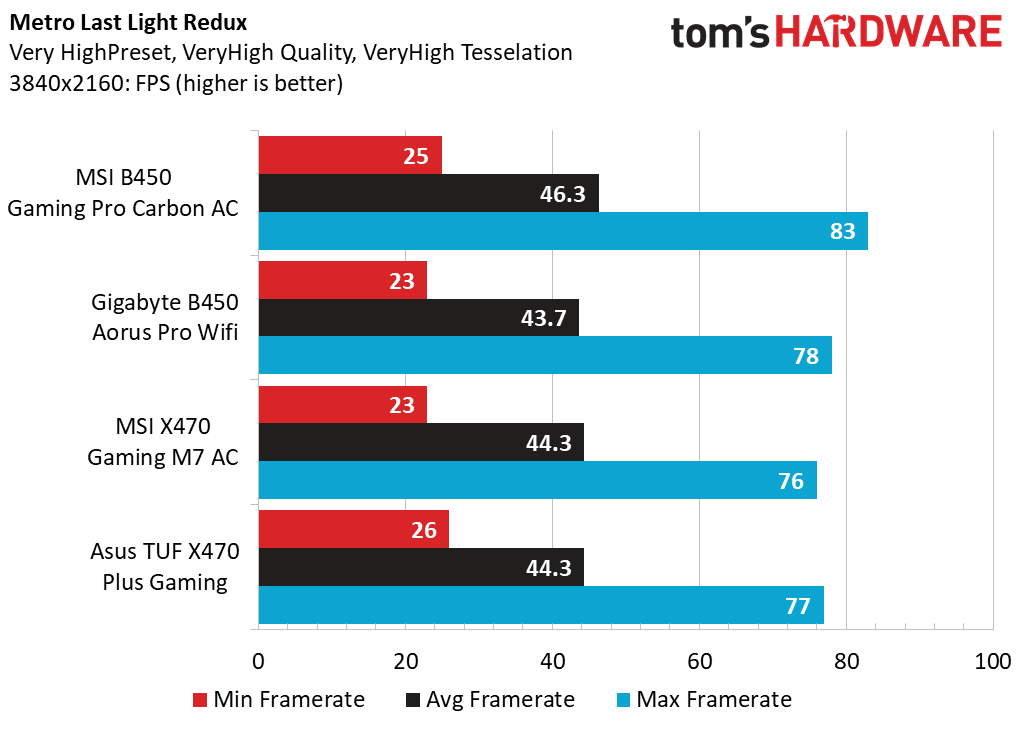
Metro Last Light: Redux’s days are numbered with the Exodus sequel knocking at our train station doorstep. But for our purposes, the built-in benchmark again shows average 1080p performance going in favor of the Asus TUF board, while higher detail settings show the MSI B450 landing slightly ahead. Up the resolution and the same 3 frame-per-second (fps) gap remains while the MSI B450 slips to 3rd and 4th place finishes in that regard.
Get Tom's Hardware's best news and in-depth reviews, straight to your inbox.
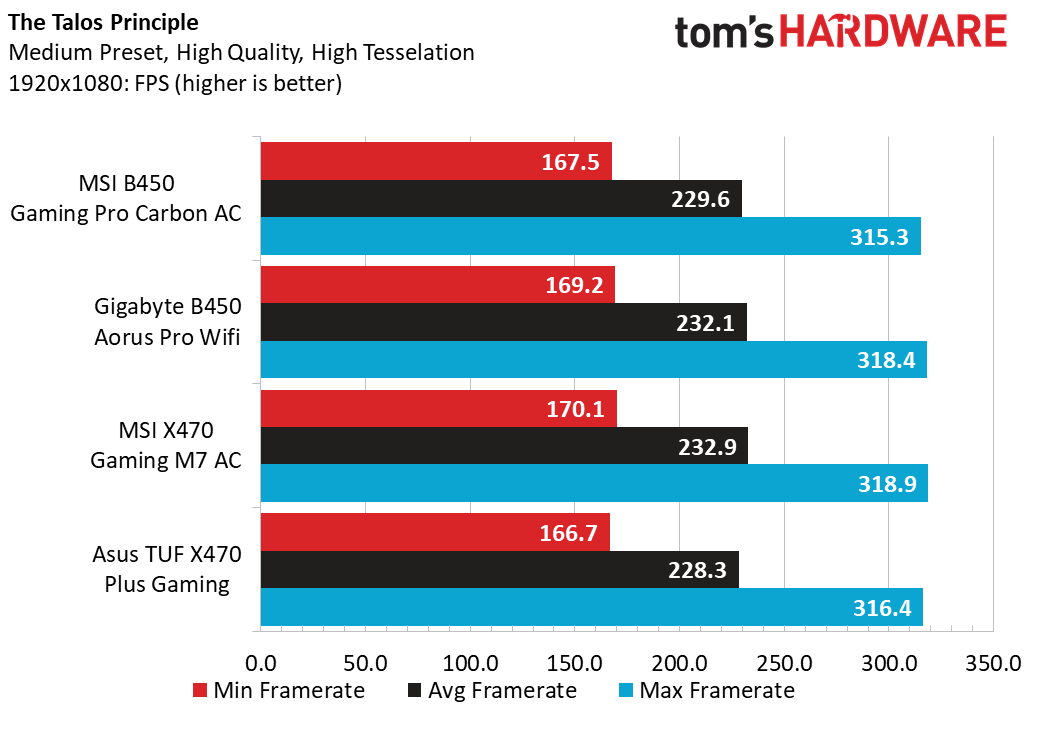
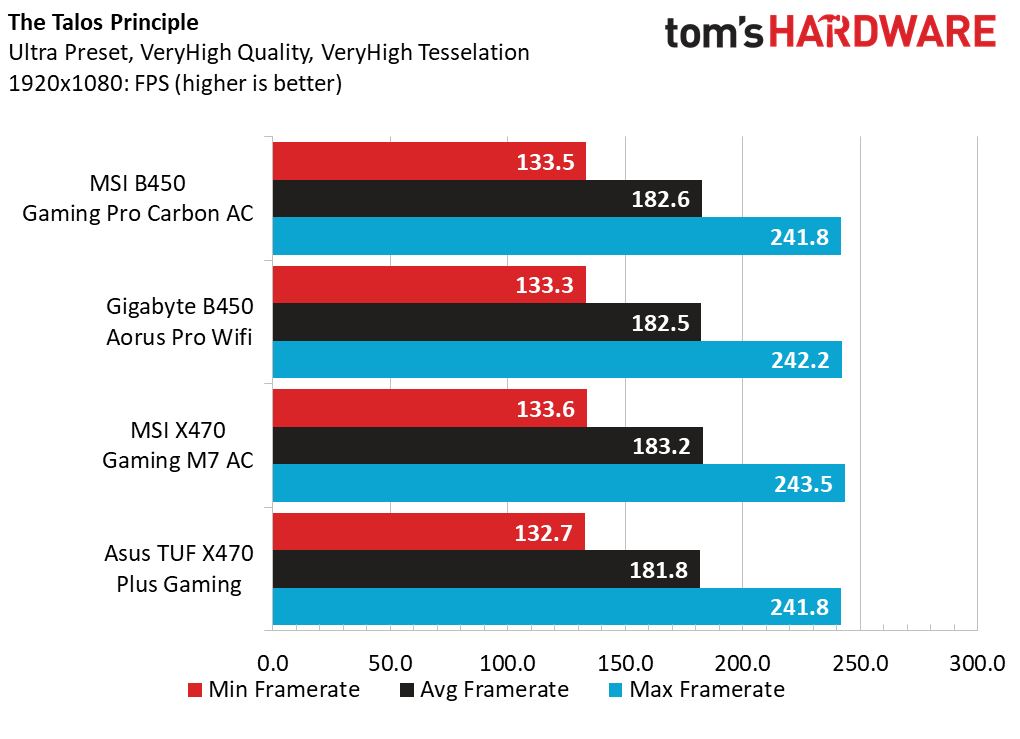
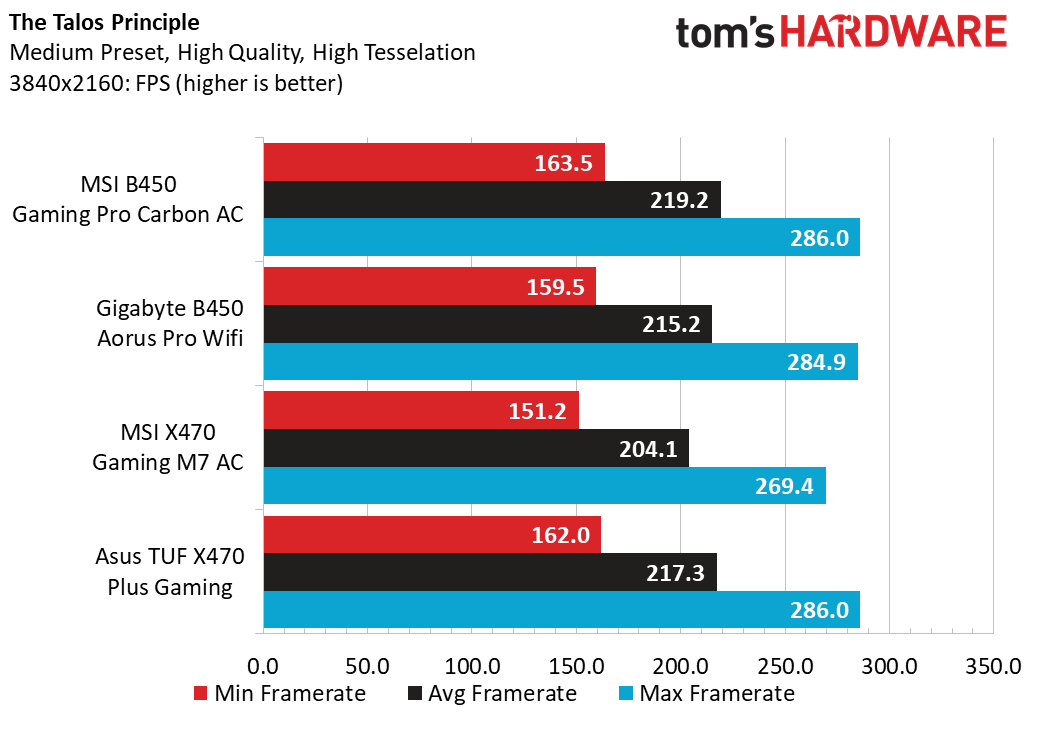
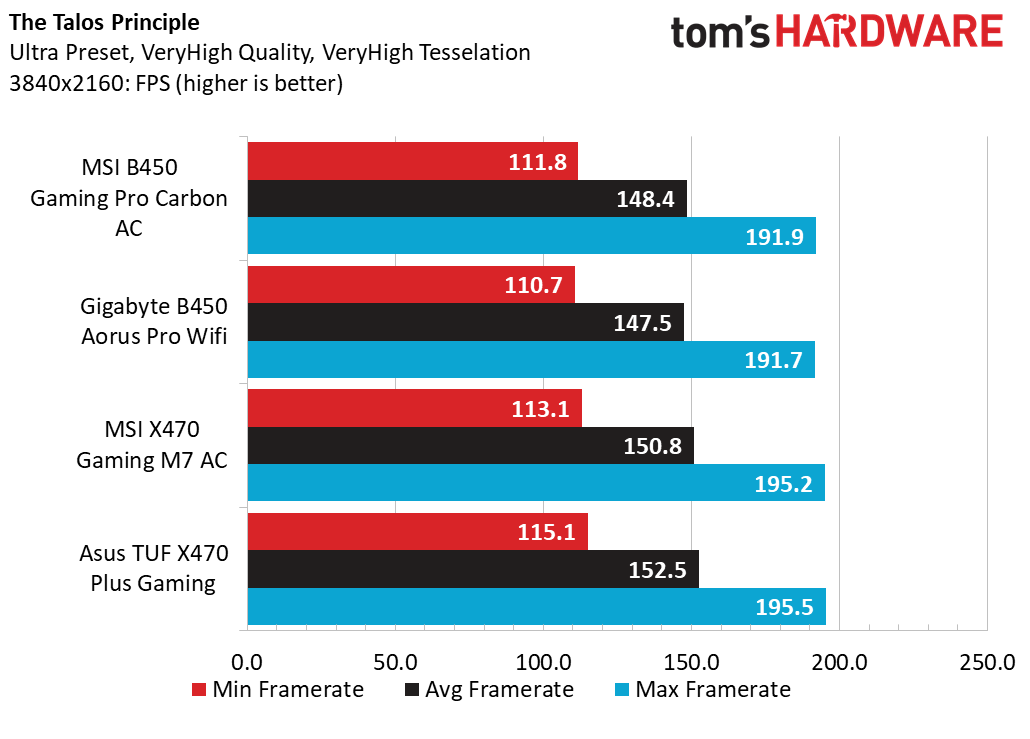
The Talos Principle remains stable for this data set. And again, small frame rate gaps separate all the samples on the bench today, with noteworthy wins for the MSI X470 at 1080p and the MSI B450 coming ahead at 4K & Medium.
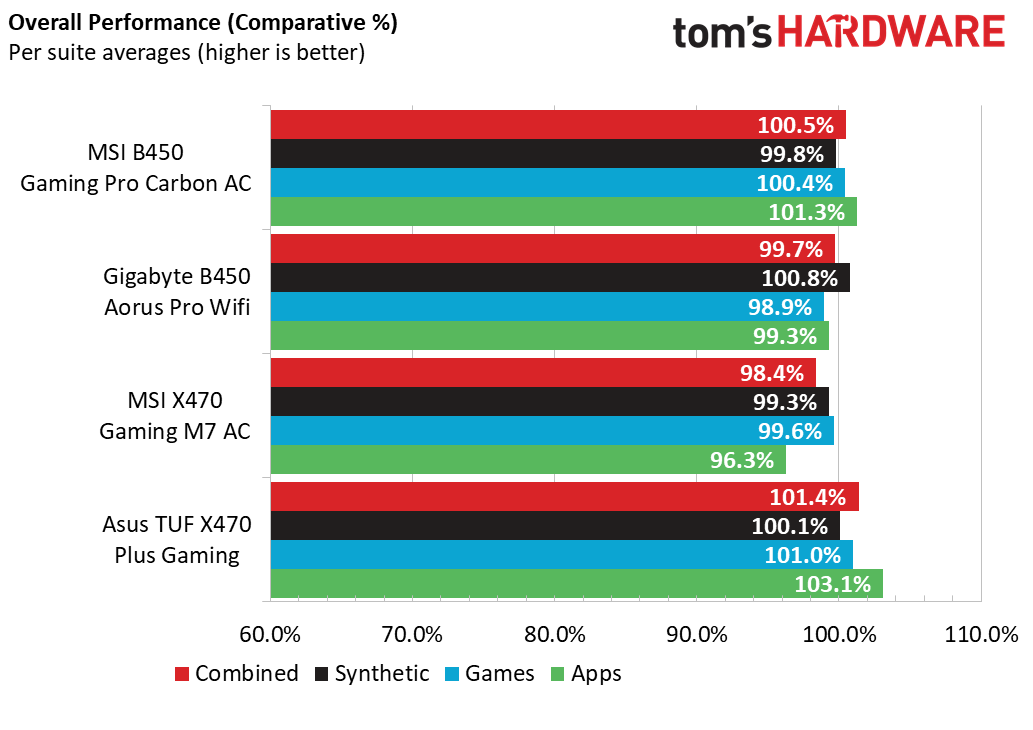
With all of that said, small wins across the whole benchmark suite add up to big wins for the Asus TUF-X470 Plus Gaming. The MSI B450 Gaming Pro Carbon AC manages to score well in three of the suites, while slipping in the Synthetic area. Gigabyte manages to keep up with only a minor 1.1 percent miss on average at games, but the MSI X470 really takes a beating with our Application suite. Again, these differences will be nearly imperceptible to the average user. Any of these boards should Handle the compatible hardware that’s plugged into them accordingly.
MORE: Best Motherboards
MORE: How To Choose A Motherboard
MORE: All Motherboard Content
Current page: Test Configuration and Benchmarks
Prev Page Product Description and UEFI Next Page Power, Thermals and Overclocking