MSI X399 Gaming Pro Carbon AC Motherboard Review
Why you can trust Tom's Hardware
Benchmark Results & Conclusion
For this first X399 review, we have to include some comparison data. We seeded a mysterious challenger that will be covered in our next review.
Synthetic Benchmarks
PCMark is our obligatory first benchmark to examine general purpose performance. We observe our first outdated benchmark in Creator Mode, in that its Creative suite fails to complete. The 4K H.264 application was built with 32-bit addressing and crashes with more than 20 cores enabled. Futuremark states that PCMark 10 fixes this issue, so we look forward to moving to that revision soon. In the Adobe suite, the MSI X399 Gaming Pro Carbon AC performs up to 3% slower in Creative Mode compared to Gaming Mode. This was a likely outcome, given that Adobe CS is lightly threaded.
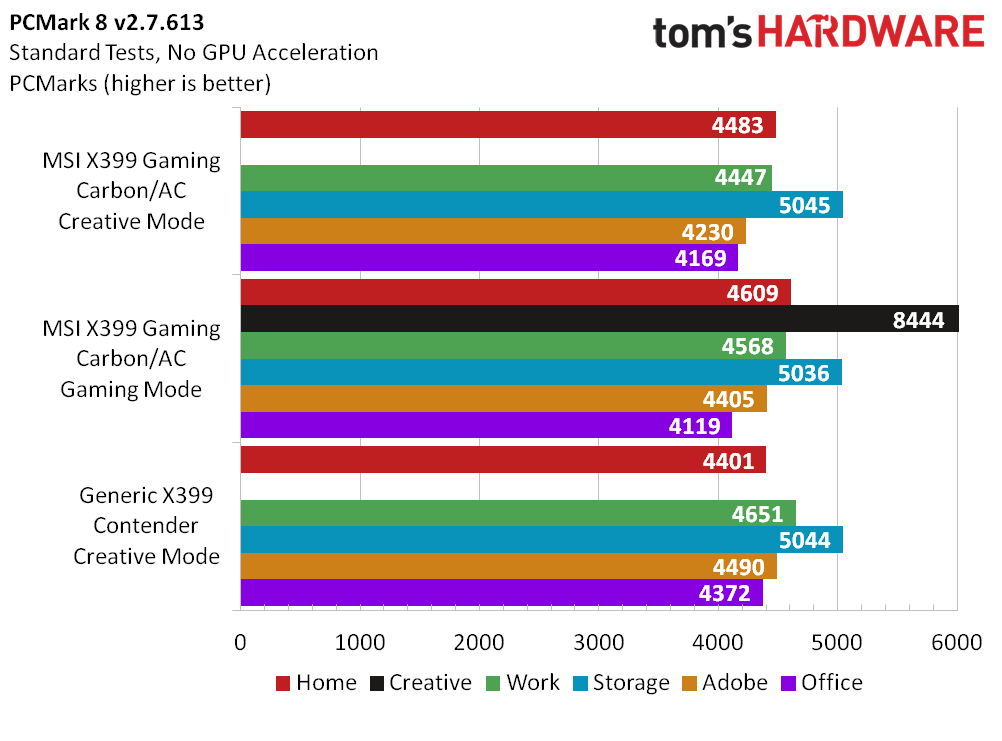
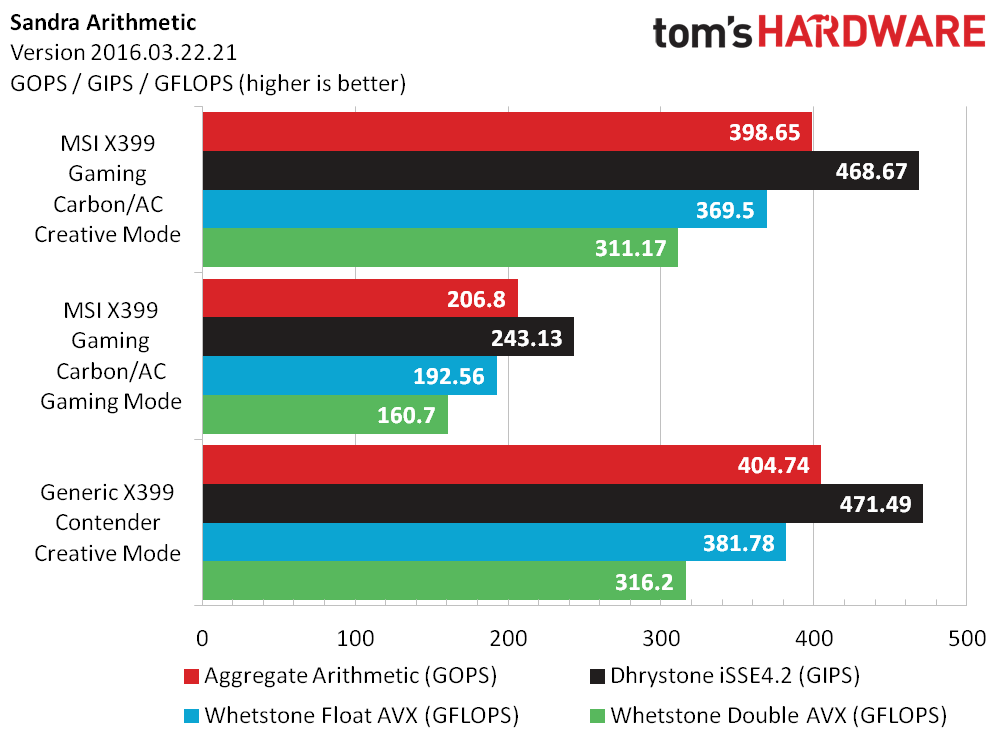
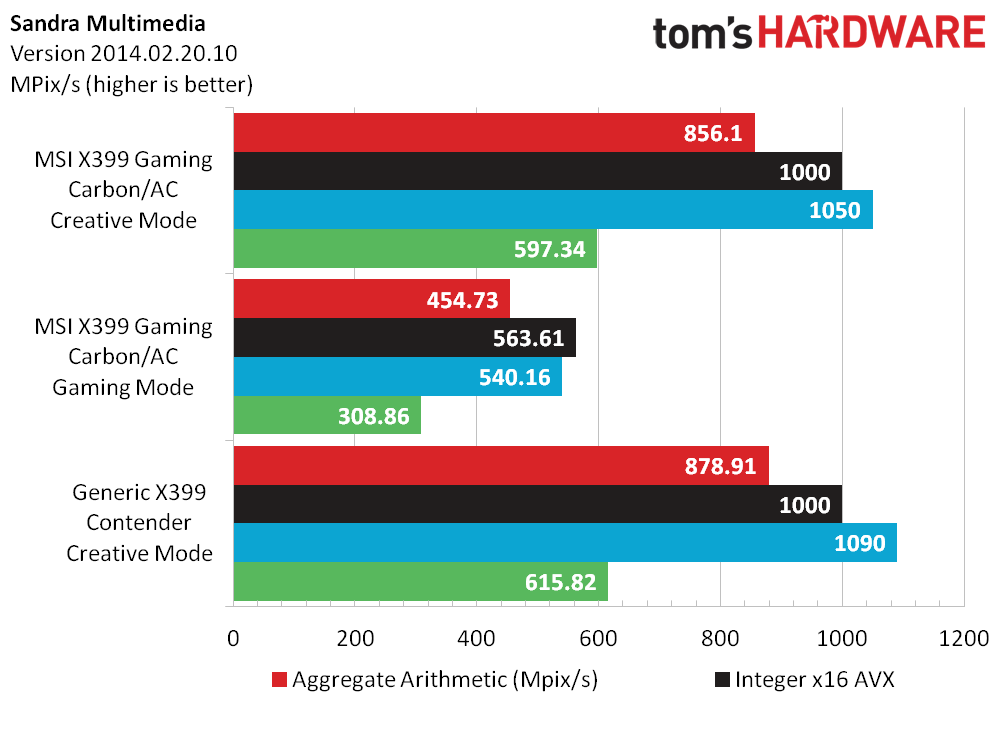
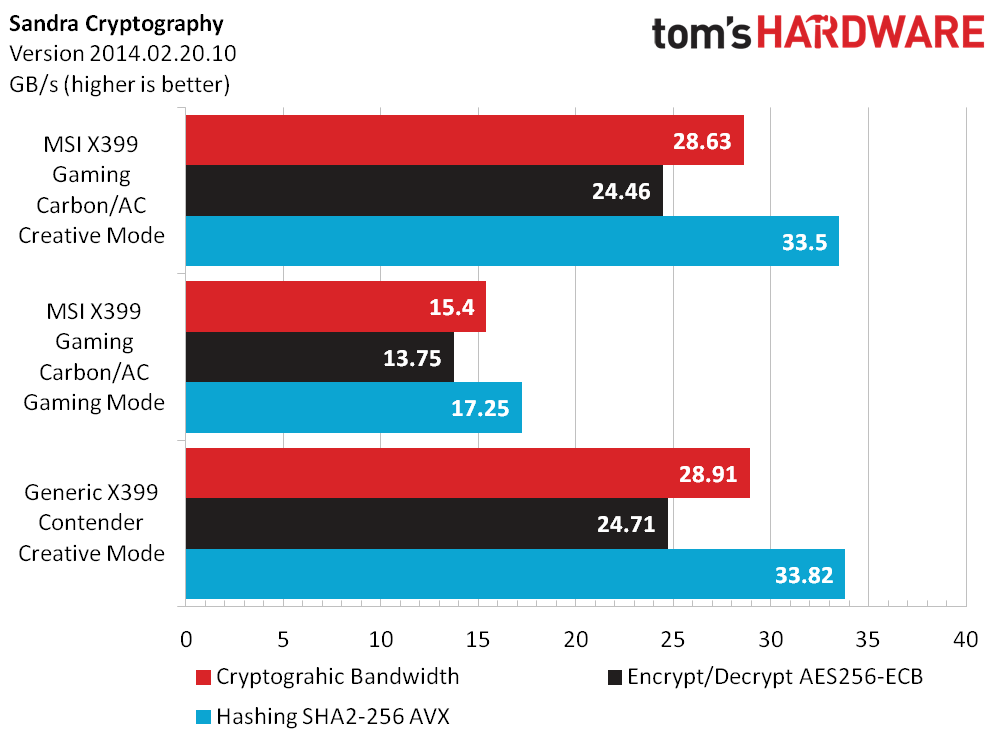
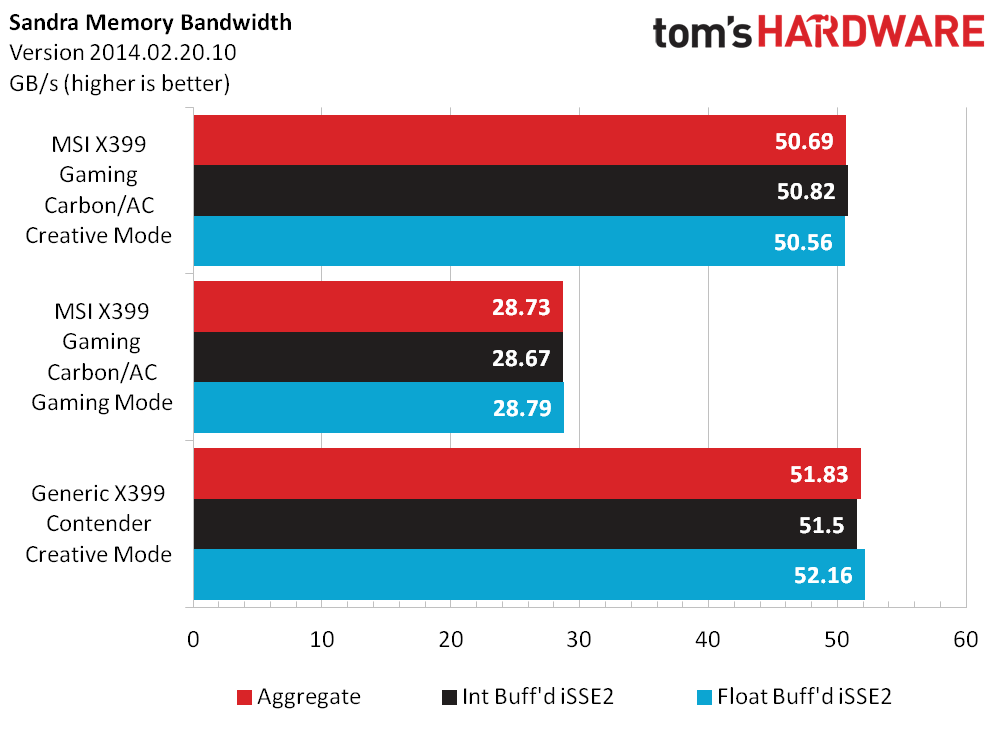
Sandra synthetics scale almost perfectly with the arithmetic workloads across core counts but show the MSI X399 trailing the mysterious competitor by a few percentage points. Performance scaling starts to dwindle with the multimedia, crypto, and memory workloads, and the MSI still lags by a few percentage points.
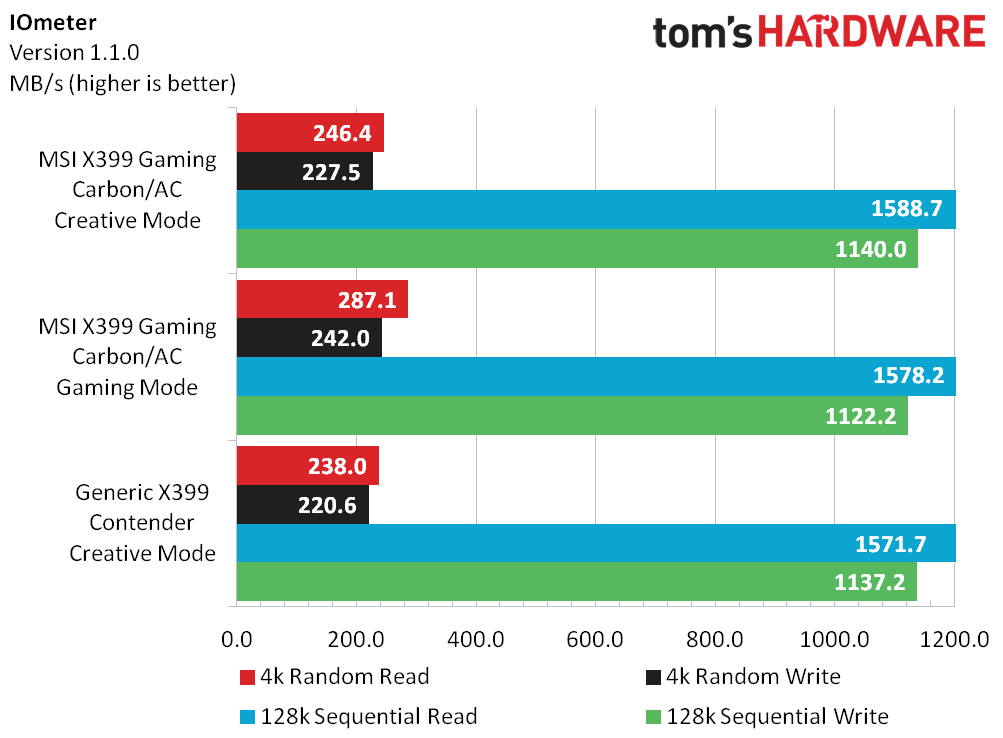
Now that we’re using IOmeter to gauge our disk performance, we observe faster random reads and writes from the Gaming Mode for the MSI X399 board. With sequential reads and writes, the MSI X399 also grabs its first win of the review versus its masked contender.
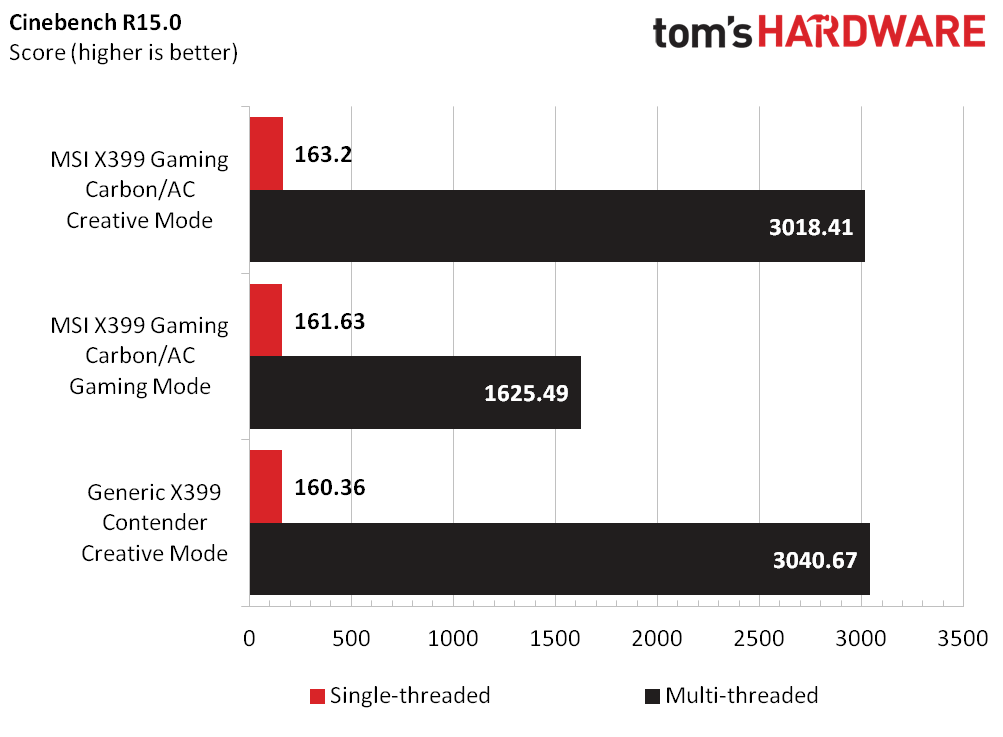
No surprises with Cinebench. Gaming Mode uses half as many threads and sees roughly 46% less performance in the multi-threaded scenario. Less than one percentage point separates all the data sets in single-threaded mode, which is expected.
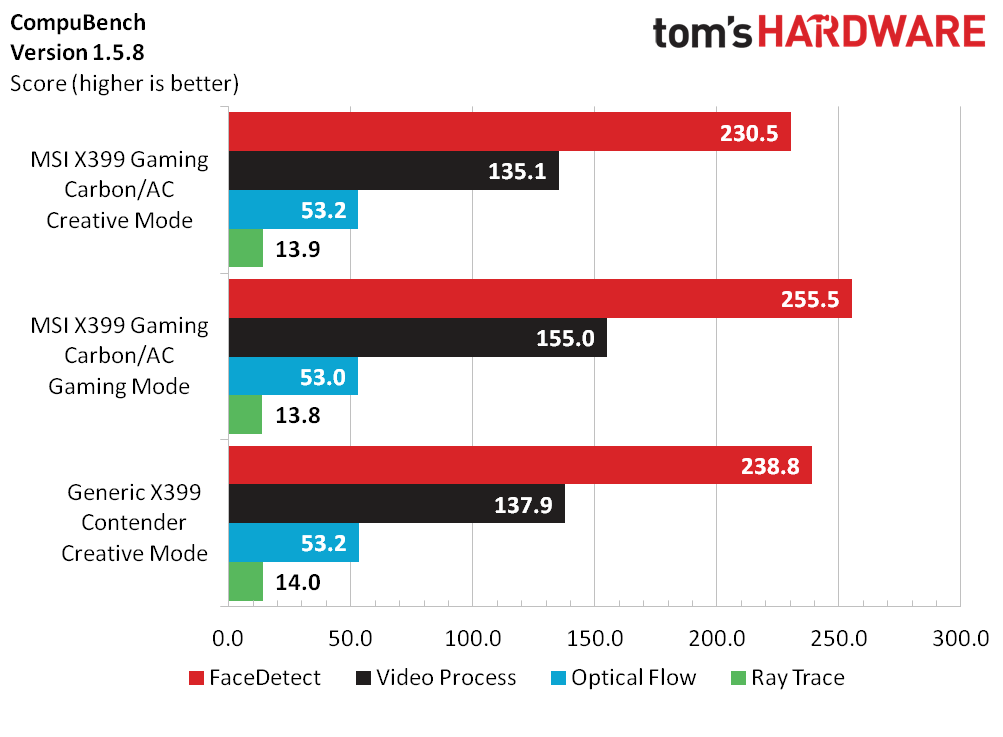
Compubench begins our shift in emphasis from the CPU to the GPU in some applications, and FaceDetect, video processing, BitCoin, and Fluid 64k metrics clearly favor the CPU latency reductions when in Gaming Mode. Creator Mode data sets are not in the MSI X399’s favor, suffering by 3% in FaceDetect.
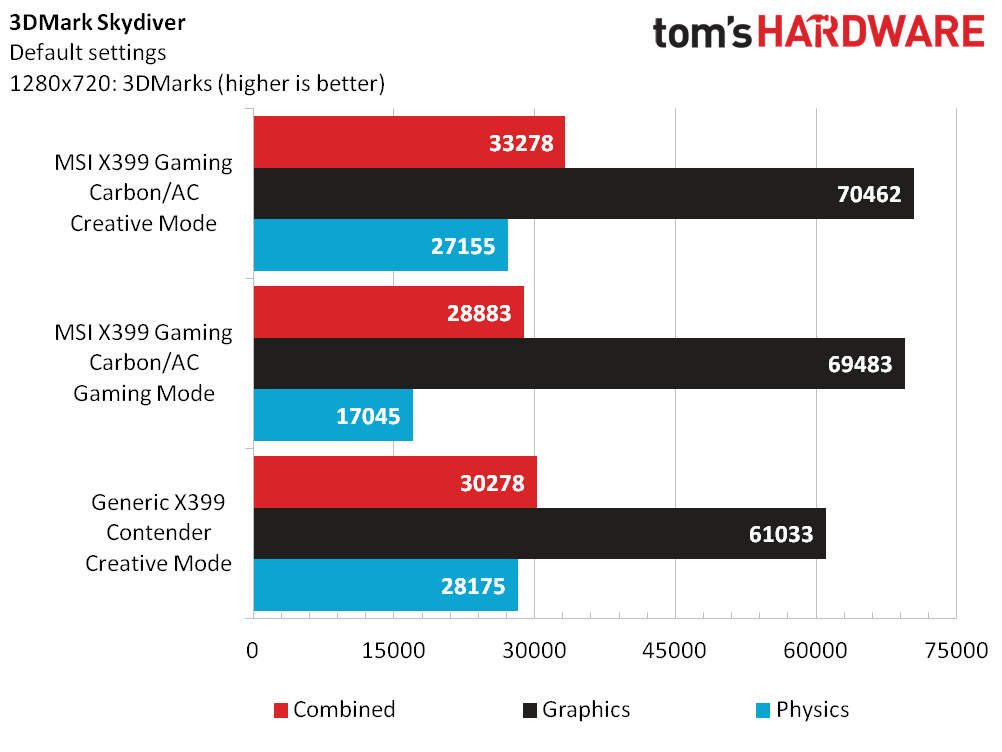
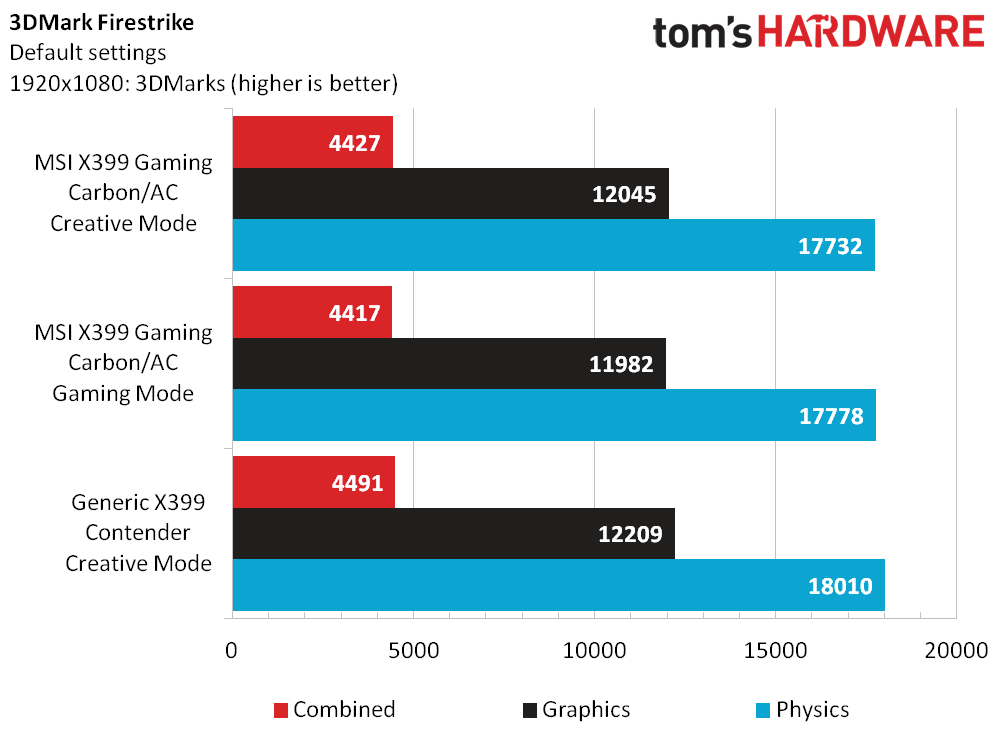
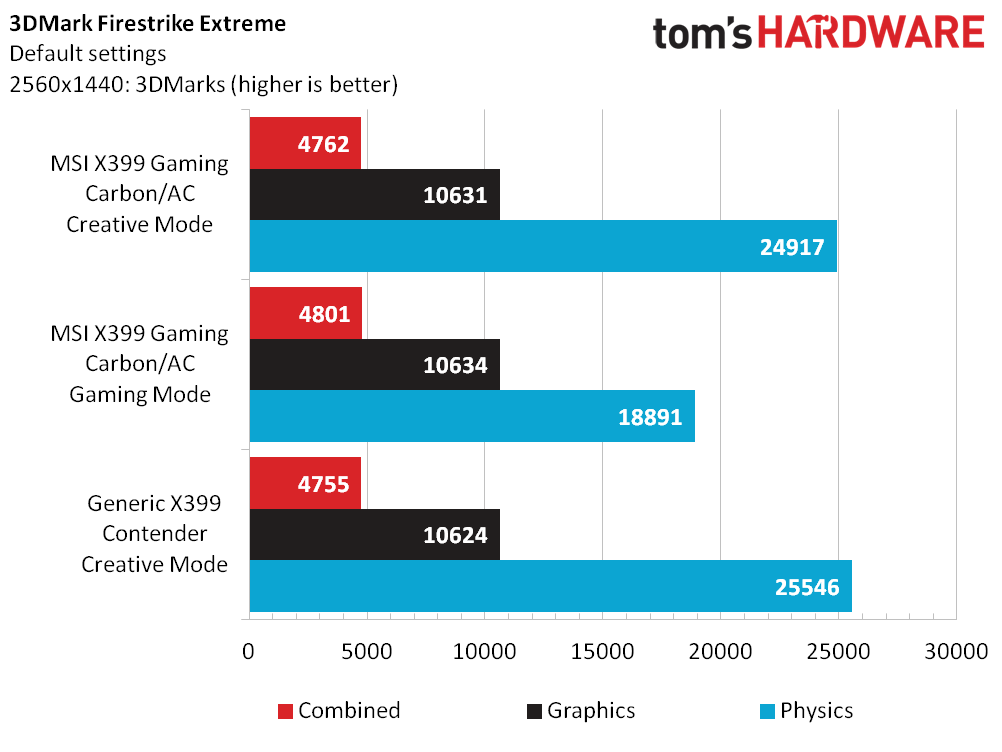
Let’s shift gears to the 3D synthetics: If you’re running 720p on a Threadripper system, we feel sorry for you. However, we’ve got the data, and surprisingly the graphics and combined scores for the Creative Mode MSI X399 are clear wins, with the Gaming Mode results showing a significant, yet expected dip in physics results. Standard Firestrike appears to show comparable results for both Ryzen Master modes, but the generic X399 contender does inch ahead by a rounded 2% on all metrics. At 1440p we are starting to stretch into the real environment for our test bench, and the Gaming Mode’s physics test is what drags that configuration down.
Get Tom's Hardware's best news and in-depth reviews, straight to your inbox.
Timed Applications
For applications we’re going to see a lot of the same results throughout, because with Creative Mode we have twice as many cores and twice as much RAM available. This translates into time reductions in Handbrake, both Blender tests, and 7-Zip, shaving up to three minutes off some workloads.
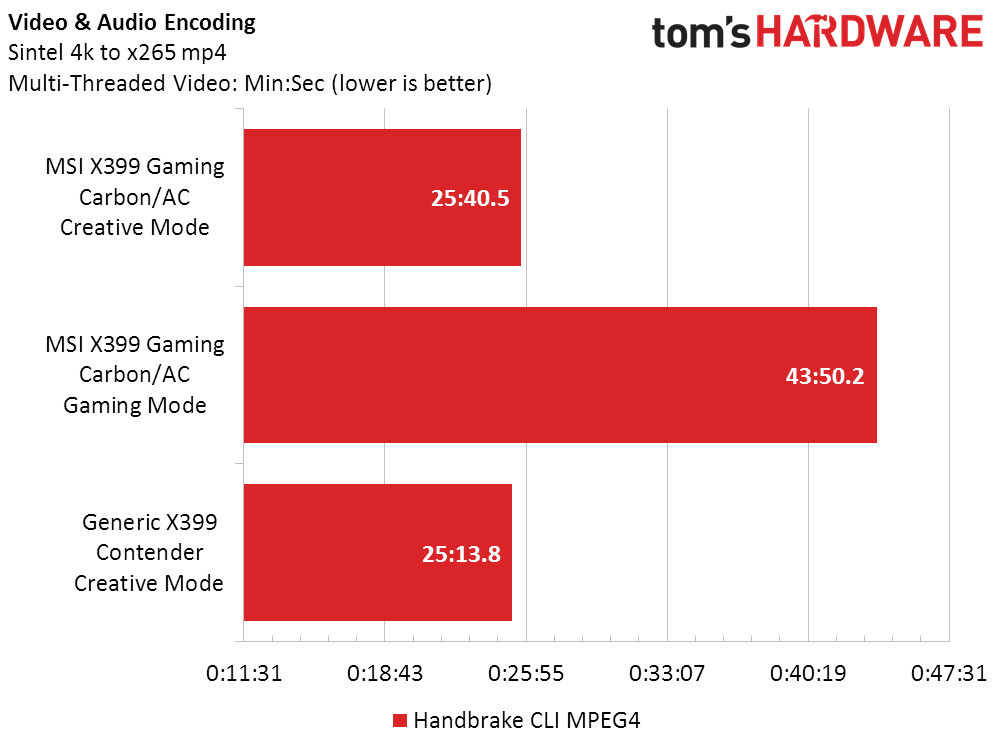
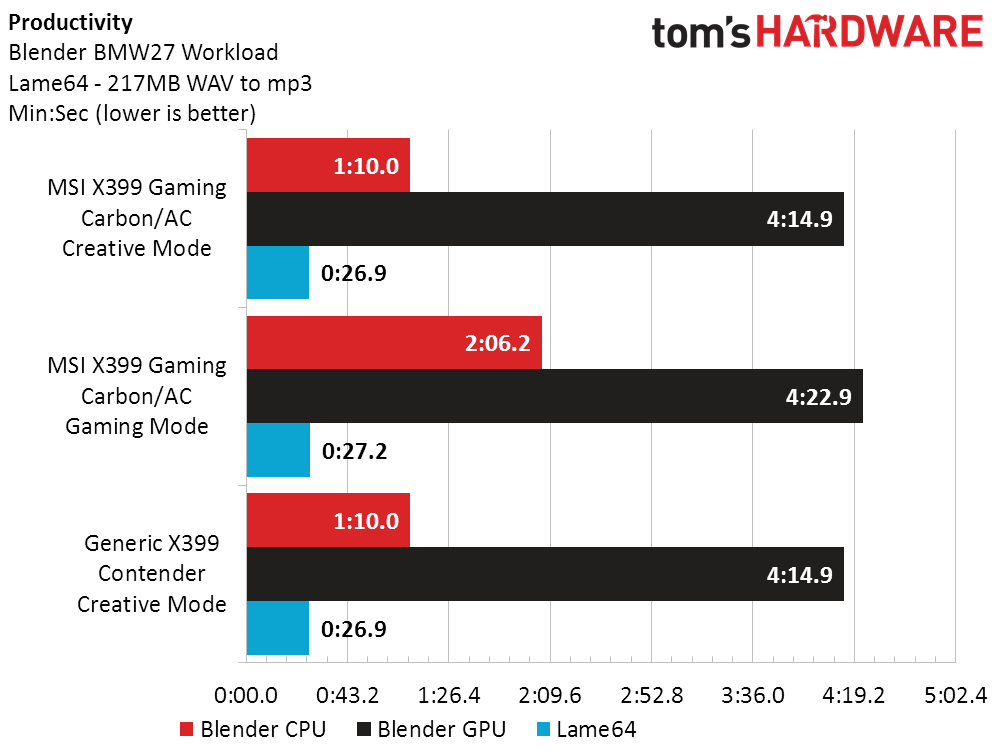
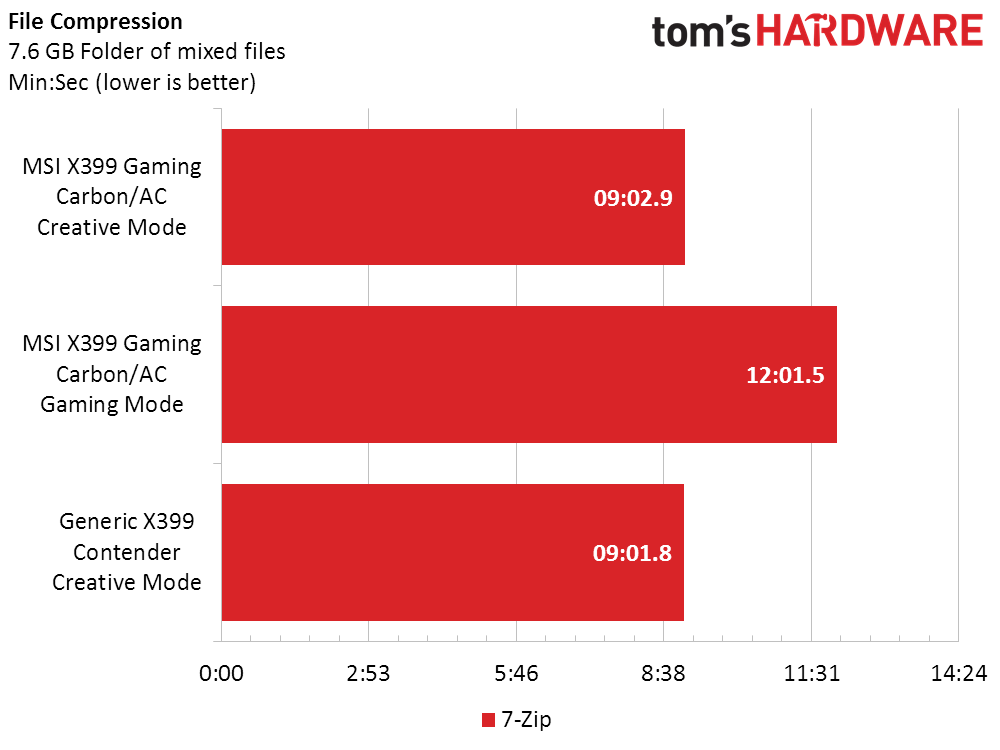
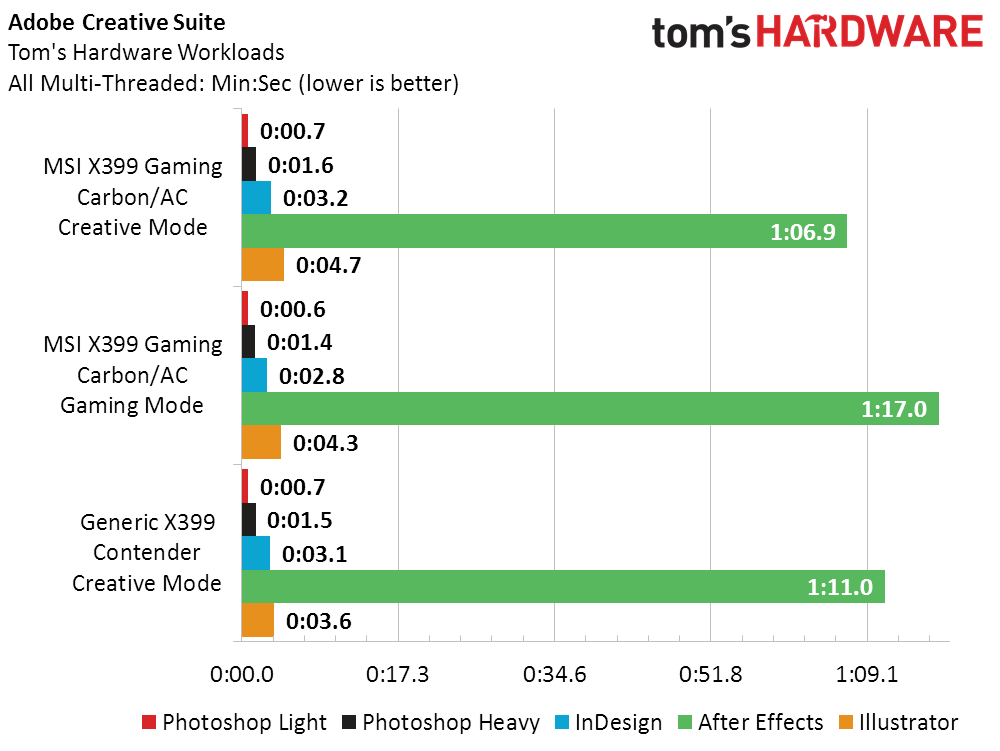
Unfortunately, Adobe is still lightly threaded and doesn’t enjoy the resources of Threadripper, and actually prefers the less endowed configuration. For some reason, Adobe Illustrator finishes almost one second faster on the MSI X399 motherboard.
Gaming Performance
We would be crazy if we recommended people not game on Threadripper rigs. Coupled with a GTX 1080, this platform is built for gaming and performing computational work at the same time. What will be interesting to see is how different games behave with the different Ryzen Master operating modes.
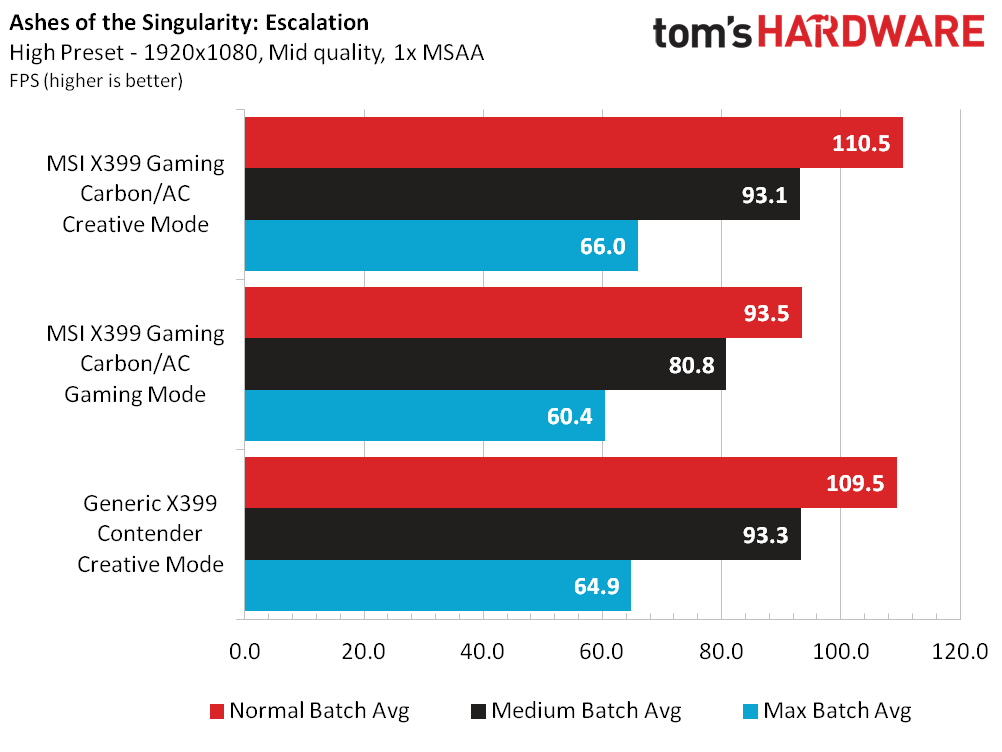
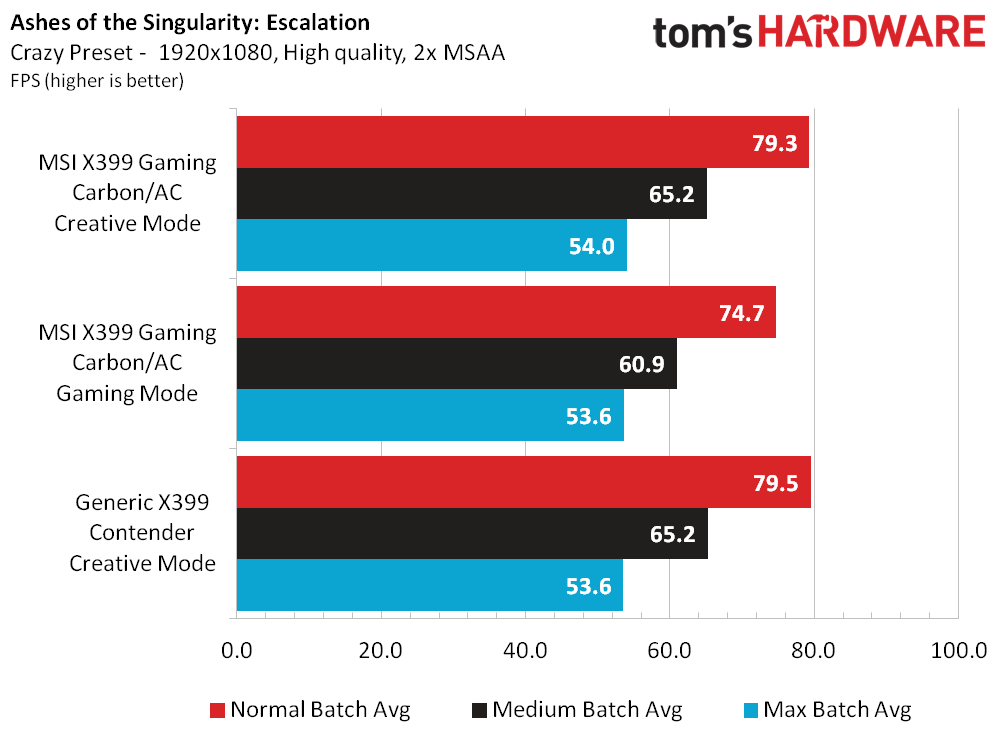
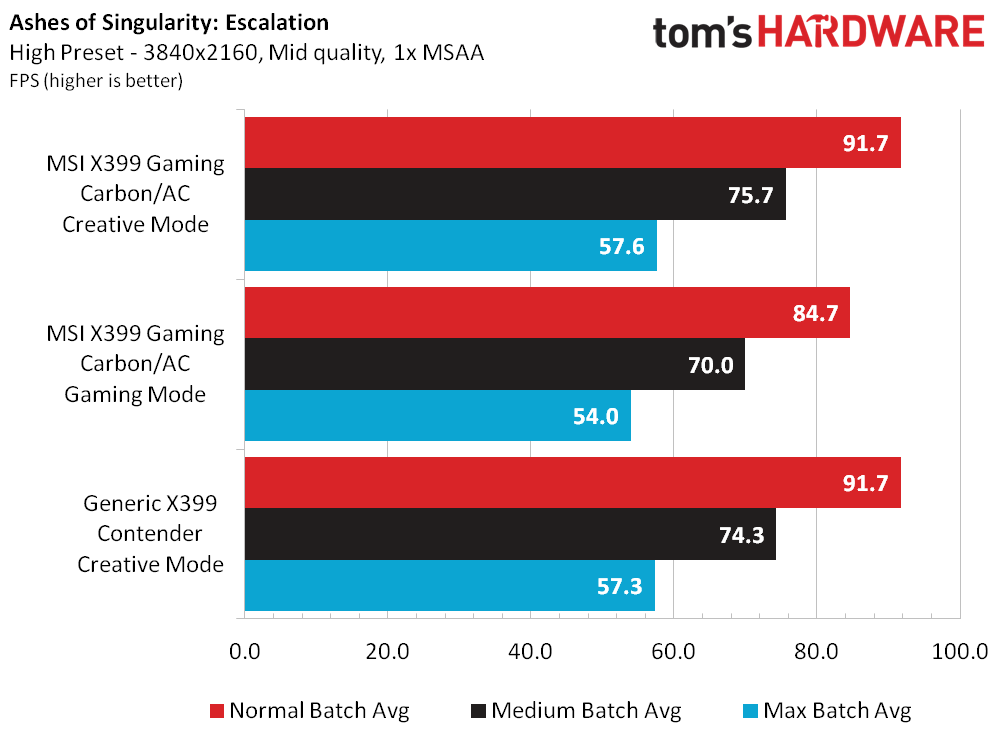
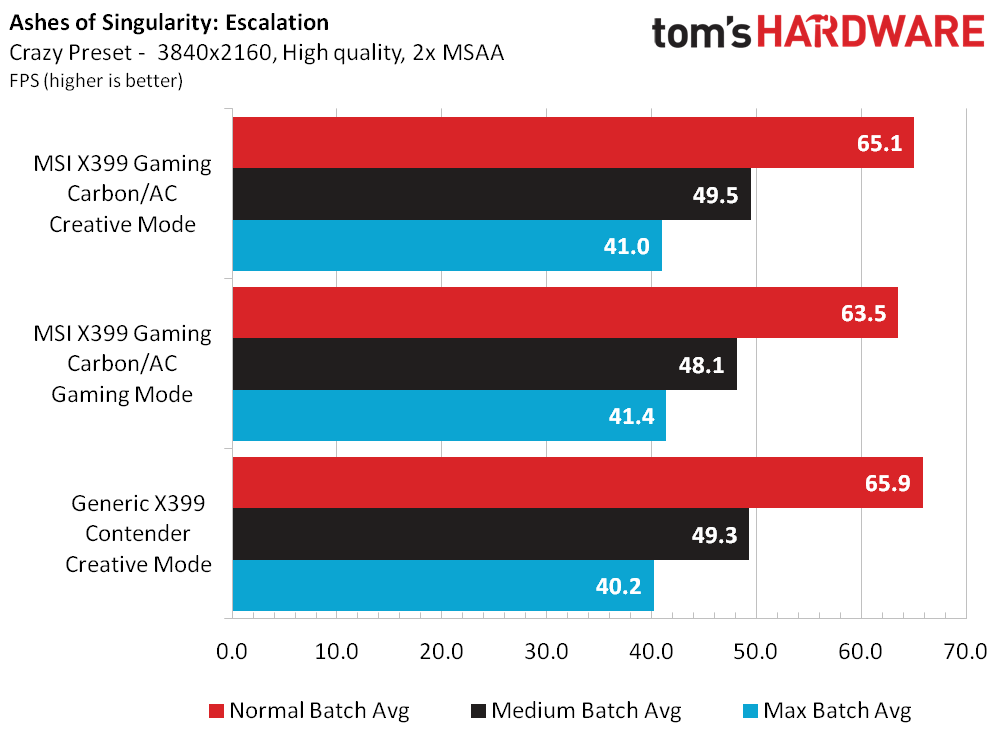
Ashes of the Singularity: Escalation starts us out at 1080p with comparable performance at both high and crazy presets for both Creative Mode contenders. Comparing the operating modes shows a performance advantage for the higher core count configs with the highest increase coming from High presets. The trend continues to a lesser extent as pixel count increases and the Crazy preset continues to squeeze all configs and systems below that sweet 60 FPS threshold.
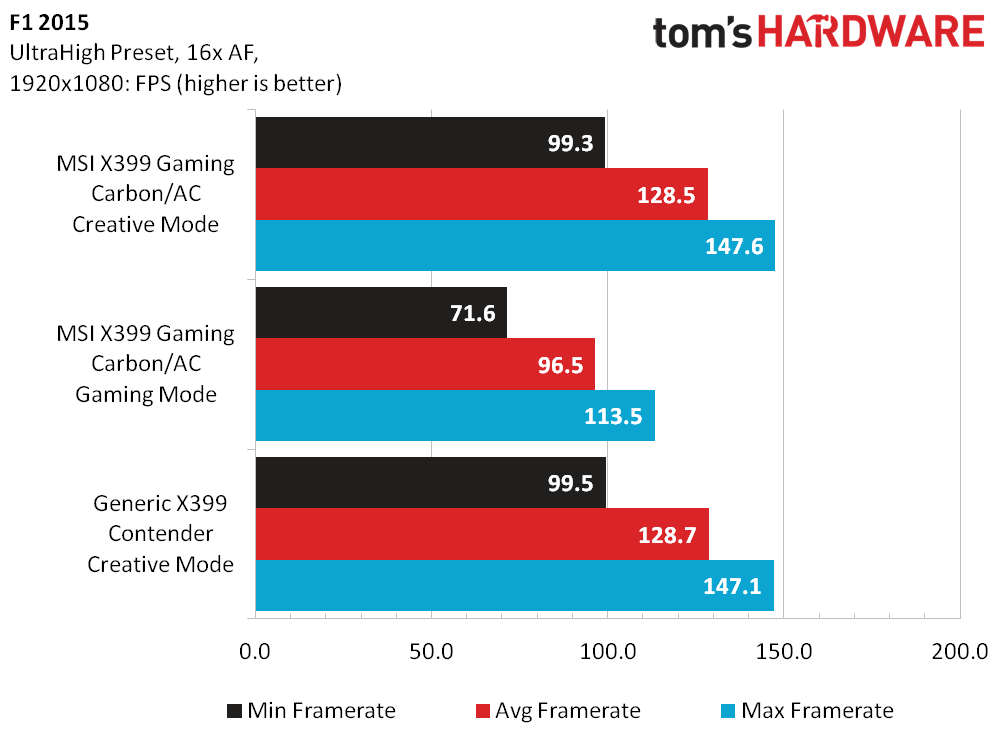
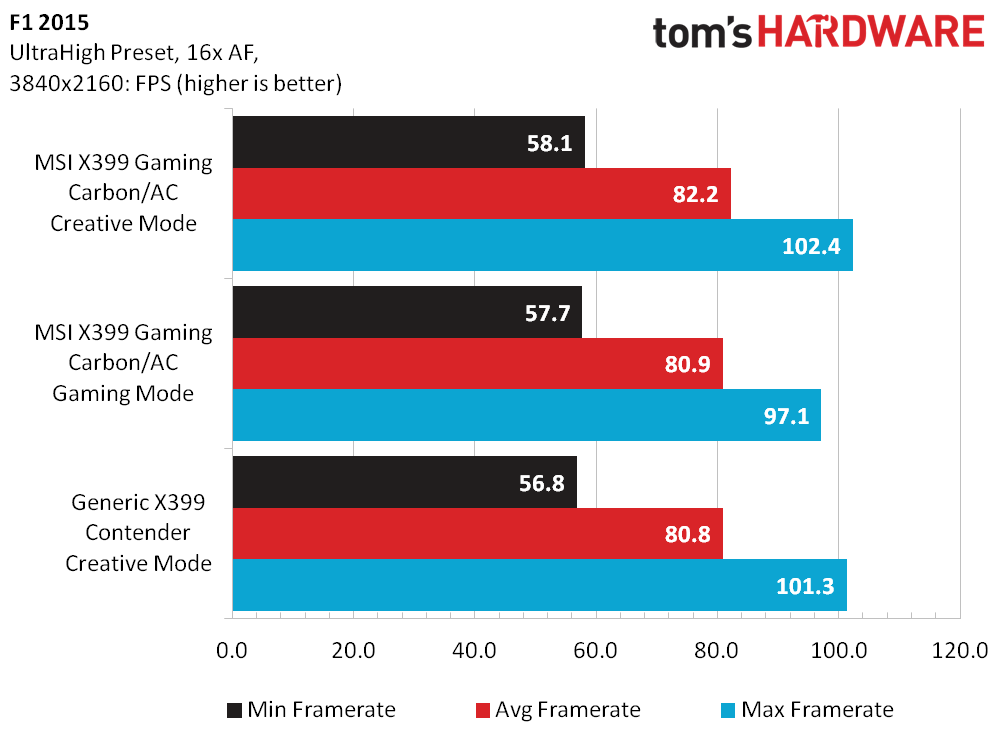
F1 2015 throws us the only curve ball in the gaming segment; it doesn't want to use all 16 cores. By adjusting our test XMLs to the 8-core setting with hyperthreading enabled, the game is functional and utilizes all the address space available. The MSI X399 Gaming Pro Carbon AC enjoys a 30% performance increase at 1080p by doing so, while 4K levels the playing field. In the end, the MSI X399 takes the checkered flag with F1 2015.
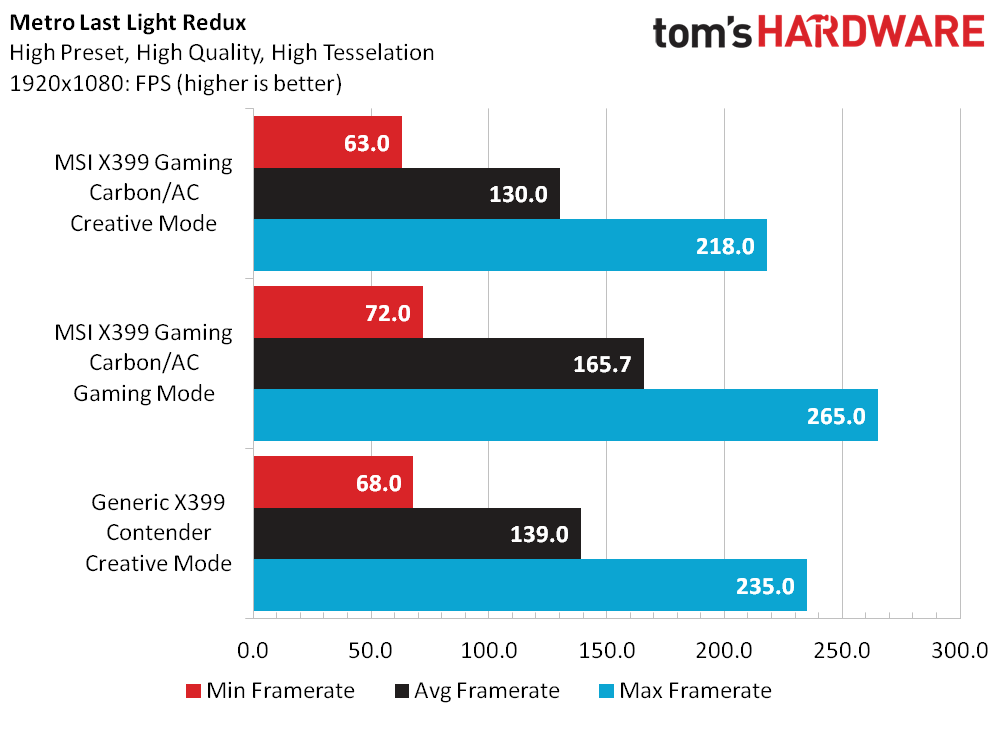
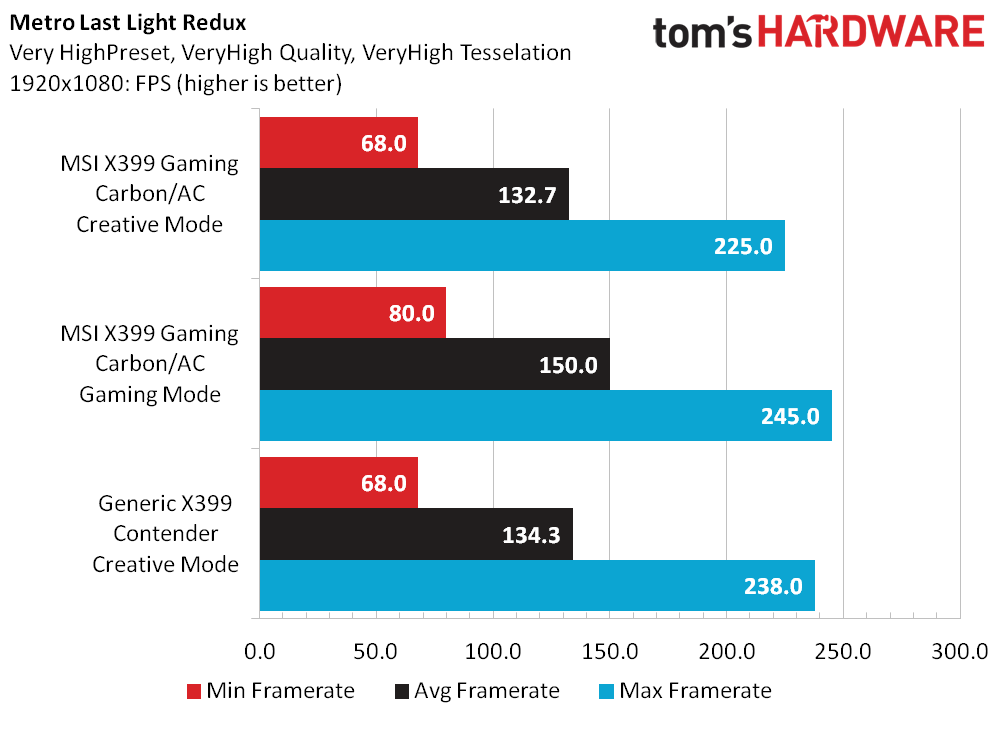
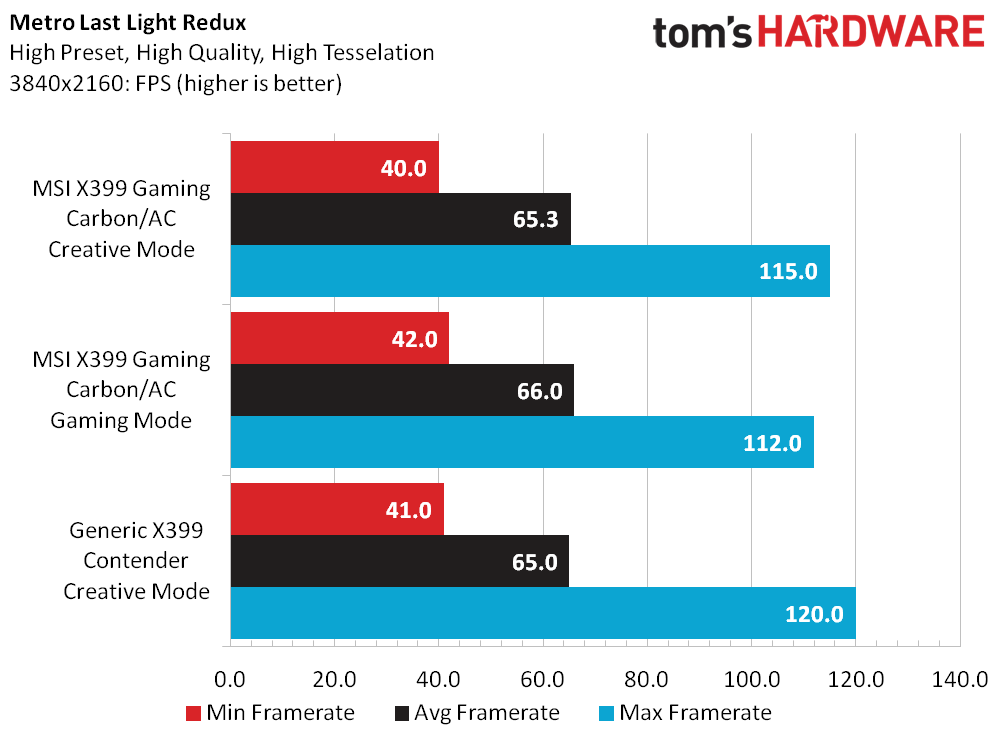
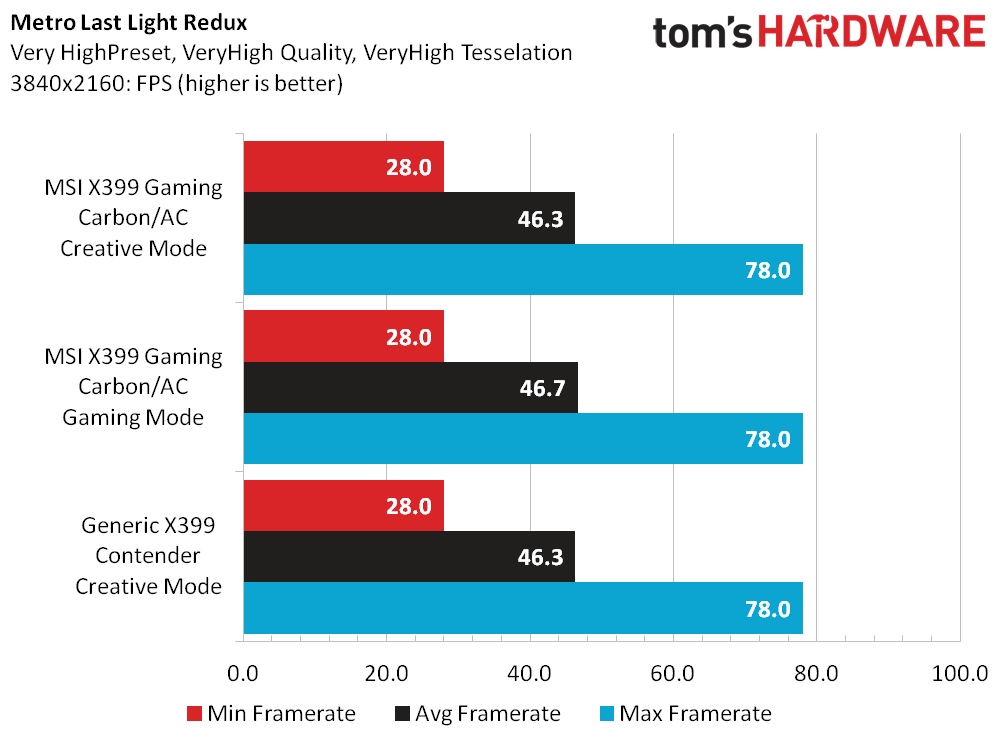
Metro Last Light scaled very well in our AM4 coverage, and it comes as no surprise that the scaling continues when keeping product and core counts consistent. This is the first instance of the Gaming Mode setting drastically improving gaming performance, at least at 1080p. At 4K and during both graphical presets, all products are within two frames of each other.
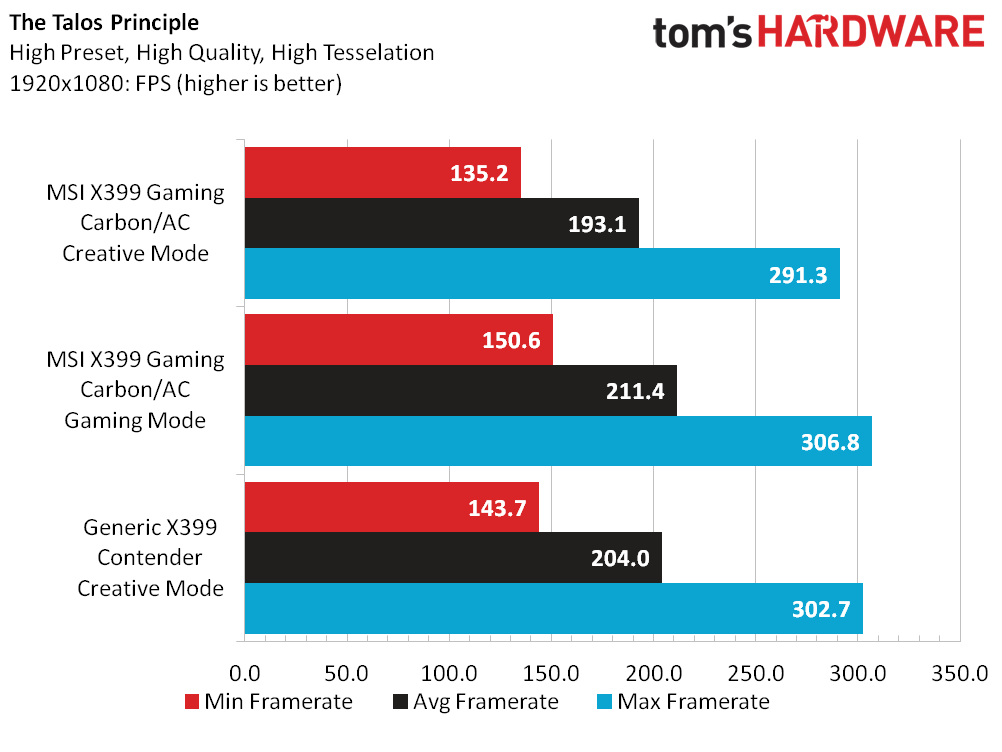
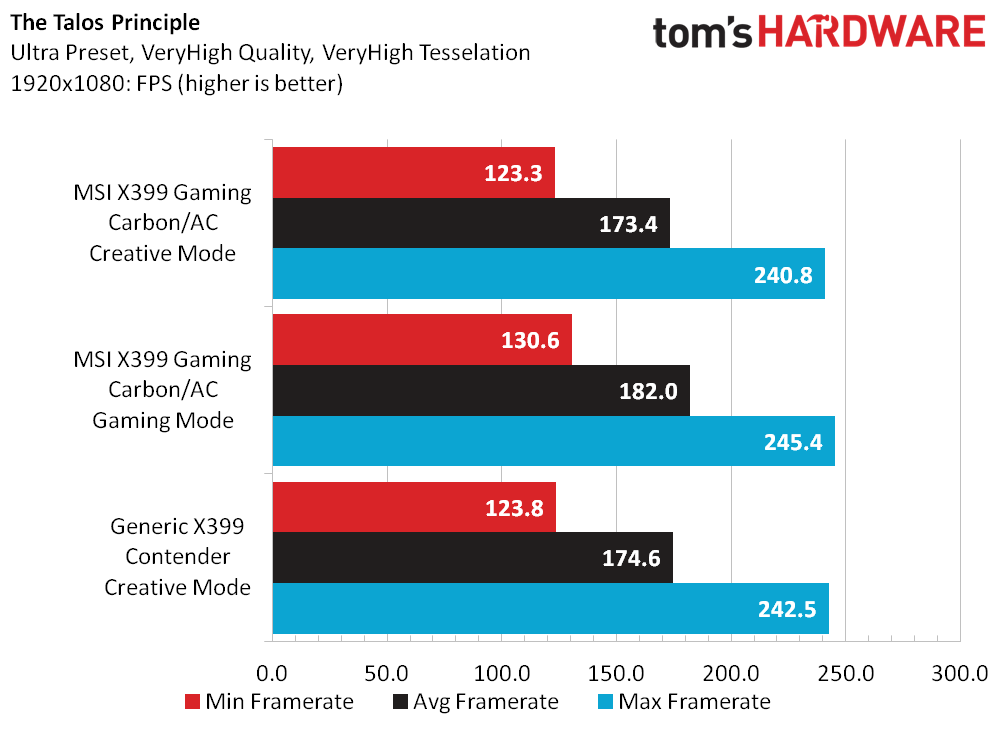
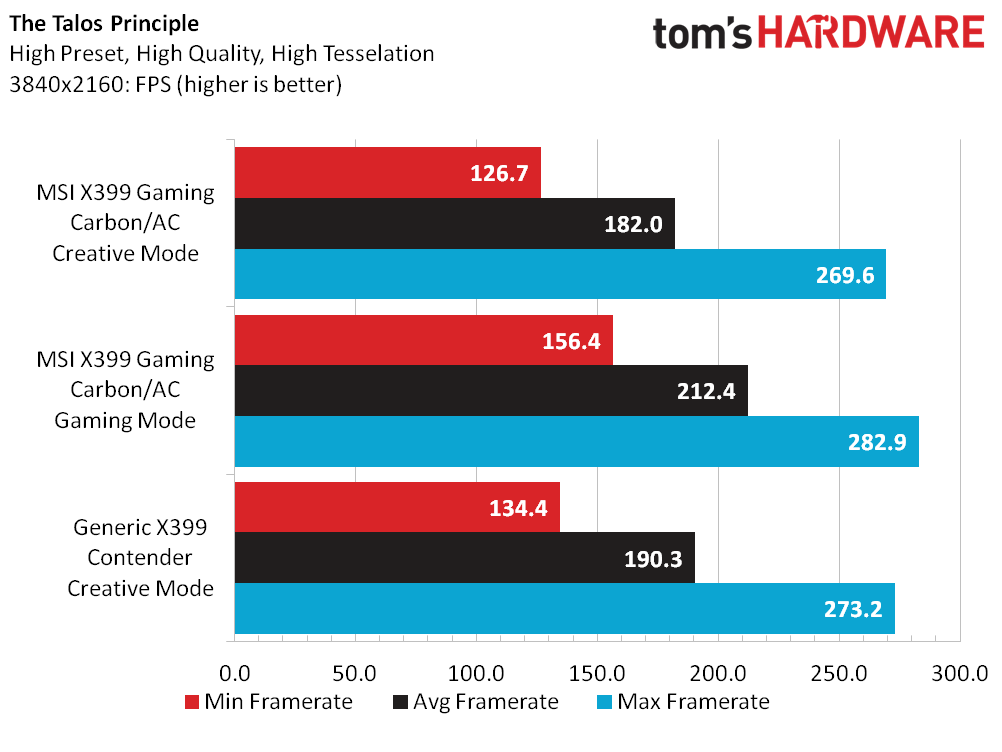
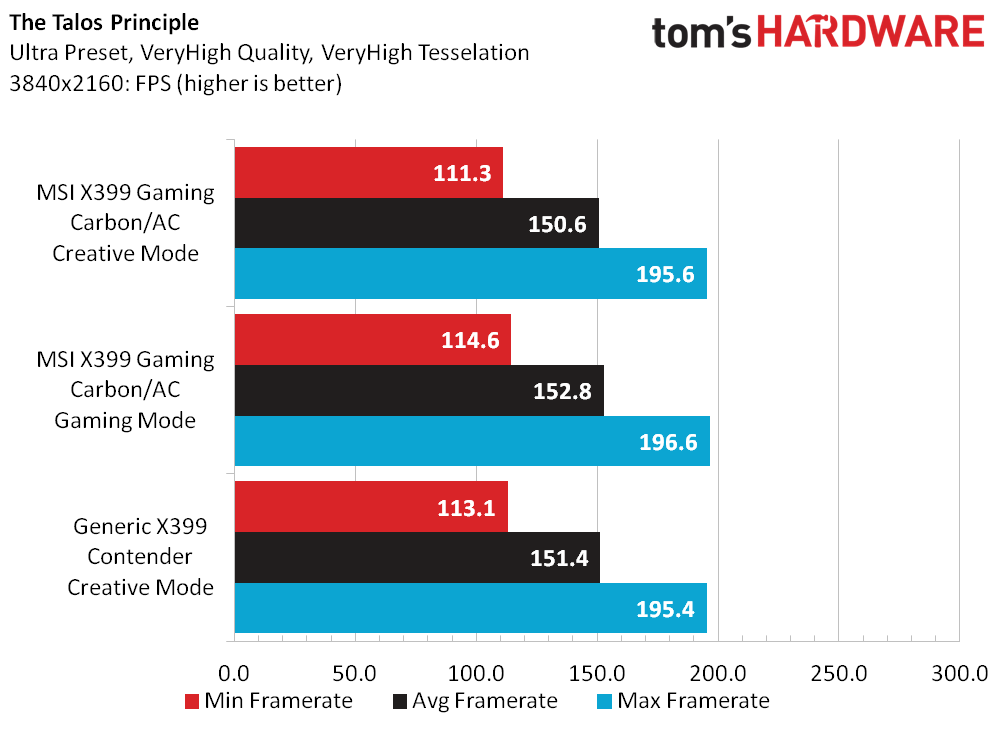
Ugh, The Talos Principle. The MSI X399’s Creative Mode lags behind its Gaming Mode by about 10% at 1080p and High presets, while the Ultra presets are only lagging by about 6%. At 4K we see nearly 15% performance increases at the High preset, but Crazy levels everything back out across the platforms. Taking all data into account, this hardware is complete overkill for this game.
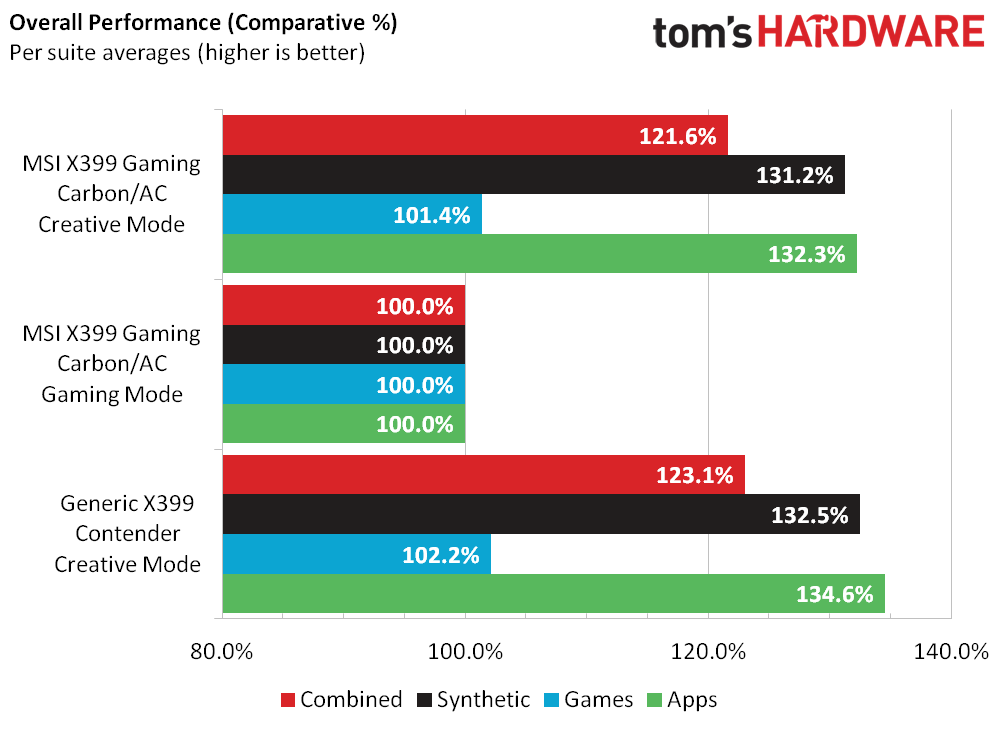
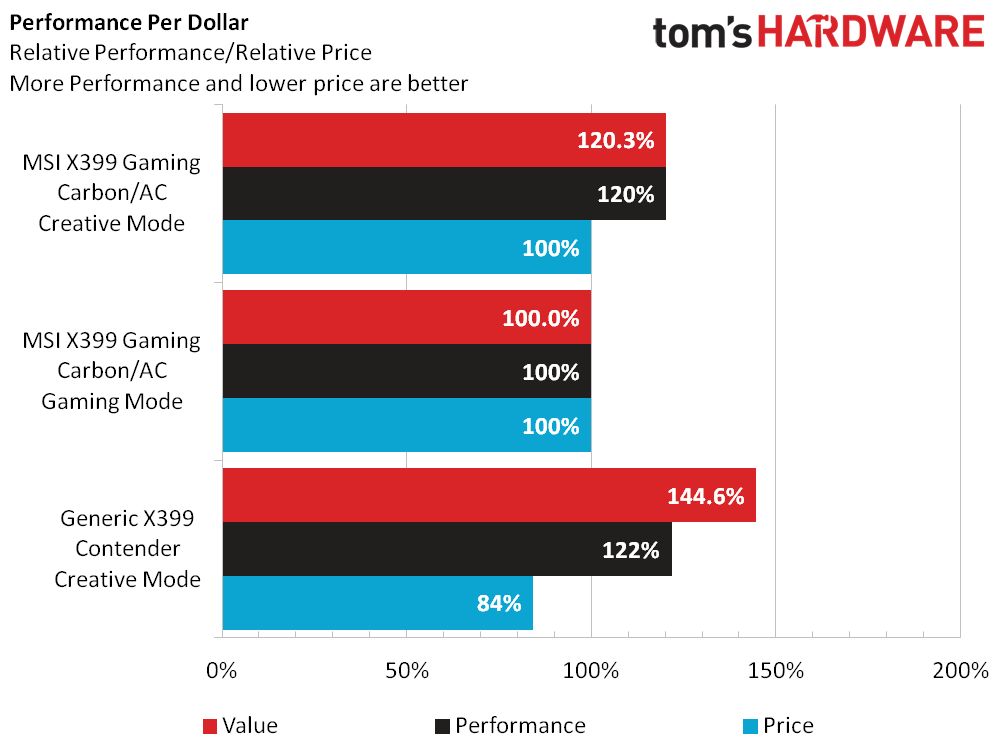
For the sake of simplicity, we are going to normalize our data around the Gaming Mode results for all of our samples today. By definition, the Gaming Mode Threadripper processor is, in effect, a Ryzen 7 processor, so we can extrapolate several key messages regarding performance. First, there are definite gains to be had with Threadripper in our benchmark suite. With more threads and memory available for computing, Creator Mode achieves an advantage of at least 20% across the board. Next, the MSI X399 Gaming Pro Carbon AC suffers between 1% and 2.5% behind our mysterious contender on average. Maybe the power, efficiency, and value arguments can redeem this board.
Power, Thermal & Efficiency Results
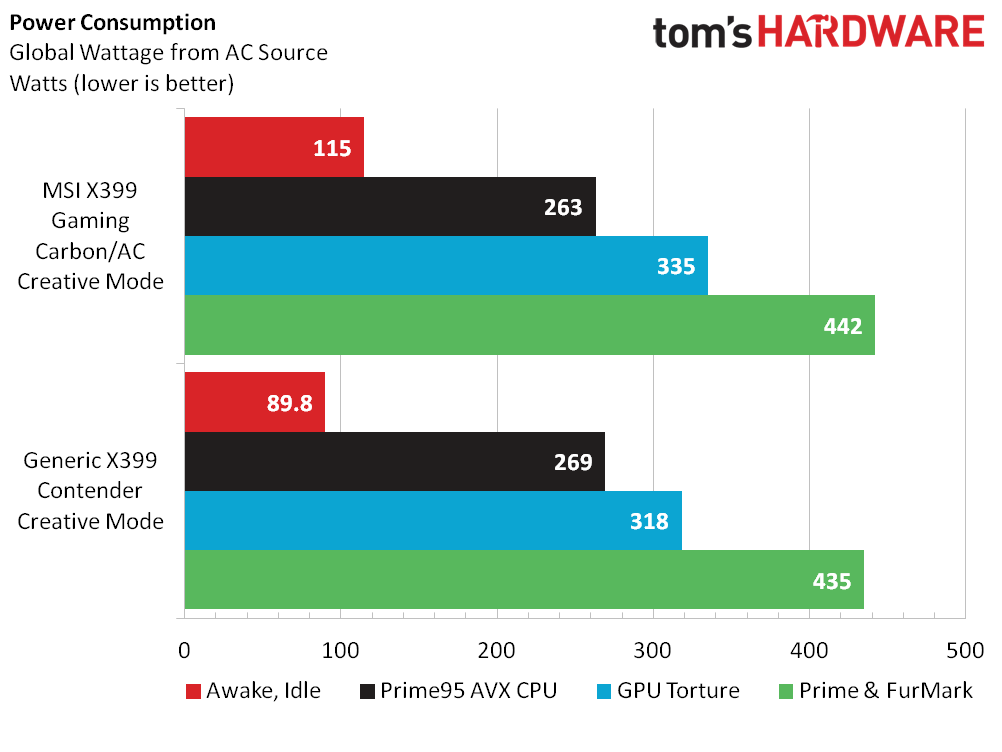
For simplicity, we only tested using the Creative Mode setting, because power gating and other processor architecture settings could make direct power comparisons more complicated. Gazing at the Kill-A-Watt, the MSI X399 Gaming Pro Carbon AC system draws 25 more watts at idle than our competitor and overall draws roughly 10W more than the contender on average, which is within four percentage points. We’d be interested to see the statistics of the power output on our systems, so if anyone can recommend a graphing utility that plugs into USB, let us know in the comments.
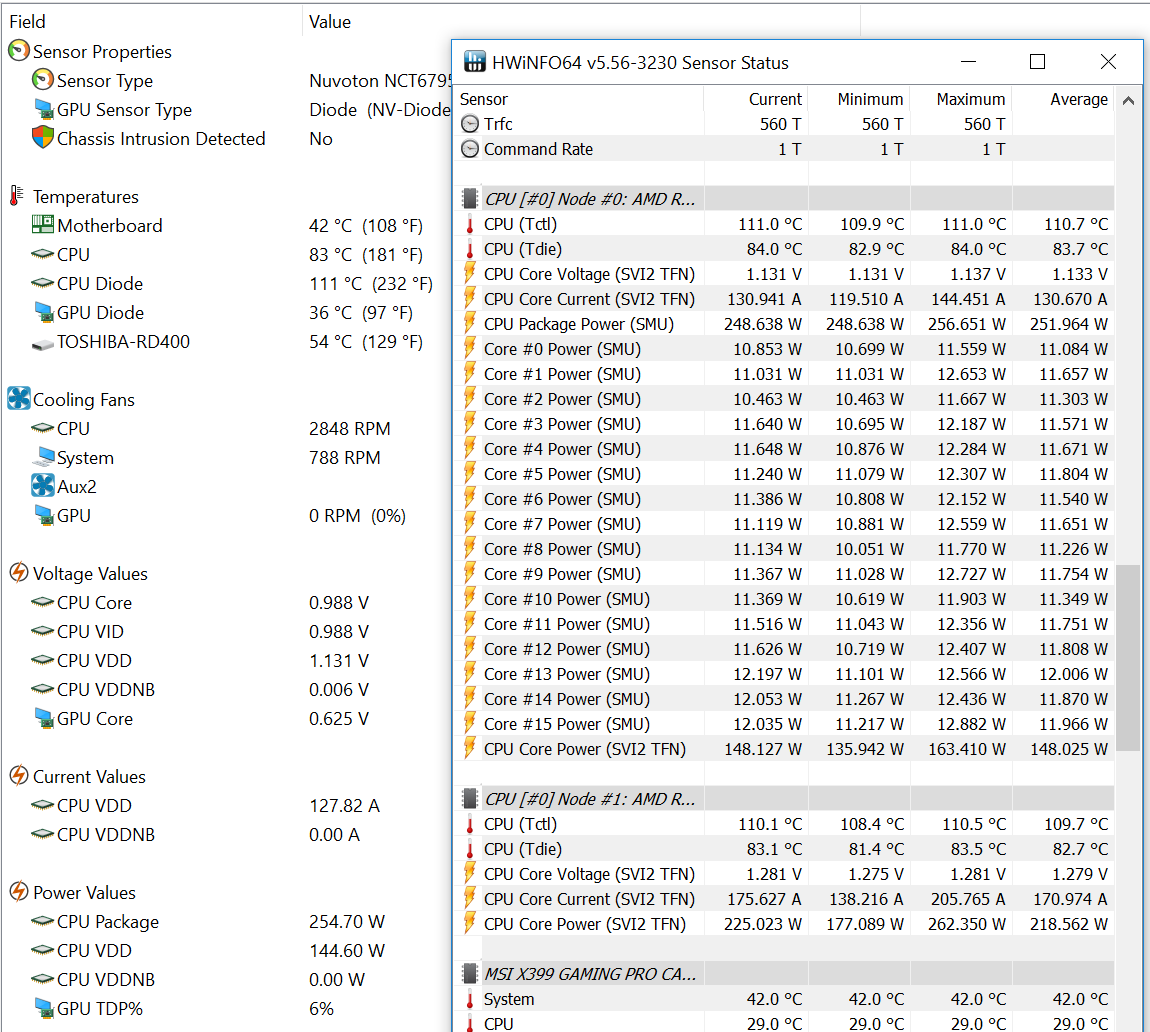
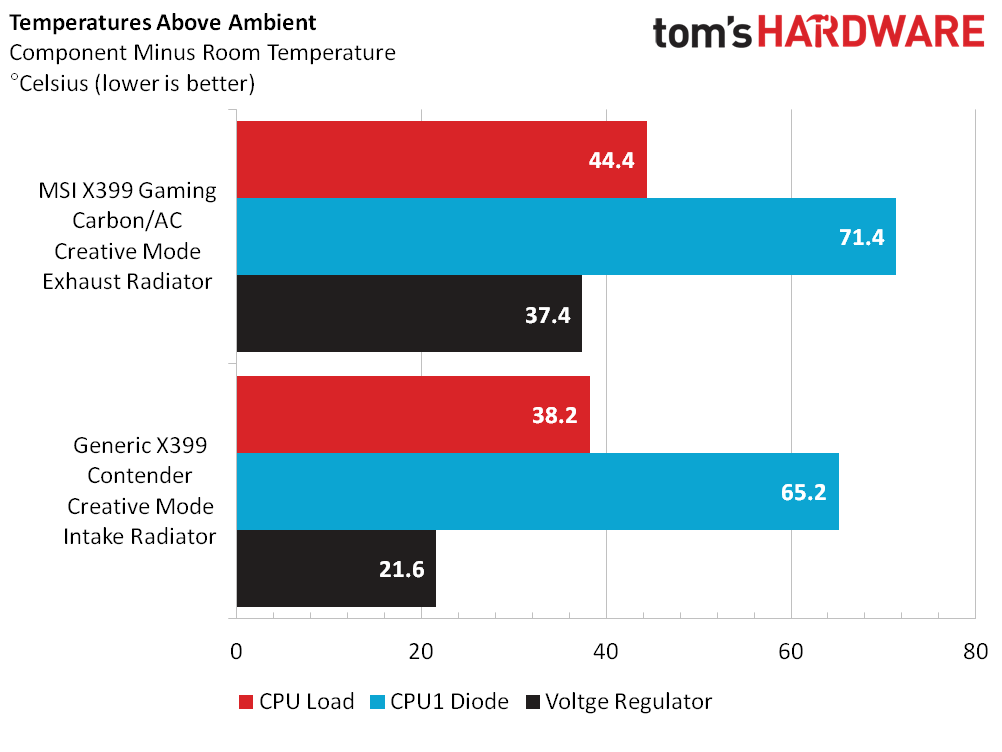
We have abandoned AIDA64 for temperatures, because we've had issues with software updates and the impact of them on reproducible results on our AM4 platform. The first picture above is for reference, comparing AIDA64 vs HWiNFO. On TR4 sockets, we’ll be using HWiNFO and will be reporting the Tdie and Tctl from that tool. As expected, the MSI X399 runs a modest 44°C above ambient and reports the expected +27°C Tctl metric. The contender uses a different chassis and intakes ambient air into the radiator for an impressive 6°C decrease. Unfortunately, the airflow across the regulator on the MSI X399 board is just not optimal or cool enough to match the contender’s performance, although 37°C above ambient is still within safe regions on this system.
Because the MSI X399’s overall performance metrics are close to those of the contender, the power draw data is what dictates the efficiency score for the Pro Carbon. We don't think 4% additional power is a terrible thing, and there could be some board to board variation that plays into either vendor’s favor.
Overclocking
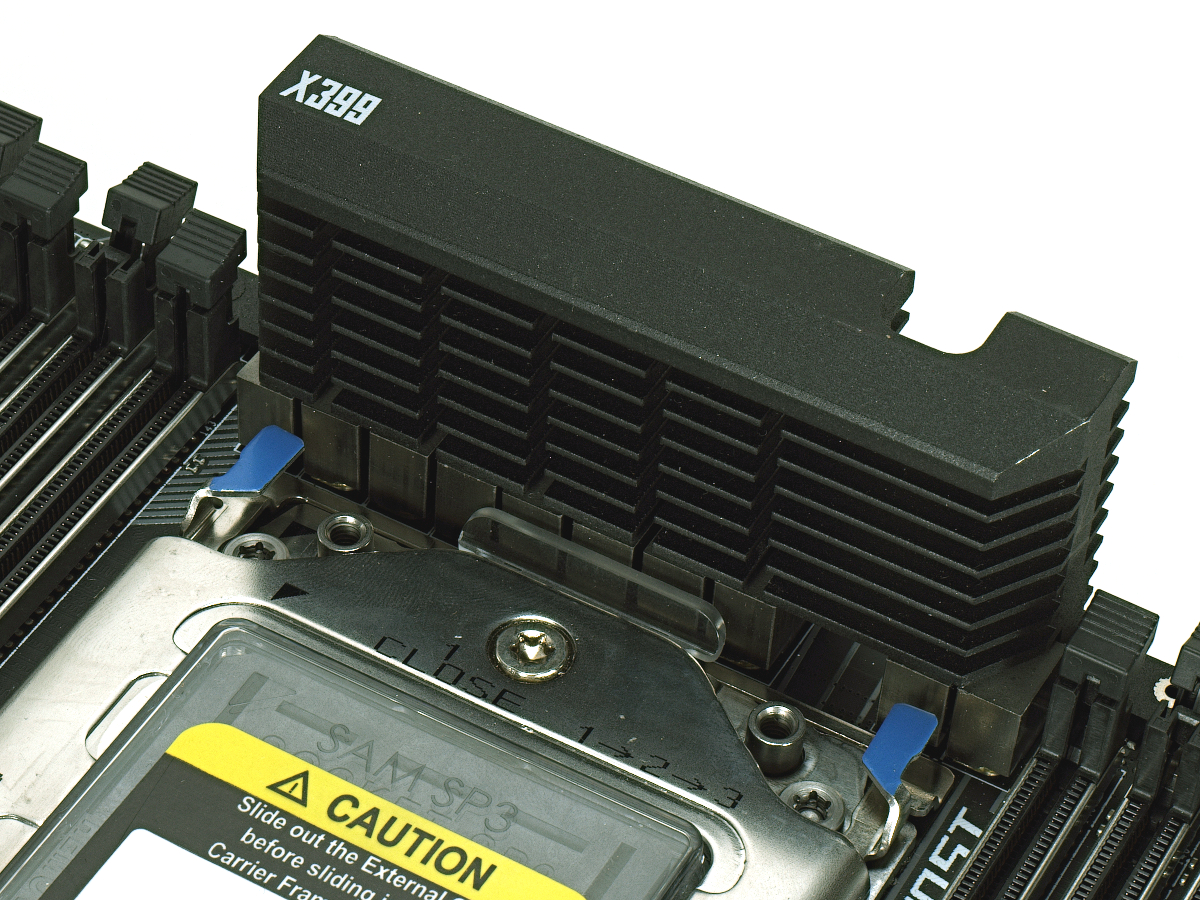
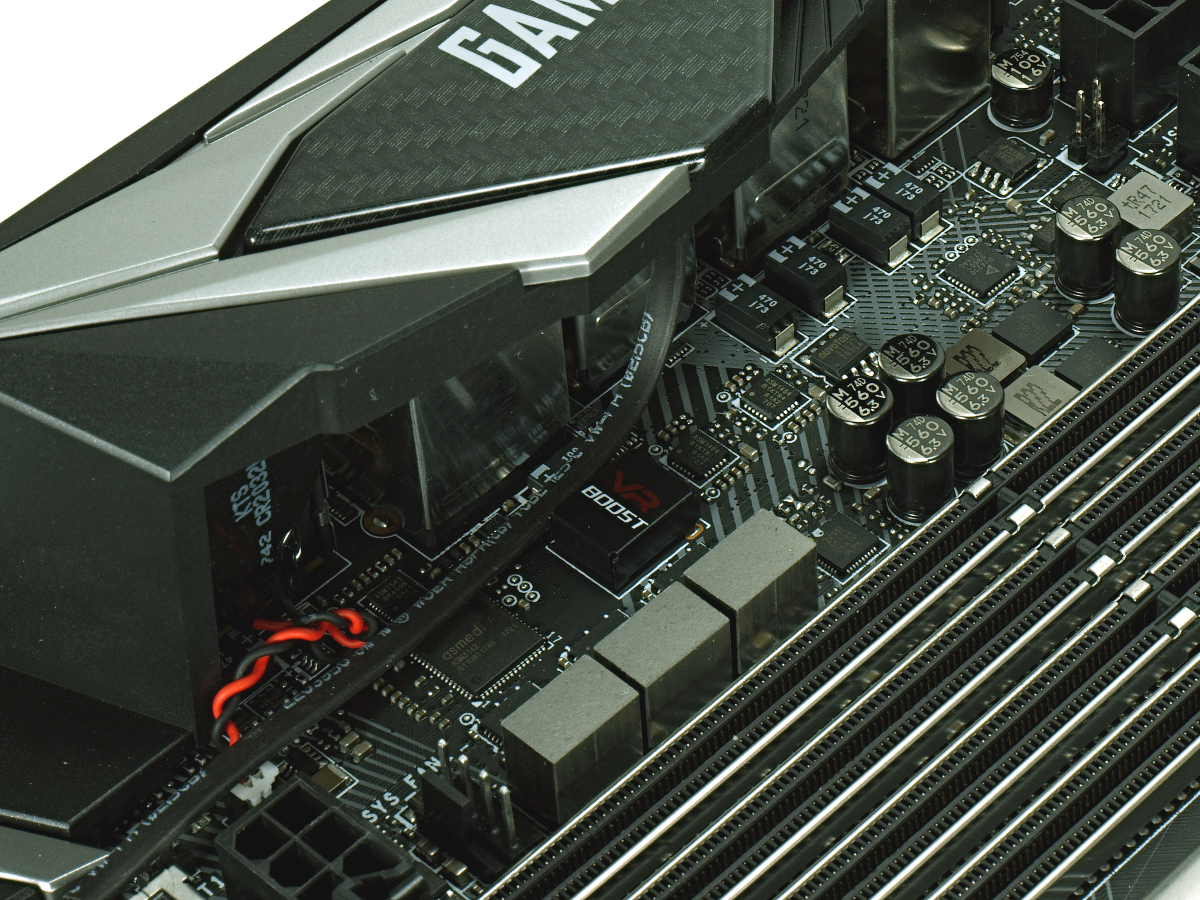
Circling back to board components, the MSI X399 Gaming Pro Carbon AC utilizes a 10+3 phase design for power delivery directly to the Threadripper processor. It is hard to believe that the designers could fit that many CPU phases directly beneath the limited footprint of that tower of a heatsink. Fiddling with the power workloads for our testing, we encounter odd occurrences of the system just shutting off, which is indicative of a power delivery problem. After a few emails with the MSI technical staff, it turns out some of the preliminary settings with the UEFI were based on engineering samples provided by AMD and didn’t represent the entire population of processor vintages. Upgrading to the 152 UEFI remedies this problem as we get our testing underway.
Having a full 360mm radiator at our disposal is new ground for this reviewer and with that comes optimism that we can achieve better results than our dud of a Ryzen 7 1700X. I am also determined to best Paul’s standard overclocking efforts. I want to break 3950 MHz.
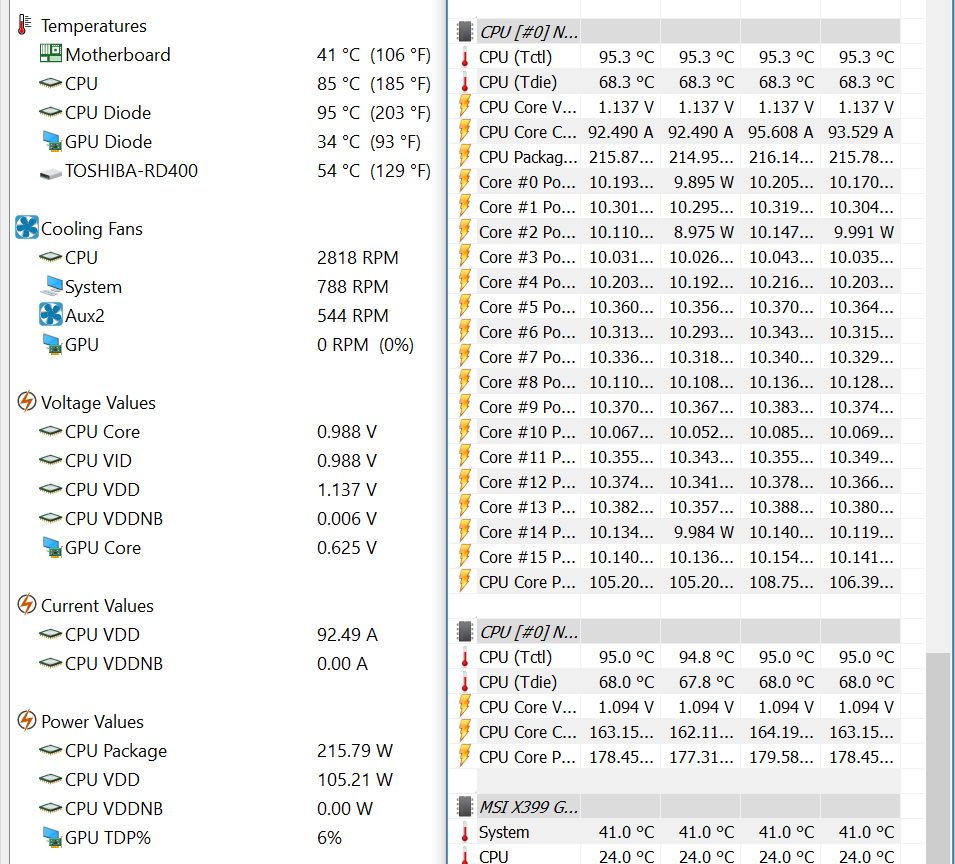
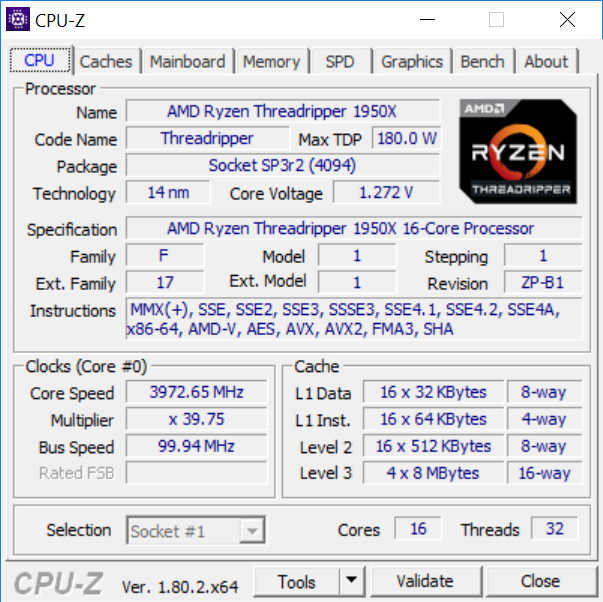
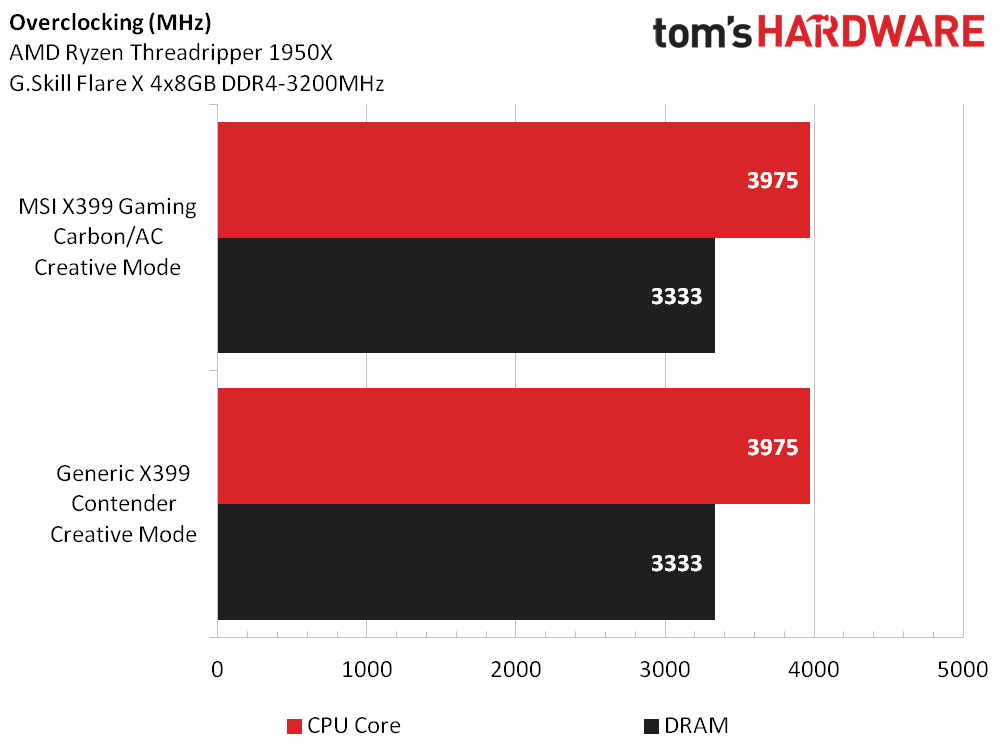
Bumping up the multiplier to 38 right out of the gate shows all 16 cores humming right along and, interestingly enough, temperatures not much higher than our standard testing. Bumping up to 3850 and then 3900 prompted us to increase the loadline to level 2, which is consistent with our X370 observations as well. With temperatures still within reason, increasing the voltage up to 1.2875 ultimately enables us to beat Paul and run at an impressive 3975 MHz! 4000 MHz is stable on this platform for limited stress testing, but 3975 MHz ran all night and well into the morning (I forgot to shut it off before work). Our temperatures during extreme testing were at 85°C Tdie, which is as high as this reviewer feels like pushing the system.
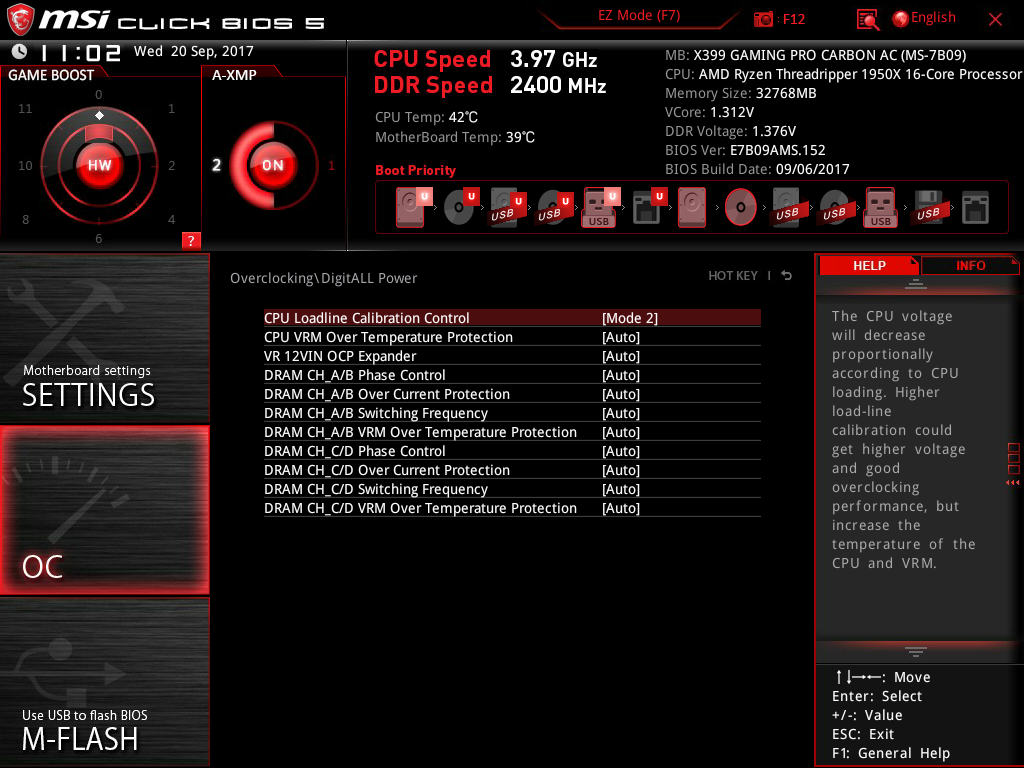
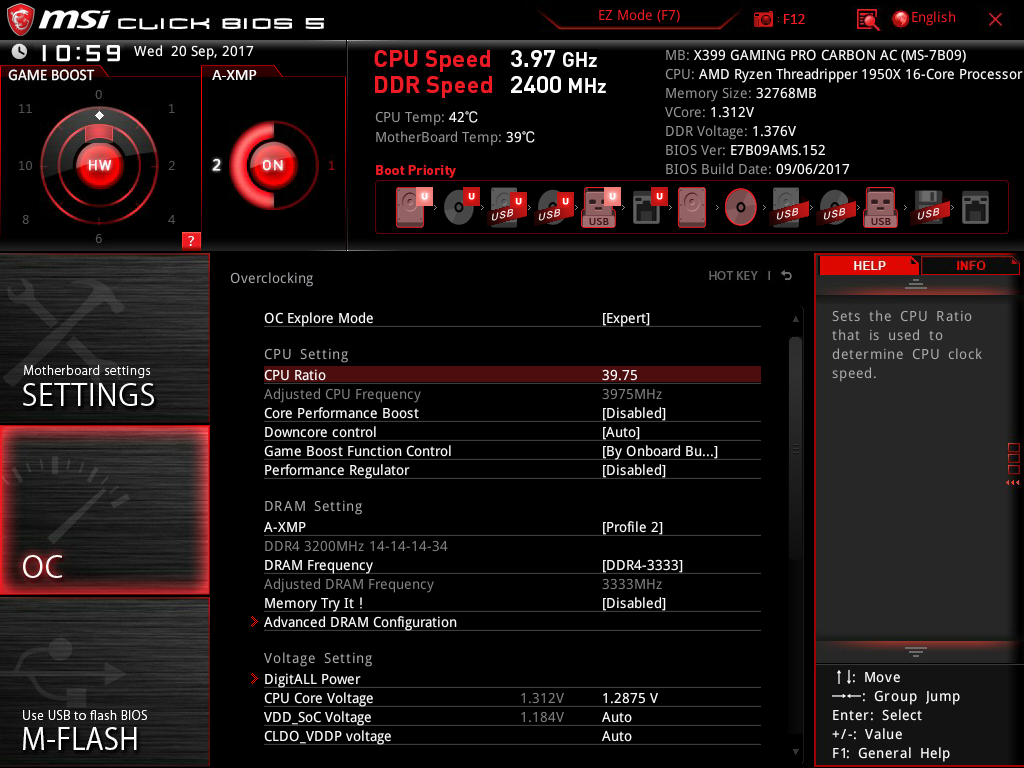
Given the cost of DDR4 right now, it makes sense to only populate each of the quad-channels with a single stick of RAM. If we reference our AM4 motherboard reviews, this type of configuration on the memory controllers for each CCX is optimal for overclocking with very little need for code enhancements. DDR4-3200 is our highest available XMP profile, and this system boots it right up without AMD’s advanced boot UEFI options. Even better, this DDR4 kit can also bump up to DDR4-3333 MHz without a single gander at the subtimings, voltages, or loadline settings.
Because AMD selectively bins out Ryzen die to populate the Threadripper lineup with lower voltages, it is safe to say that using the Ryzen 7 overclocking limits listed around the internet is not safe or practical for these MCMs. Keep temperatures within reason for the installed cooling solution and keep the voltages below 1.45V at the die for short-term wins. I don’t feel like burning an $800 hole in my pocket, so 1.2875V and 85°C Tdie will work just fine. Please follow AMD’s guidelines for overclocking.
Overclocking on this MSI X399 Gaming Pro Carbon AC is a breeze when using the latest UEFI. With the added CPU power connectors, it is clear that one must be prepared to pay the electric bill when running a Threadripper overclocked, as we are reporting wattage readouts upwards of 400W during Prime95 small FFT tests. Overall, this is great success for MSI.
Value, Conclusion & Teasers
We are going to use the Gaming Mode performance metrics of the MSI X399 Gaming Pro Carbon AC as a value baseline. Given the performance win and lower price of its competitor, the MSI X399 doesn’t win the numbers battle this time around. However, this board is still a worthy choice. The added Wi-Fi module is a great addition and worth probably $40 on its own.
Threadripper has proven to be a powerhouse compared to our X370/B350/Ryzen test bench. Unfortunately, where this system truly shines is in workloads that we just don’t heavily emphasize in our motherboard test suite. If you’re looking for more validation that Threadripper is for you, head on over to Paul’s Threadripper reviews, where he provides more analysis on the compute side and compares the chip against some of the Blue Team’s products.
MORE: AMD Ryzen Threadripper 1950X Review
MORE: AMD Ryzen Threadripper 1920X Review
MORE: AMD Ryzen Threadripper 1900X Review
As for TR4, it has options all around for I/O, expansion cards, USB, and storage that would cost an arm and a leg to fully populate. That loadout would also be unrealistic for a test bench, and our applications probably won’t support the RAM, power draw, or odd-ball drivers that might be required for true performance in a workstation system. Since every Threadripper provides the same I/O to the chipset, it is not as difficult to pick out a motherboard compared with other chipsets, where manufacturers can get squirrely with their wiring.
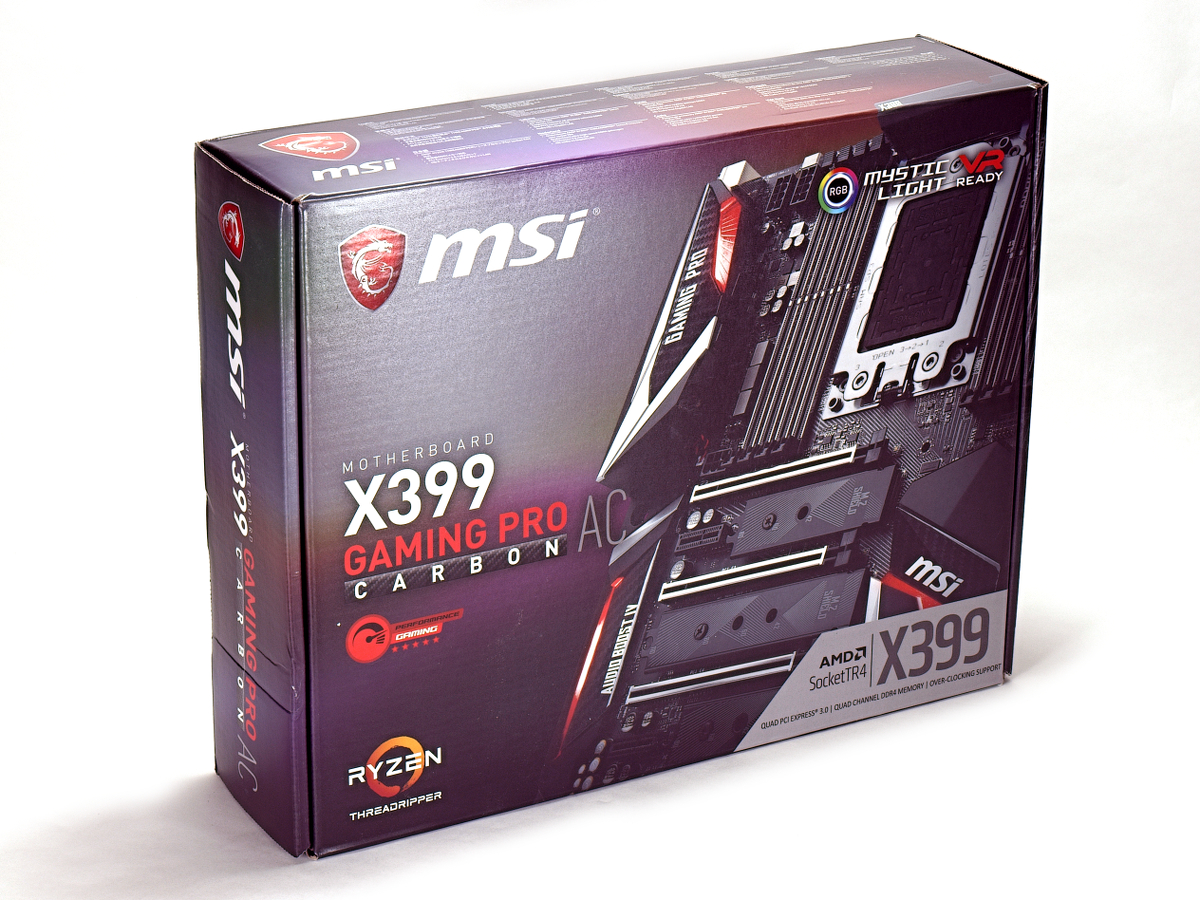
The MSI X399 Gaming Pro Carbon AC is a great choice for a reference system. Performance measurements are lower than our mysterious sample, but the layout, options, and the complete package line up perfectly with the definition of X399’s market. This board doesn’t pack a lot of flair, but we can appreciate the beauty of simplicity. Top it all off with a clean UEFI and an accessory kit that is fully functional, and this board earns the Tom’s Hardware Approved award.
MORE: Best Motherboards
MORE: How To Choose A Motherboard
MORE: All Motherboard Content
-
Jean-Yves At some point we are no longer in the 'gaming' game. And while the AMD Threadripper is advertised as a SUV of a chip, it is in fact a real truck. Real benchmark for real user are needed for these chips. Most of which will be used for video and CAD.Reply -
TheTerk Reply
I couldn't agree more. We reference Paul's articles throughout the review as he does a thorough analysis of this processor in its native habitat.20408537 said:At some point we are no longer in the 'gaming' game. And while the AMD Threadripper is advertised as a SUV of a chip, it is in fact a real truck. Real benchmark for real user are needed for these chips. Most of which will be used for video and CAD.
Unfortunately for me, I review motherboards and its difficult to compare chipset A against chipset B if B doesn't run some of the same applications well. Kind of like me running an APU against Threadripper's applications. As we continue to test more TR4 boards (and yes, they are coming) this baseline of data will prove useful as the test suite has a good compromise of technical requirements and runs fairly consistently across all review samples. If there's a specific workload you want to see, feel free to let me know!
