NEC EA244UHD 24-Inch Ultra HD Monitor Review
Users seeking maximum pixel density need look no further than a 24-inch Ultra HD screen. We recently looked at Dell’s UP2414Q. Today we’re testing NEC’s EA244UHD. It’s part of the company's business-class line but offers much more than its stablemates.
Why you can trust Tom's Hardware
Results: Grayscale Tracking And Gamma Response
Our grayscale and gamma tests are described in detail here.
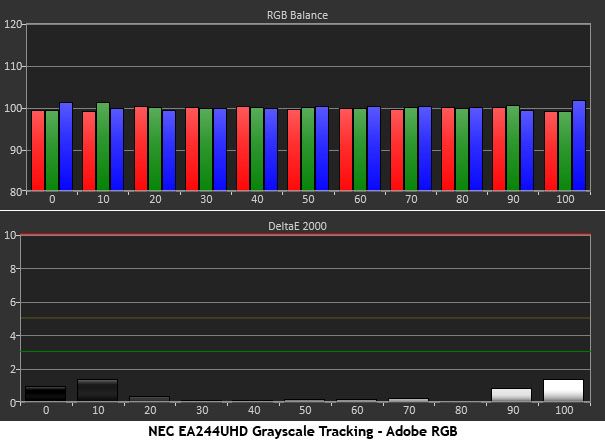
We were so surprised with our out-of-box result that we ran the test three more times to be sure our instruments were working properly. Check out the 50-percent level. Its error is only .07 Delta E!
Needless to say, there was nothing to gain by adjusting the RGB sliders, so we left them alone. It’s hard to imagine better performance.
Switching to the Adobe RGB mode produced a nearly identical chart.
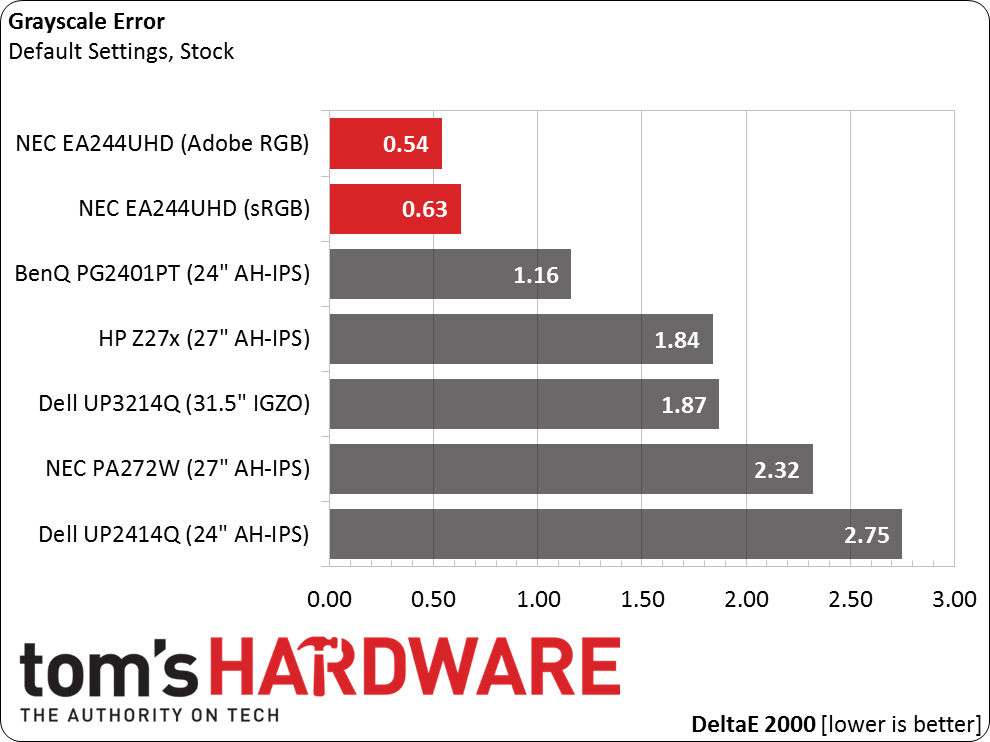
Here is our comparison group:
We thought BenQ's PG2401PT would be hard to beat in the stock performance tests (and it still is), but NEC raises the bar with its EA244UHD. None of the professional displays we’ve tested can measure under one Delta E without any adjustment.
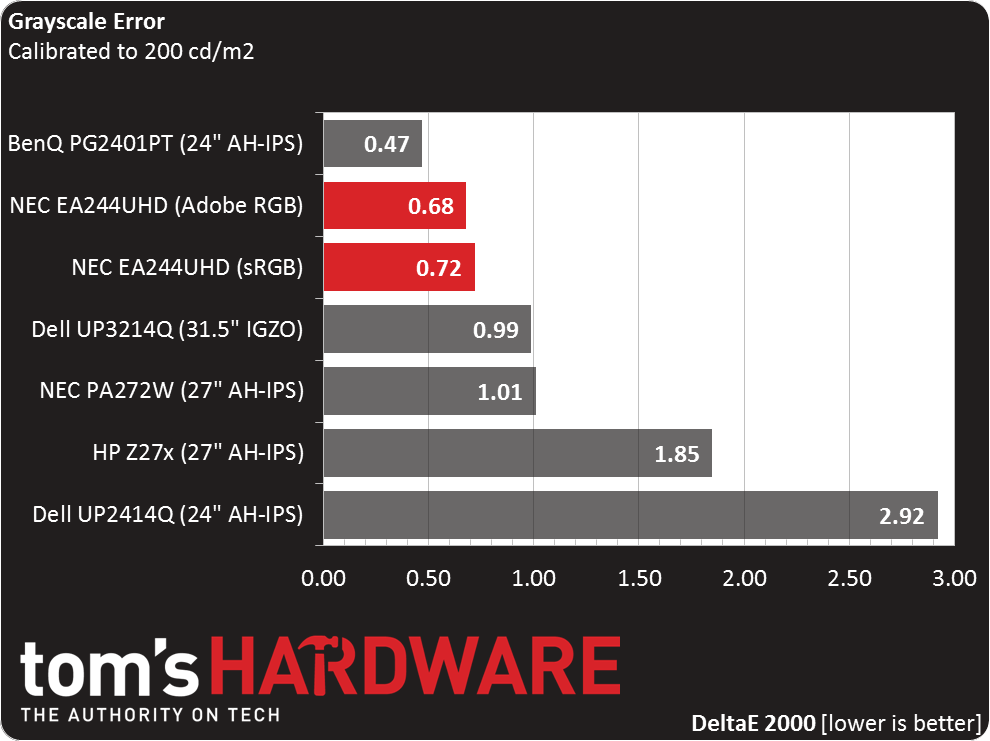
Changing the light output level actually increased the numbers a bit, though that could easily be the measurement tolerance of our i1Pro since all we adjusted was the backlight.
Get Tom's Hardware's best news and in-depth reviews, straight to your inbox.
Gamma Response
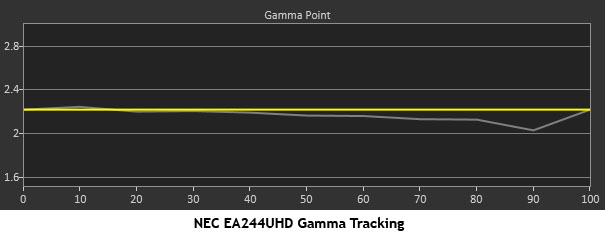
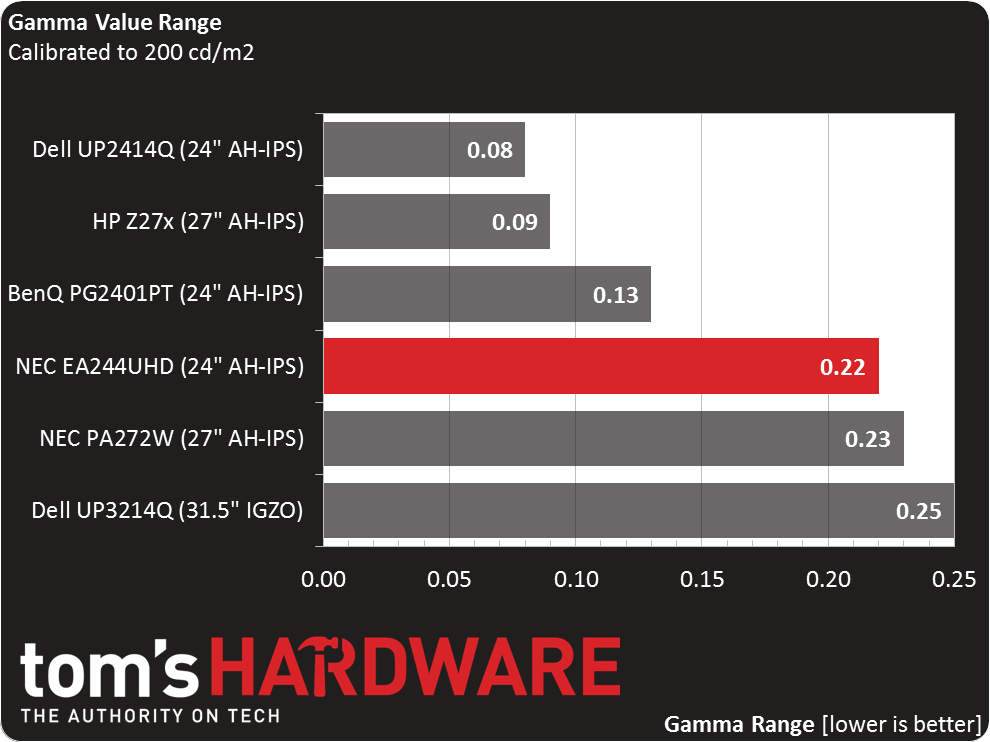
Gamma is the only metric that leaves a little room for improvement. There are no presets available, so what you see above is what you get, regardless of color mode. While good, small dips at 70, 80 and 90 percent spoil an otherwise perfect chart. Fortunately, you won’t be able to see the error in actual content.
Here is our comparison group again:
The tracking result is mid-pack because of the dip at 90-percent brightness. The EA244UHD’s main competitor, Dell’s UP2414Q, does a bit better in the gamma tracking test. In fairness, all of the screens we're presenting come close to perfect. It’s a very tight race.
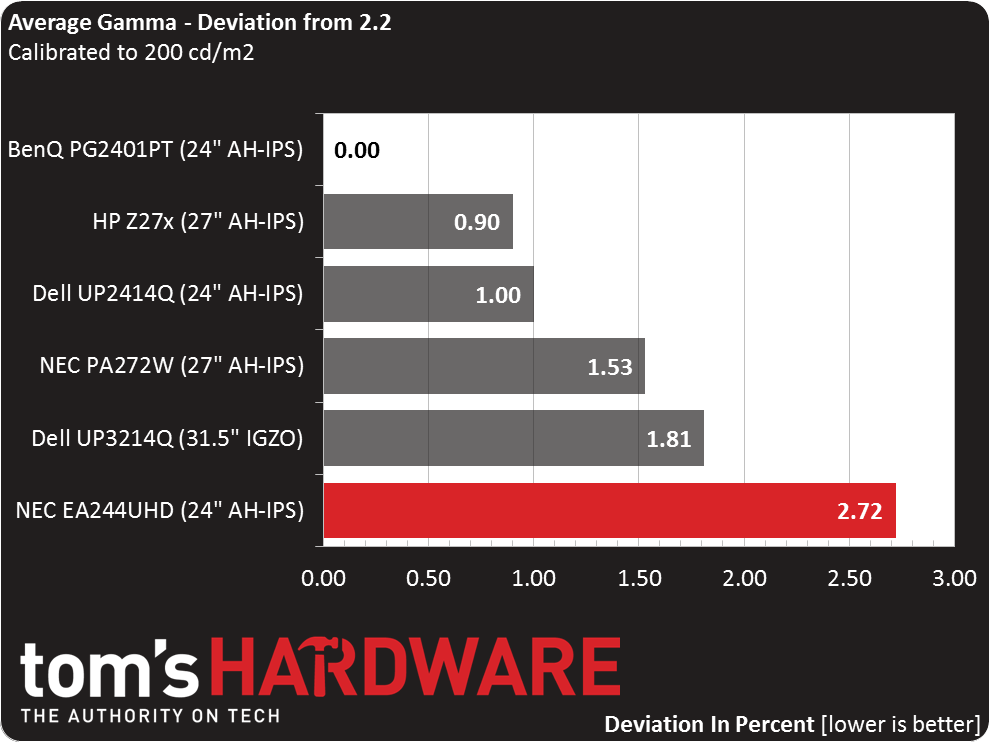
We calculate gamma deviation by expressing the difference from 2.2 as a percentage.
The 70- through 90-percent levels spoil the fun and bring average gamma down to 2.14. While you can’t correct this in the OSD, SpectraView can fix the problem or even change the gamma value. If you need BT.1886, a software calibration is the only way to get it.
Current page: Results: Grayscale Tracking And Gamma Response
Prev Page Results: Brightness And Contrast Next Page Results: Color Gamut And Performance
Christian Eberle is a Contributing Editor for Tom's Hardware US. He's a veteran reviewer of A/V equipment, specializing in monitors. Christian began his obsession with tech when he built his first PC in 1991, a 286 running DOS 3.0 at a blazing 12MHz. In 2006, he undertook training from the Imaging Science Foundation in video calibration and testing and thus started a passion for precise imaging that persists to this day. He is also a professional musician with a degree from the New England Conservatory as a classical bassoonist which he used to good effect as a performer with the West Point Army Band from 1987 to 2013. He enjoys watching movies and listening to high-end audio in his custom-built home theater and can be seen riding trails near his home on a race-ready ICE VTX recumbent trike. Christian enjoys the endless summer in Florida where he lives with his wife and Chihuahua and plays with orchestras around the state.
-
milkod2001 @alidanReply
That's no telly, it's professional desktop monitor, could be 27 or 30'' but would probably cost another 1000 or more extra. -
vincent67 Agree with alidan, at this density, pixels are wasted: you don't see more as you need to scale everything up.Reply
And, knowing the hardware you need to drive this resolution,, I don't see any interest except for some niches.
You need at least 44'' to exploit 4K. -
ribald86 @vincent67Reply
UHD is 2560x1440/2560x1600 - not 4k. Even if it was 4k, I don't see how you can say it is wasted. -
Textfield The problem with these high-DPI screens is that support for these displays is lacking in many modern OS's. Yes, support is getting better, as with Windows 8.1 and its better UI scaling, but even with good support in the OS's UI, you're still at the mercy of the apps you use, and many are terrible when it comes to high DPI, with some even failing to work properly.Reply
Retina is only useful when your programs provide good support for it. Otherwise it's just an annoyance. As an owner of a Yoga 2 Pro (13" 3200x1800), I can speak to this. I normally run my laptop in an upscaled 1920x1080 just to keep compatability.

