Display Testing Explained: How We Test PC Monitors
Our display benchmarks help you decide what monitor to put on your desktop.
Get Tom's Hardware's best news and in-depth reviews, straight to your inbox.
You are now subscribed
Your newsletter sign-up was successful
In all Tom’s Hardware monitor reviews, we briefly describe our testing methods. Our goal is to perform a series of benchmark tests that look at each aspect of video performance to help you decide which display is best for your needs.
You might be looking for the best gaming monitor or insist on the est 4K gaming monitor specifically. Perhaps you're looking for a general-use or professional monitor or crave the best HDR monitor you can afford. No matter what your intended use may be, we look to break down the various aspects of the screen that affect what you'll see in daily use.
We separate the tests into seven major categories: panel response, screen uniformity, contrast, grayscale, gamma, color, and HDR performance. In doing this, you can prioritize image parameters and decide which is most important before making your purchase.
In this detailed rundown, we’ll describe our testing methods, what equipment we use, and what the data means in terms of image quality and display usability.
Equipment
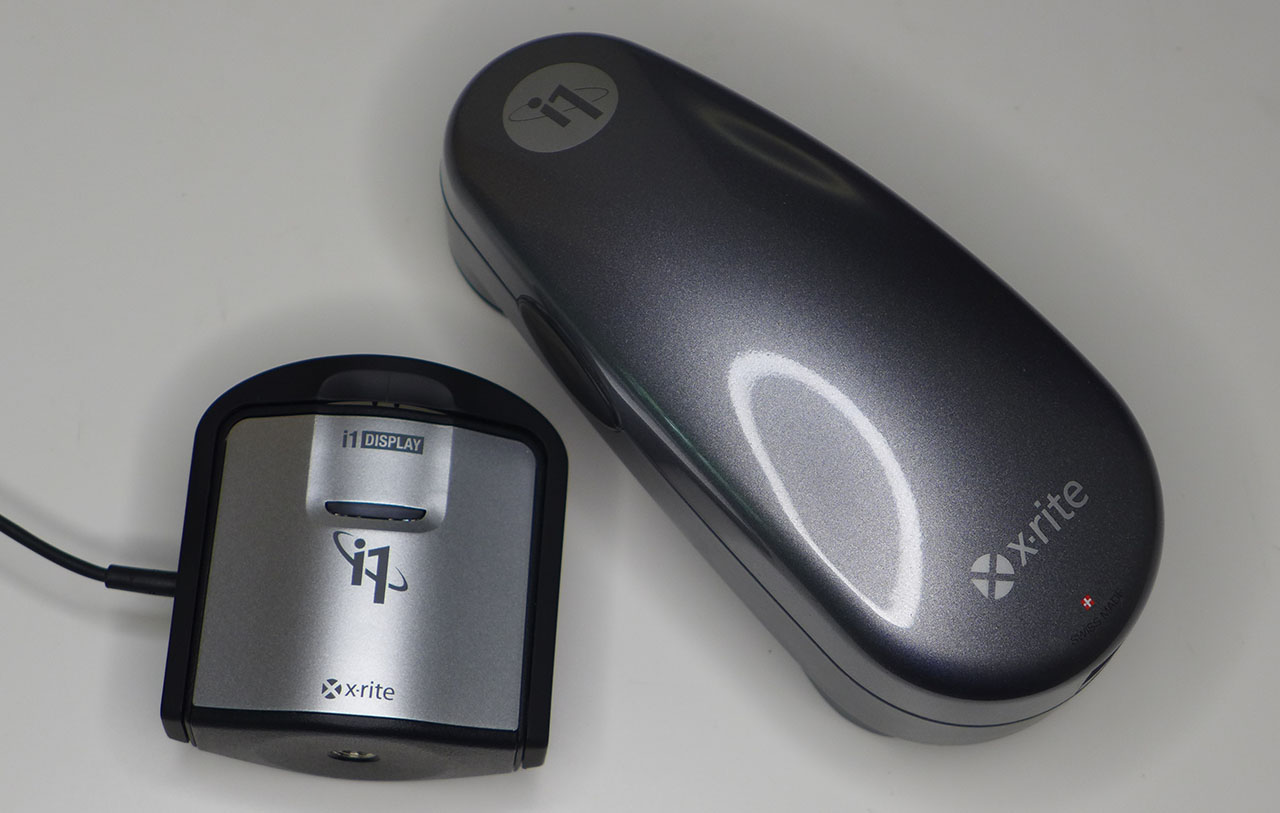
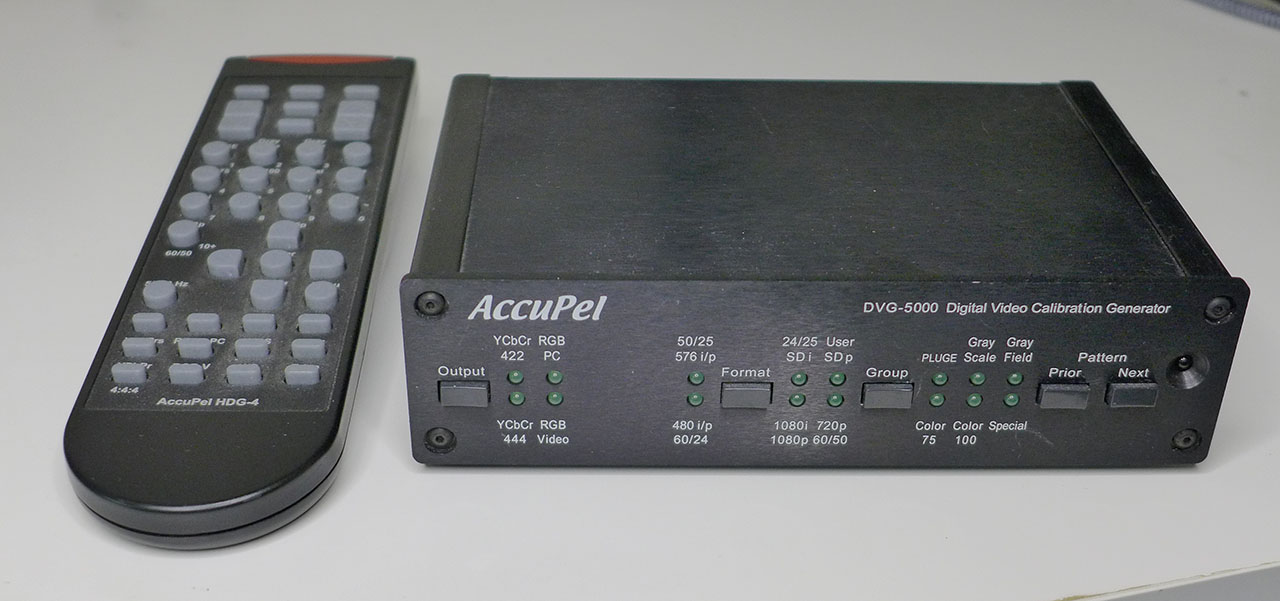
To measure and calibrate monitors, we use an X-Rite i1 Pro spectrophotometer, i1 Display Pro colorimeter, and the latest version of Portrait Displays Calman software. We get our test patterns from an AccuPel DVG-5000 signal generator via HDMI. An HD Fury Integral provides HDR signals. This approach removes graphics cards and drivers from the signal chain, allowing the display to receive true reference patterns.
Meters
The i1 Pro is very accurate and best-suited for measuring color on all types of displays, regardless of the backlight technology used. Since the i1 Display Pro is more consistent when measuring luminance, we use it for our contrast and gamma tests.
Accupel
The AccuPel DVG-5000 can generate all types of video signals at any resolution and refresh rate up to 1920 x 1080 (1080p or FHD) at 60 Hz. It can also display motion patterns to evaluate a monitor's video processing capabilities.
Get Tom's Hardware's best news and in-depth reviews, straight to your inbox.
On rare occasions that a monitor isn’t compatible with the AccuPel, we connect it directly to a PC and use Portrait Displays CalPC Client to generate patterns. All lookup tables are disabled here so that we can evaluate the product’s raw performance. Calibration is still performed with on-screen display (OSD) controls only. We don't use Direct Display Control unless there is no other way to correct errors.
Spears
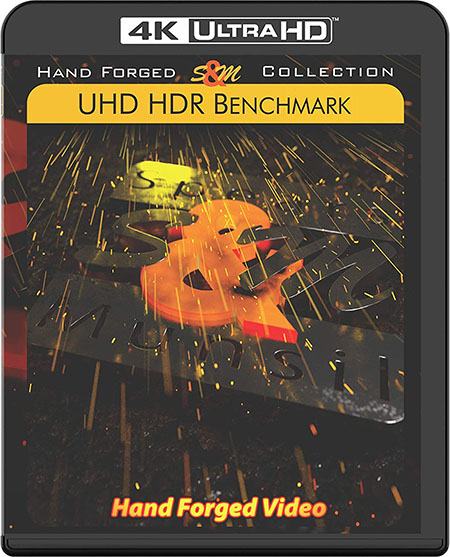
We can also generate 4K patterns in HDR10, HDR10+, and Dolby Vision formats by using a Panasonic DP-UB9000 Ultra HD Blu-ray Player connected via HDMI. It is a reference unit that supports all the latest HDR formats. The test disc is Spears & Munsil’s Ultra HD Benchmark, which has a plethora of static and moving patterns to test every aspect of display performance.
Methodology
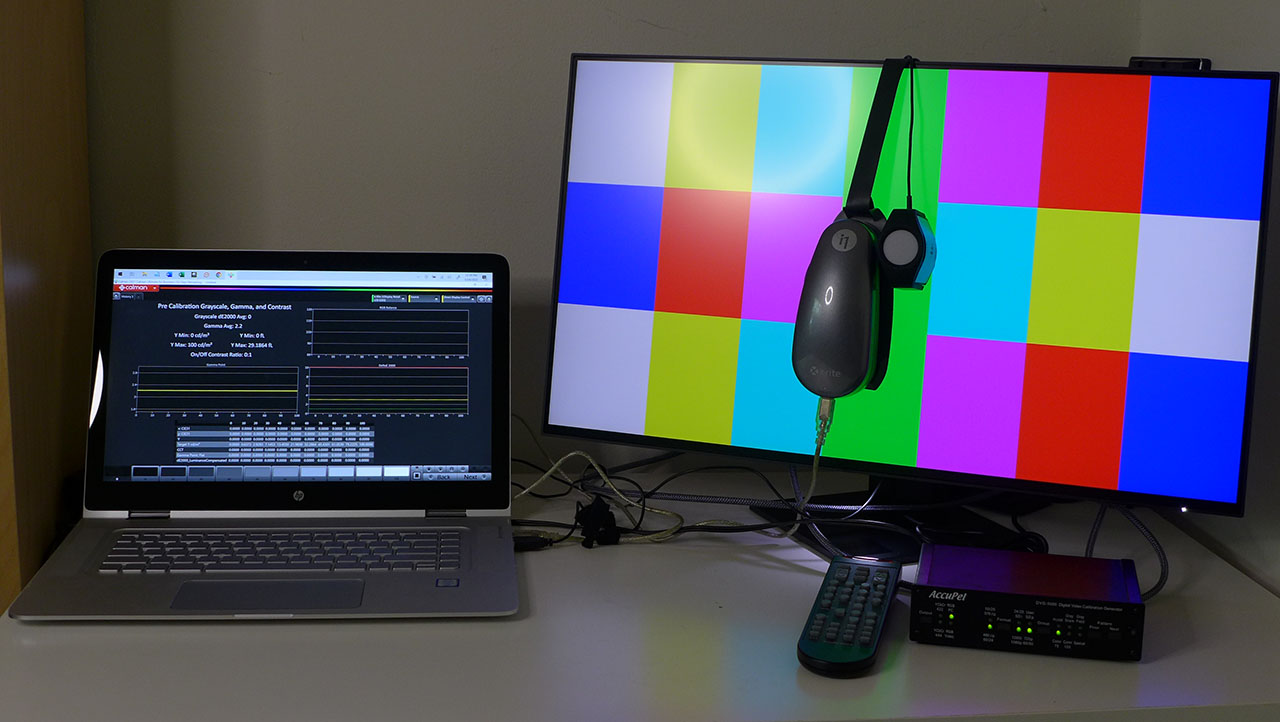
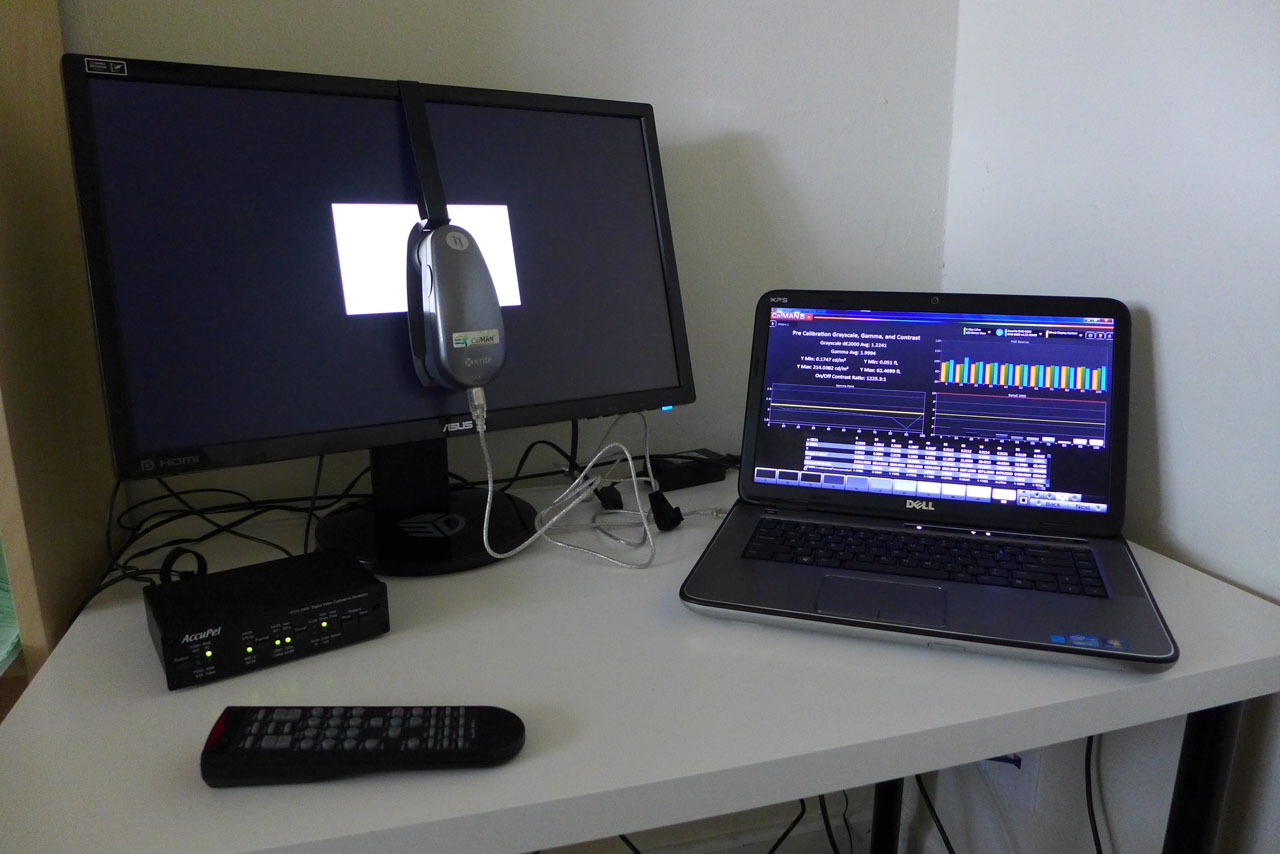
The i1 Pro or i1 Display is placed at the center of the screen (unless we’re measuring uniformity) and sealed against it to block out any ambient light. Calman controls the AccuPel pattern generator (bottom-right) through USB. In the photo below, Calman is running on the HP laptop on the left.
Our version of Calman Ultimate allows us to design all the screens and workflows to best suit the purpose at hand. To that end, we’ve created a display review workflow from scratch. This way, we can collect all the data we need with a concise and efficient set of measurements.
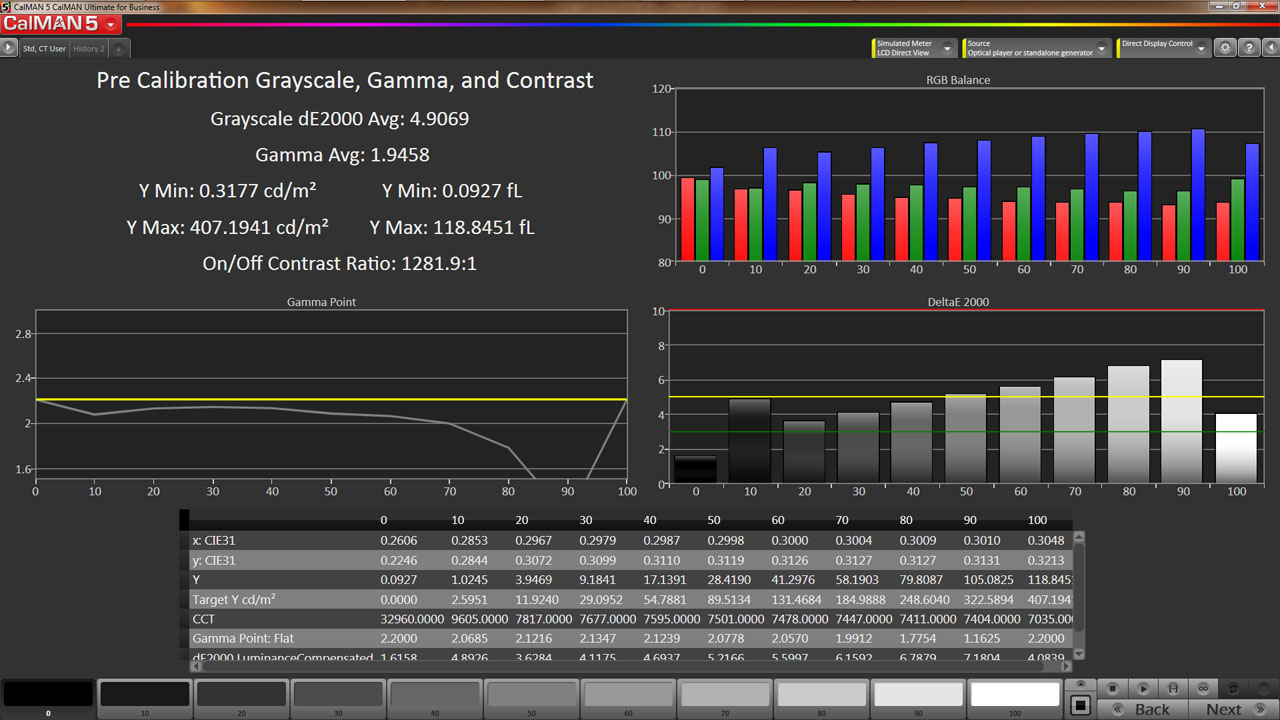
The charts show us the RGB levels, gamma response, and Delta E error for every brightness point from 0-100%. The table shows the raw data for each measurement. In the upper left are luminance, average gamma, Delta E, and contrast ratio values. This screen can also be used for individual luminance measurements. We simply select a signal level at the bottom (0-100%) and take a reading. Calman calculates things like contrast ratio and gamma for us.
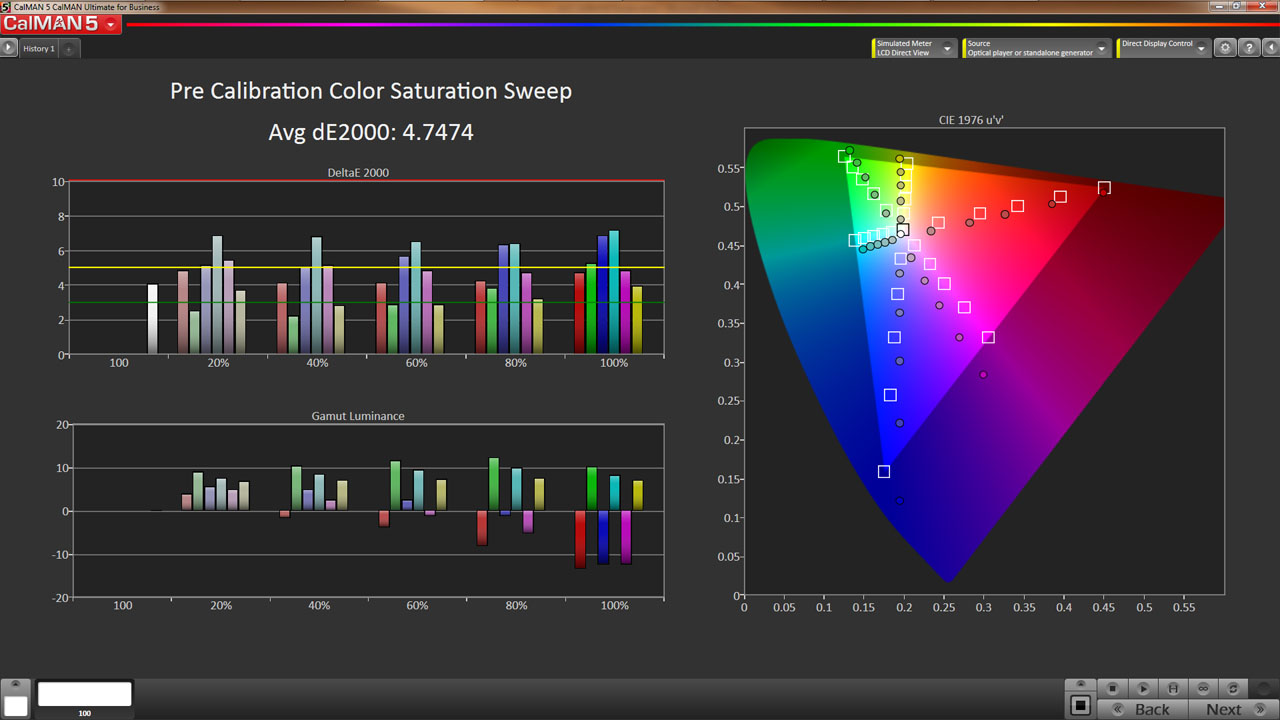
Every primary and secondary color is measured at 20, 40, 60, 80, and 100% saturation. The color saturation level is simply the distance from the white point on the CIE chart. You can see the targets moving out from white in a straight line. The farther a point is from center, the greater the saturation until you hit 100% at the edge of the gamut triangle. This shows us the display’s response at a cross-section of color points. Many monitors score well when only the 100% saturations are measured, but hitting the targets at lower saturations is more difficult and factors into our average Delta E value. This explains why our Delta E values are sometimes higher than those reported by other publications.
In the following pages, we’ll explain each group of tests in greater detail. Let’s take a look.
Current page: Equipment, Setup and Methodology
Next Page Response, Input Lag, Viewing Angles & Uniformity
Christian Eberle is a Contributing Editor for Tom's Hardware US. He's a veteran reviewer of A/V equipment, specializing in monitors. Christian began his obsession with tech when he built his first PC in 1991, a 286 running DOS 3.0 at a blazing 12MHz. In 2006, he undertook training from the Imaging Science Foundation in video calibration and testing and thus started a passion for precise imaging that persists to this day. He is also a professional musician with a degree from the New England Conservatory as a classical bassoonist which he used to good effect as a performer with the West Point Army Band from 1987 to 2013. He enjoys watching movies and listening to high-end audio in his custom-built home theater and can be seen riding trails near his home on a race-ready ICE VTX recumbent trike. Christian enjoys the endless summer in Florida where he lives with his wife and Chihuahua and plays with orchestras around the state.
-
dputtick Hi! For the input lag tests for monitors with refresh rates greater than 60hz, do you test multiple times and take the average (to rule out variability coming from the USB driver, buffering in the GPU, etc)? Have you investigated how much latency all of that adds? Would be nice to have an apples-to-apples comparison with the tests done via the pattern generator. Also curious if you've looked into getting a pattern generator that pushes more than 60hz, or if such a thing exists. Thanks so much for doing all of these tests!Reply
