NVIDIA vs. 3Dfx - TNT vs. the Voodoos
Expendable Frame Rate Diagrams
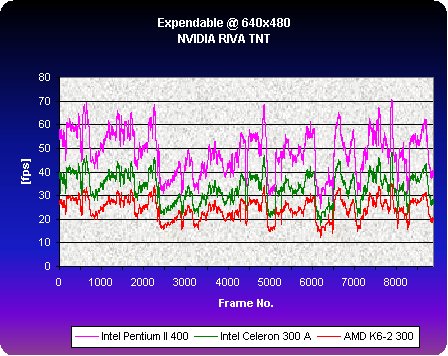
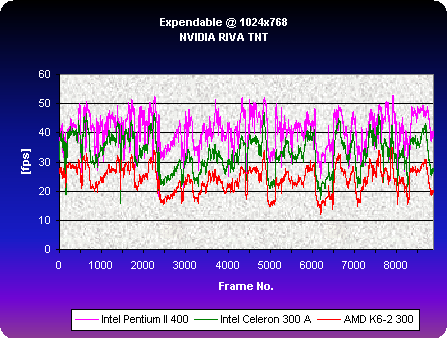
The following graphs shall give you a better idea about what happens when a game is playing and how the frame rate is changing.
You can see that the shape of the graph is always the same, but amplitude and offset change from CPU to CPU.
As I discussed before, there is something strange with the run of the Pentium II 400. You can see that the purple graph is a lot more fuzzy and missing some of the peaks. Something around 50 fps seems to clip the frame rate. I wonder if NVIDIA will have an explanation for it.
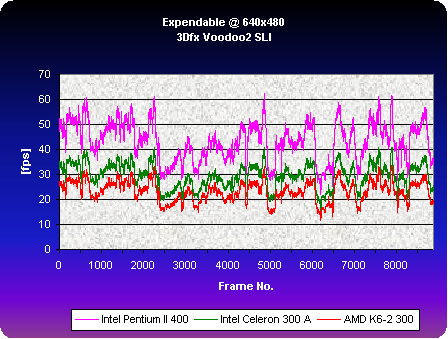
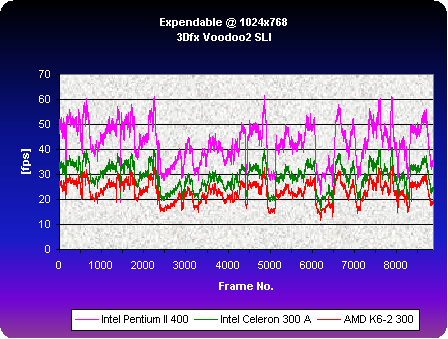
The graphs of the 3Dfx chips look all the same, so that I'll show you the ones of Voodoo2 SLI.
The graph of Voodoo2 SLI for 640x480 is hardly any different to the graph of TNT at the same resolution. This is because the CPU is limiting the frame rate.
If you have a close look you will see that this graph looks identical to the one above. Voodoo2 SLI does not have any problems at 1024x768 with a Pentium II 400, unlike TNT.
Summary Expendable Results
Get Tom's Hardware's best news and in-depth reviews, straight to your inbox.
The 3Dfx products have hardly got any advantage over TNT under Direct3D as long as the game is CPU intensive. In some cases TNT is even faster than the much more expensive double Voodoo2 configuration. Voodoo2 SLI does still have a slight edge over TNT at high resolutions, but this can hardly justify the price difference between the two.
Current page: Expendable Frame Rate Diagrams
Prev Page Expendable Benchmark Results Next Page Incoming Benchmark Results-
Pure nostalgia. Tom's Hardware is awesome for keeping 14 year old articles around, I read the whole thing and it brought back memories.Reply


