Nvidia GeForce GTX 260/280 Review
Vertex/Pixel Shading Performance
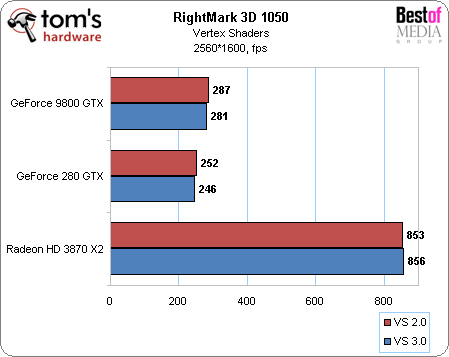
Since they should be able to draw some improvement from the near-doubling of the number of ALUs, first let’s see how the cards perform with the Rightmark Vertex Shaders test (all with the same performance).

Surprisingly, and despite different adjustments and successive tests, the GTX 280 not only posted poorer performance than the 9800 GTX, but fell 12% short! Nvidia also got the same results, and was able to change that only by enabling 4X antialiasing – surprising for a geometry test. We should note, however, that while processing power (and consequently transformation power) has increased strongly, the setup engine hasn’t been changed. As with the 9800 GTX, it’s capable of generating only one triangle per cycle. The latter’s frequency advantage (675 MHz compared to 600 MHz), might explain the difference.

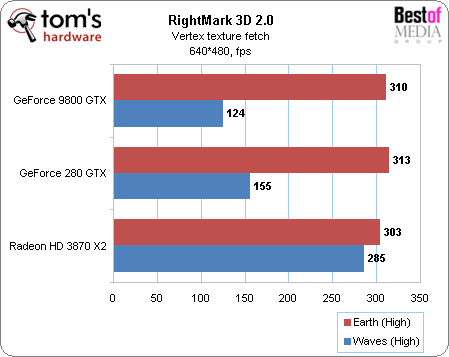
As usual with RightMark 2.0, the first shader showed no improvement with the new card, whereas the second showed a 25% gain.
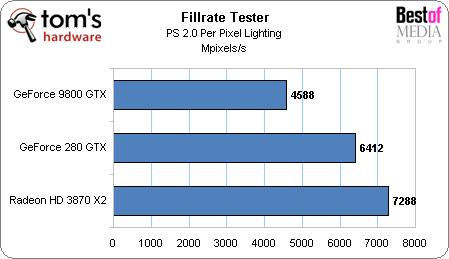
Though we’ve already devoted a lot of space to advanced pixel shaders via the preceding tests (arithmetic in particular), let’s look at simpler shaders, with the Fillrate Tester per-pixel lighting test we’ve been using for four years now.

We’ve come a long way since then! However, we really could have expected more than only a 40% gain from the GTX 280. Similarly, and without showing all the extensive results for ShaderMark (which uses Pixel Shader 3.0), the increases remain at between 20 and 26% for the last six shaders, and it did no better than 43%.
All the results are surprising, and show the gap between the theoretical increase in power (which should show up with Vertex and Pixel shaders, even old ones, in particular) and the actual gains in applications. We’d bet that the drivers aren’t fully optimized yet, and don’t forget that even when using a very specific benchmark, it’s still difficult to isolate a specific aspect without being influenced by the rest of the pipeline, especially with current architectures.
Get Tom's Hardware's best news and in-depth reviews, straight to your inbox.
Current page: Vertex/Pixel Shading Performance
Prev Page Fillrate Tester Results Next Page Specifications: Better!-
Lunarion what a POS, the 9800gx2 is $150+ cheaper and performs just about the same. Let's hope the new ATI cards coming actually make a differenceReply -
foxhound009 woow,.... that's the new "high end" gpu????Reply
lolz.. 3870 x2 wil get cheaper... and nvidia gtx200 lies on the shelves providing space for dust........
(I really expectede mmore from this one... :/ ) -
thatguy2001 Pretty disappointing. And here I was thinking that the gtx 280 was supposed to put the 9800gx2 to shame. Not too good.Reply -
cappster Both cards are priced out of my price range. Mainstream decently priced cards sell better than the extreme high priced cards. I think Nvidia is going to lose this round of "next gen" cards and price to performance ratio to ATI. I am a fan of whichever company will provide a nice performing card at a decent price (sub 300 dollars).Reply -
njalterio Very disappointing, and I had to laugh when they compared the prices for the GTX 260 and the GTX 280, $450 and $600, calling the GTX 260 "nearly half the price" of the GTX 280. Way to fail at math. lol.Reply -
NarwhaleAu It is going to get owned by the 4870x2. In some cases the 3870x2 was quicker - not many, but we are talking 640 shaders total vs. 1600 total for the 4870x2.Reply -
MooseMuffin Loud, power hungry, expensive and not a huge performance improvement. Nice job nvidia.Reply -
compy386 This should be great news for AMD. The 4870 is rumored to come in at 40% above the 9800GTX so that would put it at about the 260GTX range. At $300 it would be a much better value. Plus AMD was expecting to price it in the $200s so even if it hits low, AMD can lower the price and make some money.Reply -
vochtige i think i'll get a 8800ultra. i'll be safe for the next 5 generations of nvidia! try harder nv crewReply