Nvidia GeForce GTX 260/280 Review
Scalable Processor Array
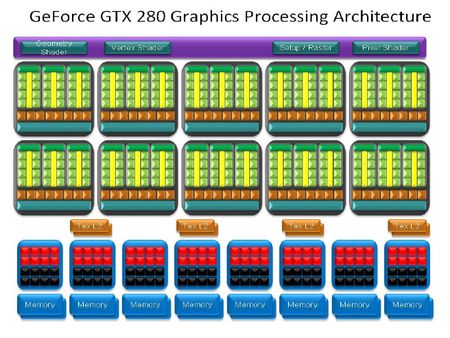
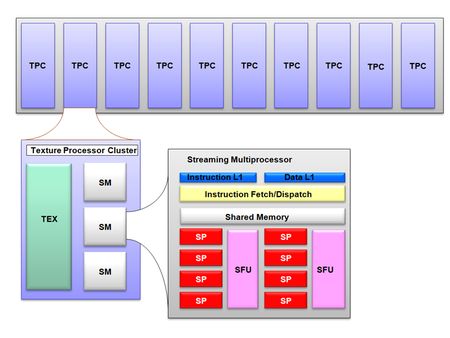
There’s no big change in the architecture, which is still based on what Nvidia calls Scalable Processor Array (or Streaming Processor Array, depending on whom you ask). The G80’s SPA was organized like this:
Eight TPCs (Texture Processor Clusters), each equipped with a texture unit and two Streaming Multiprocessors (SM). With the GT200, Nvidia has increased the number of units to 10 TPCs, each still equipped with a texture unit, but now with three multiprocessors.
This change is evidence of the orientation of modern shaders, which put the accent on arithmetic instructions.The texture units of each TPC use the same model as those used for the G84 and G92 – there’s as much address capacity as filtering capacity, unlike the G80, which had twice as much filtering capacity as address capacity. So, in a simple filtering mode with RGBA8 (nearest or bilinear) textures, the texture units of the G84/G92/GT200 have twice the performance of the G80. With more evolved filtering modes or RGBA16 textures, the change makes no difference.
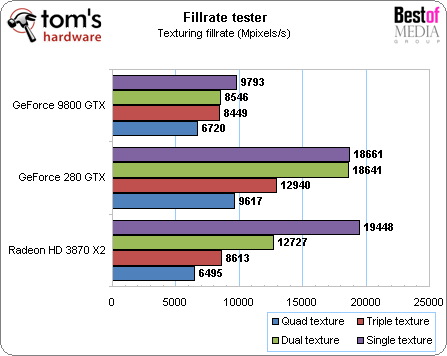
In an improvement that’s more specific to the GT200, Nvidia says they’re now using a more effective scheduler to manage texturing operations, which is supposed to come closer to the peak performance of a G92. Let’s check that using Fillrate Tester:

The move up from 64 to 80 texture units, coupled with the difference in GPU frequency, should give the GTX 280 an advantage of only 11% over the 9800 GTX. Yet we measured 43% with quad texturing, and up to 118% with dual texturing! The improvement in the scheduler alone can’t explain that difference. However, the increase in the number of ROPs (doubled) also plays a part. In any event, it’s clear that the GTX 280 is much closer to the theoretical fill rate values in single or dual texturing (97%) than to the 9800 GTX (between 80 and 91%), meaning that the improvements Nvidia has made there have paid off in practical terms. As we explained previously, the AMD bi-GPU board, which also has a faster clock frequency than Nvidia’s, is only 32% behind the GTX 280 in quad texturing.
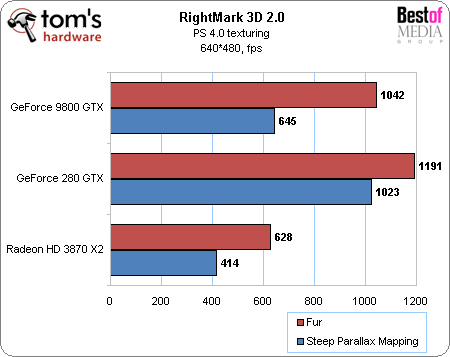
Now let’s see what happens with the RightMark3D 2.0 PS 4.0 texturing test, which tests texture lookups.

The result for the first shader (Fur) is surprising: a 14% gain, which isn’t a lot given the optimizations of blending, geometry shaders and fill rate, all again dependent on the shader implementation. On the other hand the 59% gain observed with Steep Parallax Mapping is more spectacular, in line with expectations, and very promising.
Get Tom's Hardware's best news and in-depth reviews, straight to your inbox.
Current page: Scalable Processor Array
Prev Page The Architecture in Detail Next Page Reworked Streaming Multiprocessors-
Lunarion what a POS, the 9800gx2 is $150+ cheaper and performs just about the same. Let's hope the new ATI cards coming actually make a differenceReply -
foxhound009 woow,.... that's the new "high end" gpu????Reply
lolz.. 3870 x2 wil get cheaper... and nvidia gtx200 lies on the shelves providing space for dust........
(I really expectede mmore from this one... :/ ) -
thatguy2001 Pretty disappointing. And here I was thinking that the gtx 280 was supposed to put the 9800gx2 to shame. Not too good.Reply -
cappster Both cards are priced out of my price range. Mainstream decently priced cards sell better than the extreme high priced cards. I think Nvidia is going to lose this round of "next gen" cards and price to performance ratio to ATI. I am a fan of whichever company will provide a nice performing card at a decent price (sub 300 dollars).Reply -
njalterio Very disappointing, and I had to laugh when they compared the prices for the GTX 260 and the GTX 280, $450 and $600, calling the GTX 260 "nearly half the price" of the GTX 280. Way to fail at math. lol.Reply -
NarwhaleAu It is going to get owned by the 4870x2. In some cases the 3870x2 was quicker - not many, but we are talking 640 shaders total vs. 1600 total for the 4870x2.Reply -
MooseMuffin Loud, power hungry, expensive and not a huge performance improvement. Nice job nvidia.Reply -
compy386 This should be great news for AMD. The 4870 is rumored to come in at 40% above the 9800GTX so that would put it at about the 260GTX range. At $300 it would be a much better value. Plus AMD was expecting to price it in the $200s so even if it hits low, AMD can lower the price and make some money.Reply -
vochtige i think i'll get a 8800ultra. i'll be safe for the next 5 generations of nvidia! try harder nv crewReply


