Samsung 850 SSD Review
Why you can trust Tom's Hardware
128GB Class Performance Testing
Comparison Products
Samsung has dominated the 128GB-class for a long time. The Samsung 850 EVO and 850 Pro models came to market in July 2014, and the other companies still have not caught up with Samsung's three-year-old technology. The truth is they never will.
Most companies can't produce a solid 128GB-class SSD because the flash fabs have abandoned low-capacity NAND die. The desire to increase SSD capacity (and lower prices) has pushed die capacity to 256Gbit, 384Gbit, and 512Gbit. These denser die result in reduced parallelism at the device level, which hurts SSD performance. With a 512Gbit die, it only takes two die to make a 128GB SSD! That's two slivers of silicon about the size of your pinky nail, and denser die are coming soon.
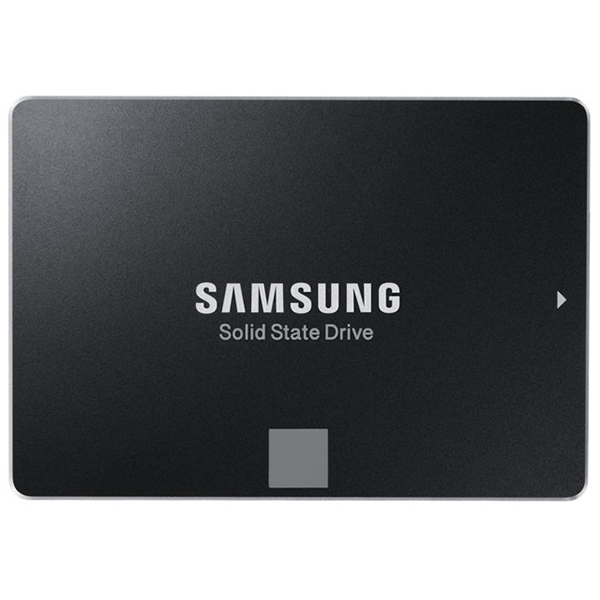
Samsung has three modern product series with 128GB-class SSDs: the new 850 120GB we're testing, the 850 EVO 120GB, and the 750 EVO 120GB. Samsung retired the 850 Pro 128GB long ago. You can still buy it through some retailers that have old stock, but the prices are nearly as high as the 850 Pro 256GB. We didn't use the 850 Pro in our results, but we did include the 850 EVO and 750 EVO.
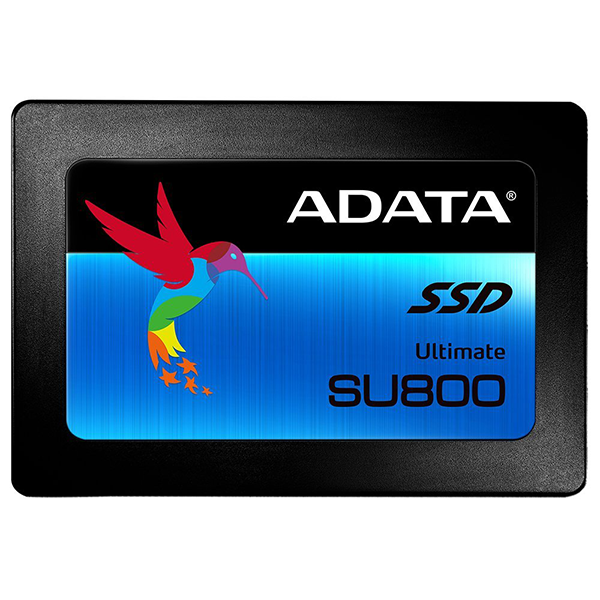
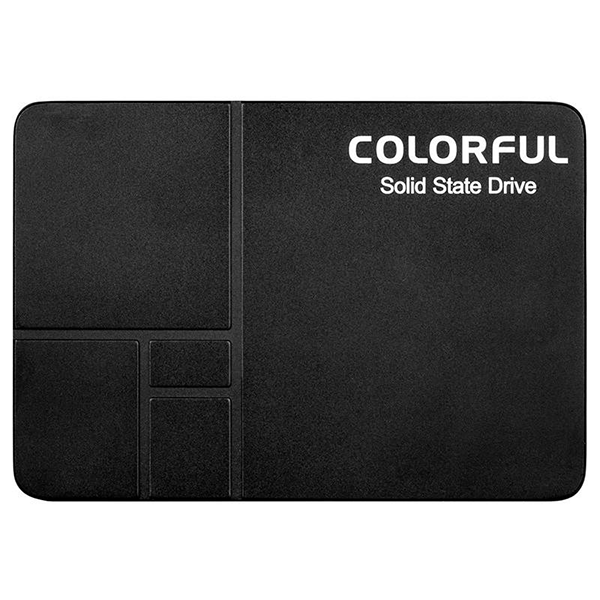
Adata included a 128GB SSD when it sent us the SU800 series in December 2016. It features Micron 384Gbit 3D TLC NAND with an SMI SM2258 controller. We haven't reviewed the Colorful SL300 yet, but it is unique. Samsung's flash is widely regarded as the best in the industry, but the company doesn't sell it to third-party SSD manufacturers. Colorful found a clever way of getting Samsung NAND into their SSD—they used UFS-packaged Samsung flash. We usually find this type of NAND in cell phones, but the pins on the package allow companies to interface with the flash.
The SanDisk Z410 120GB and Toshiba TL100 120GB come from the industry's first DRAMless SSD roundup that we published in February 2017. These drives come with the three words you never want to hear together: DRAMless, SATA, and 2D TLC NAND.
Sequential Read Performance
To read about our storage tests in-depth, please check out How We Test HDDs And SSDs. We cover four-corner testing on page six of our How We Test guide.
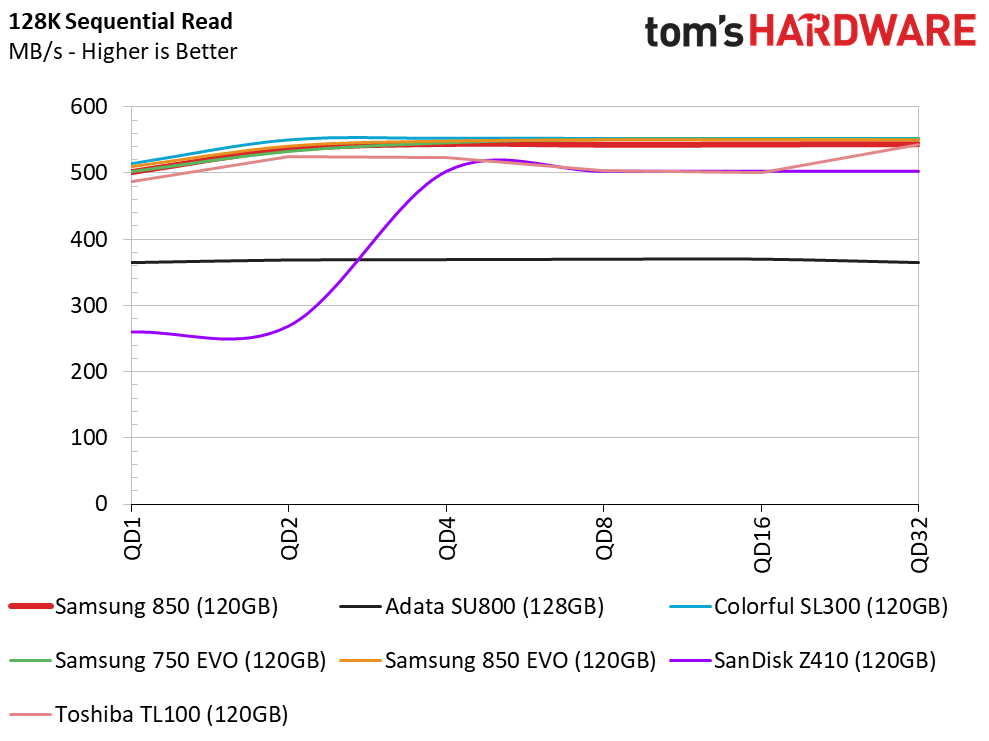
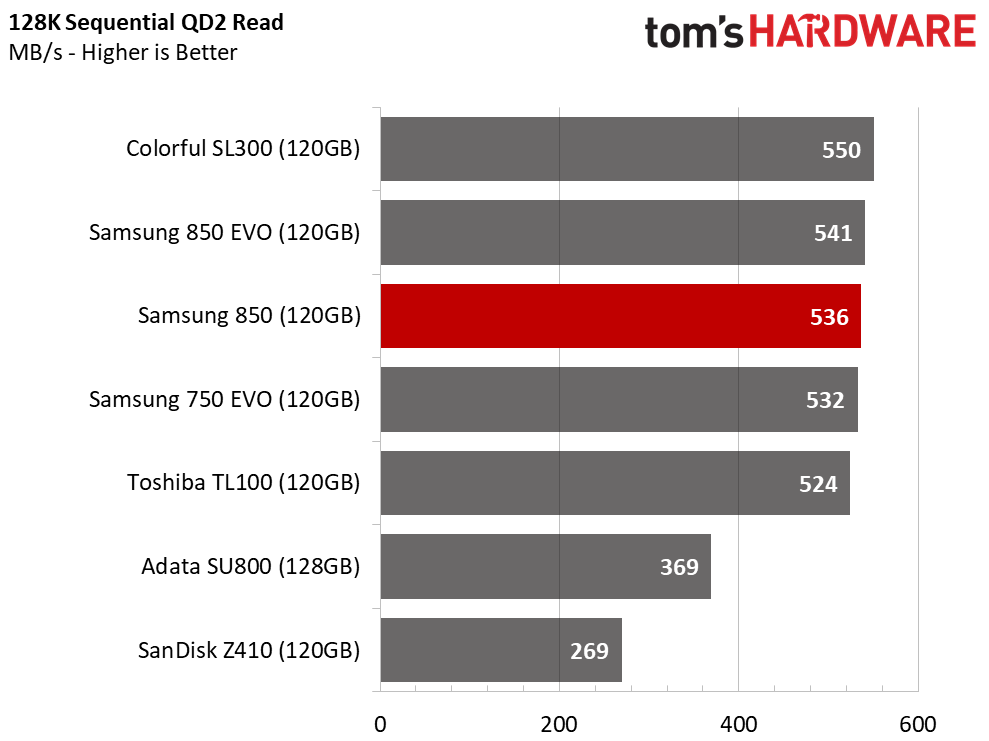
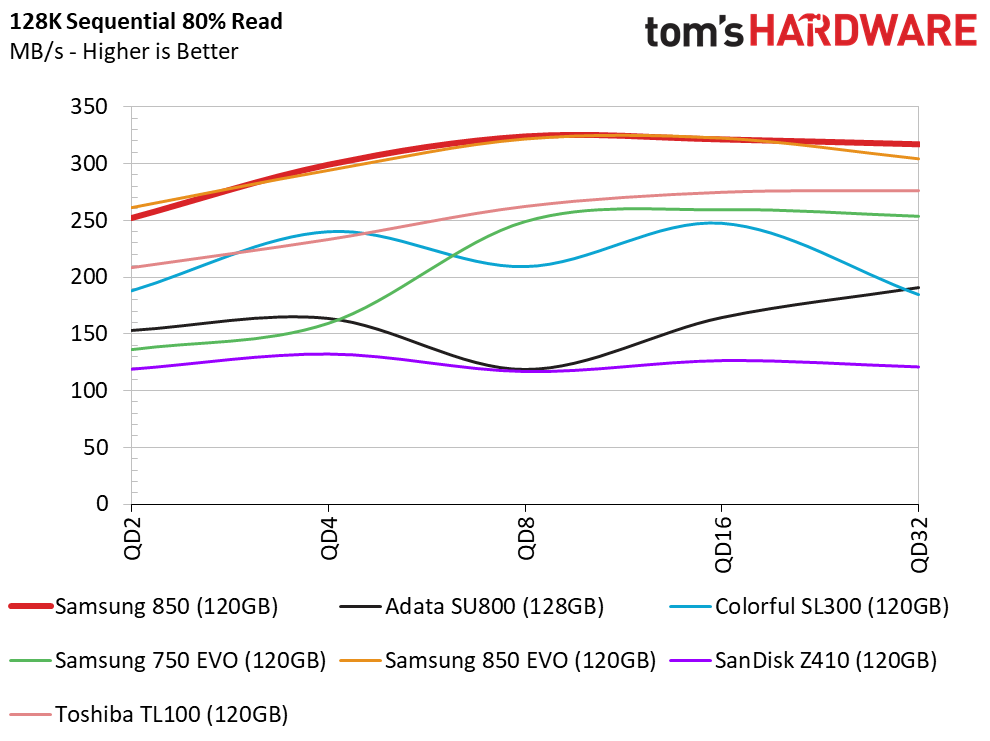
Faster NAND can fill in the gap left open by the reduced parallelism from high-capacity NAND die. The sequential read performance line chart shows consistent performance as we ramp up the queue depth. The 850 lands between the 850 EVO and 750 EVO 120GB drives at QD2.
Get Tom's Hardware's best news and in-depth reviews, straight to your inbox.
Sequential Write Performance
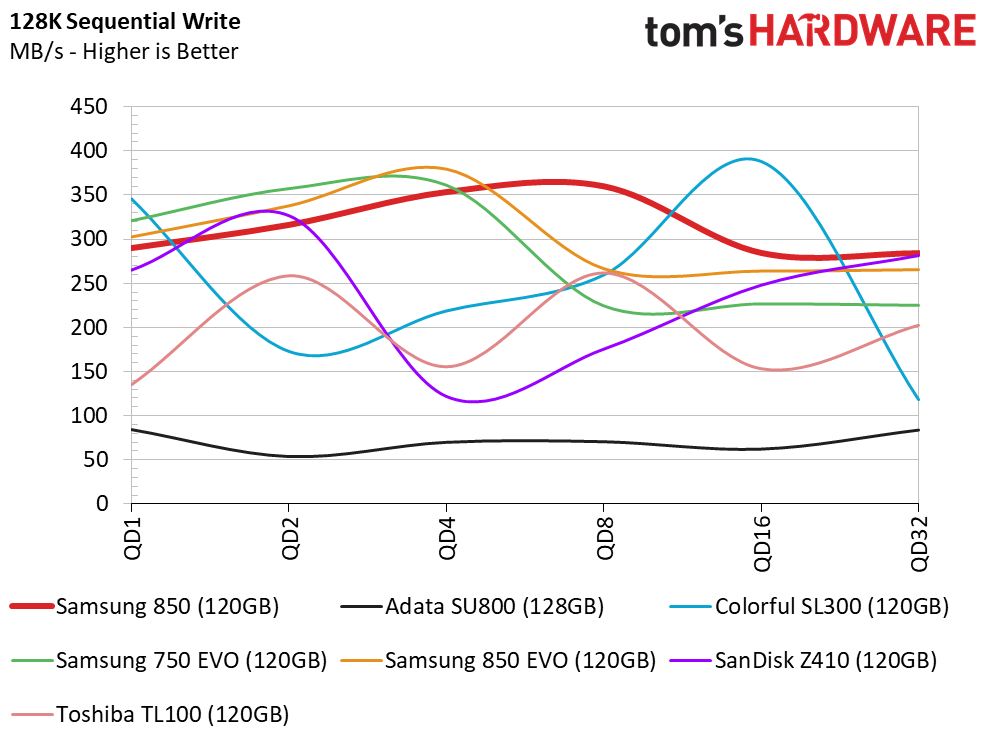
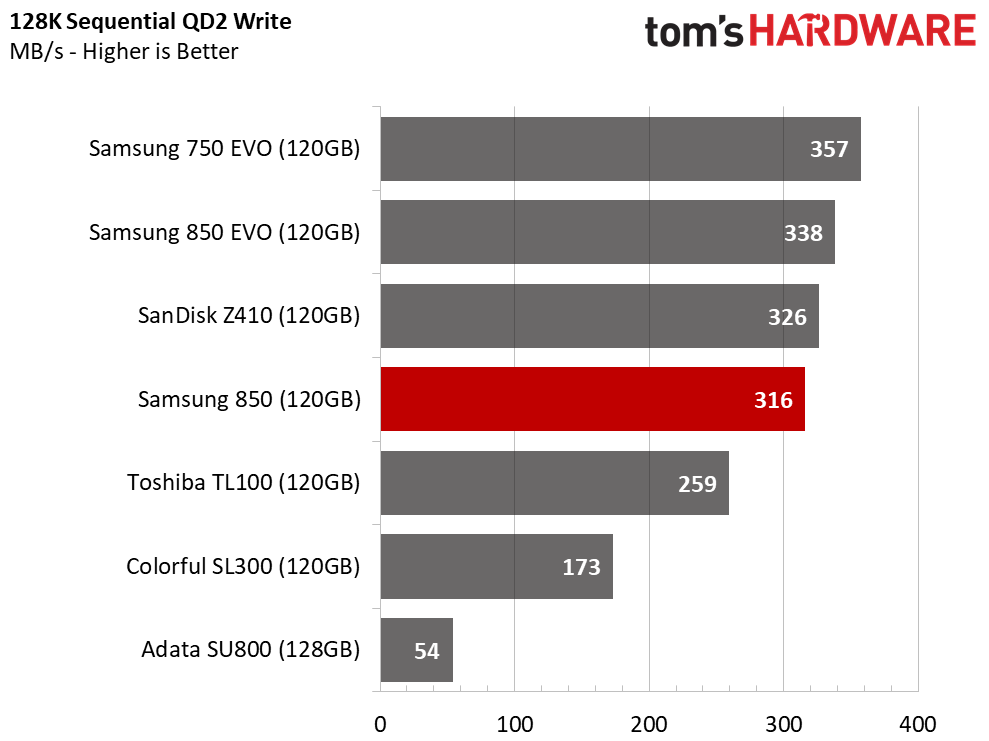
All the products in our test use 3-bit per cell (TLC) flash. Low parallelism combined with TLC NAND results in a lot of variation due to the reliance on SLC caching. We're also dealing with inherently low native TLC speeds after we saturate the SLC buffer. Samsung's V-NAND SSDs have historically been less susceptible to severe performance loss from these issues, but the 120GB model bucks the trend set by the larger drives.
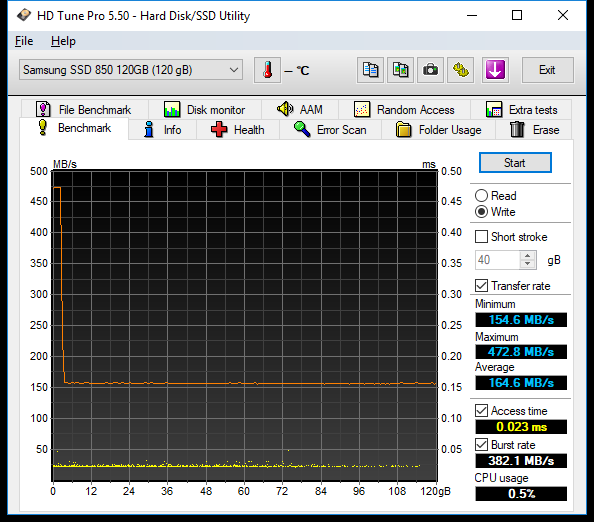
The 850 120GB suffers because it has a smaller SLC buffer than its high-capacity siblings. Writing 128KB sequential data to the SLC-programmed buffer, which is roughly 3GB, nets 475 MB/s of throughput. That quickly drops down to just over 160 MB/s once we saturate the small buffer and the traffic lands in the native TLC NAND. Increasing the queue depth doesn't increase performance, it only adds latency.
Random Read Performance
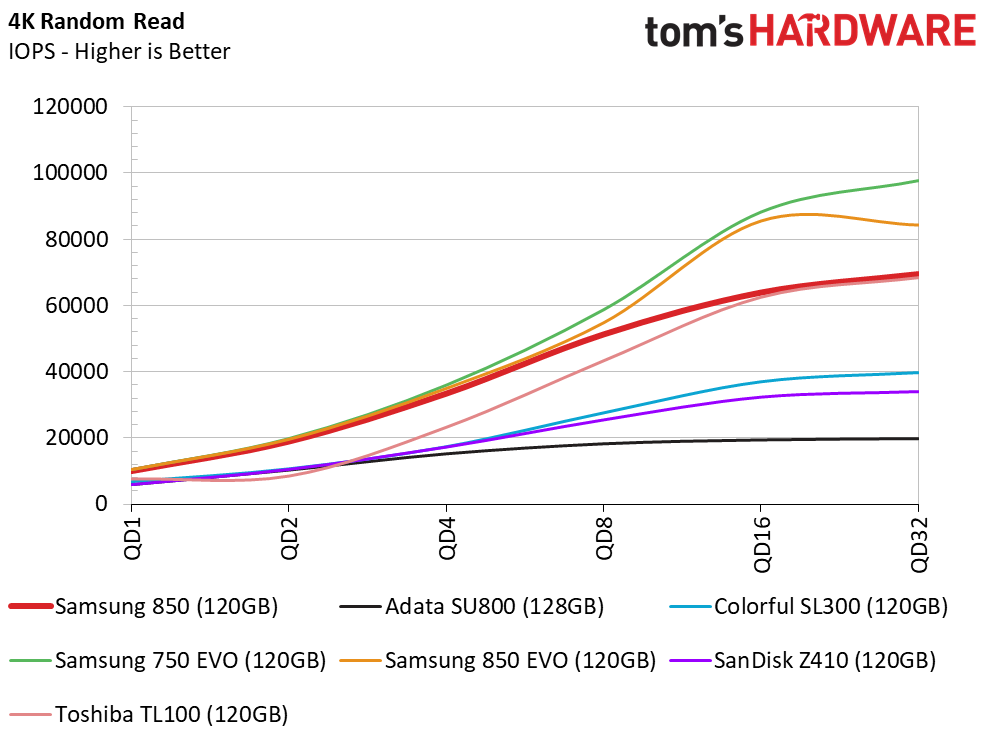
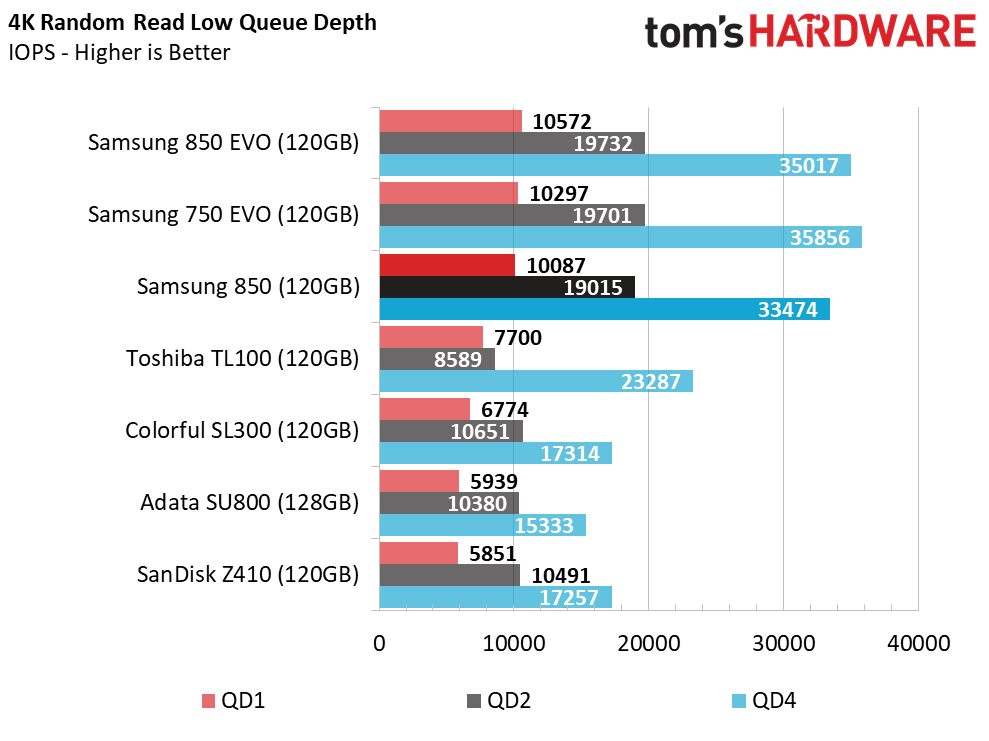
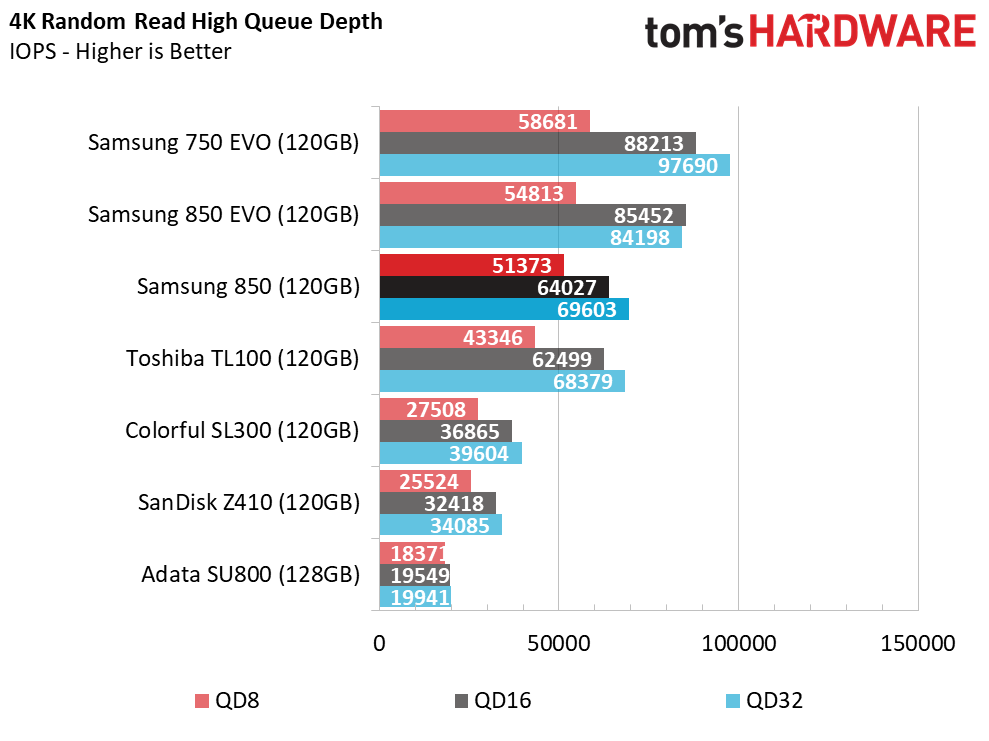
Samsung still managed to keep the 850's QD1 random read performance above 10,000 IOPS, and it scales well as we increase the workload. None of the other companies can reach the 10,000 IOPS range with 128GB-class SATA SSDs, and most companies even have a difficult time turning in these high results with newer 128GB-class NVMe drives. That makes it difficult to recommend a competing 128GB-class SSD.
Random Write Performance
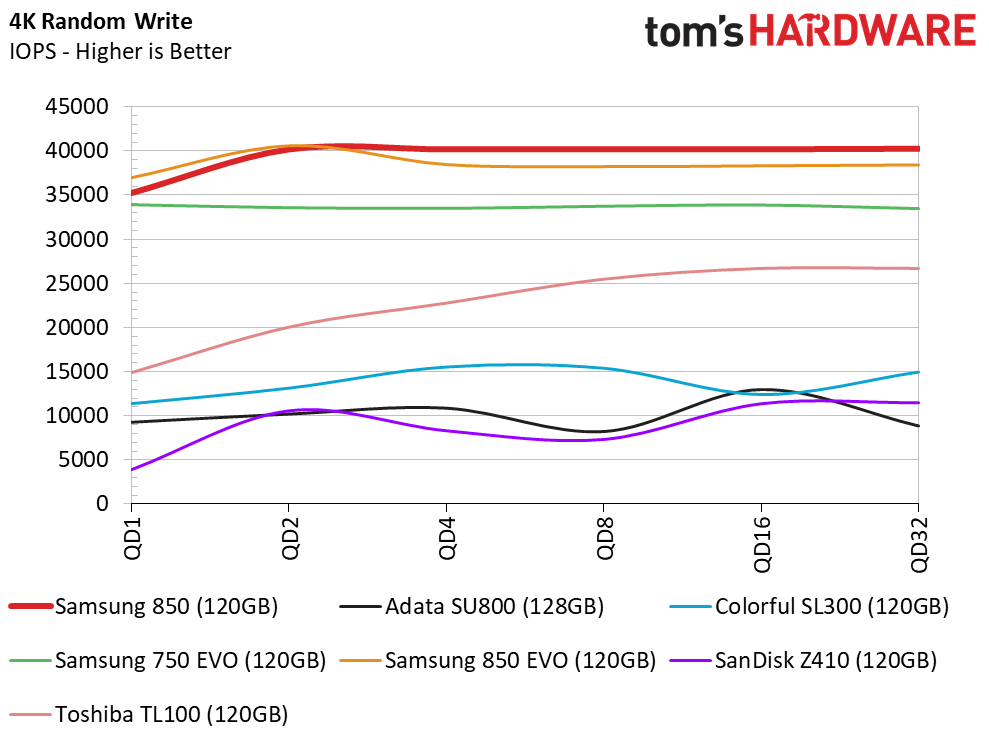
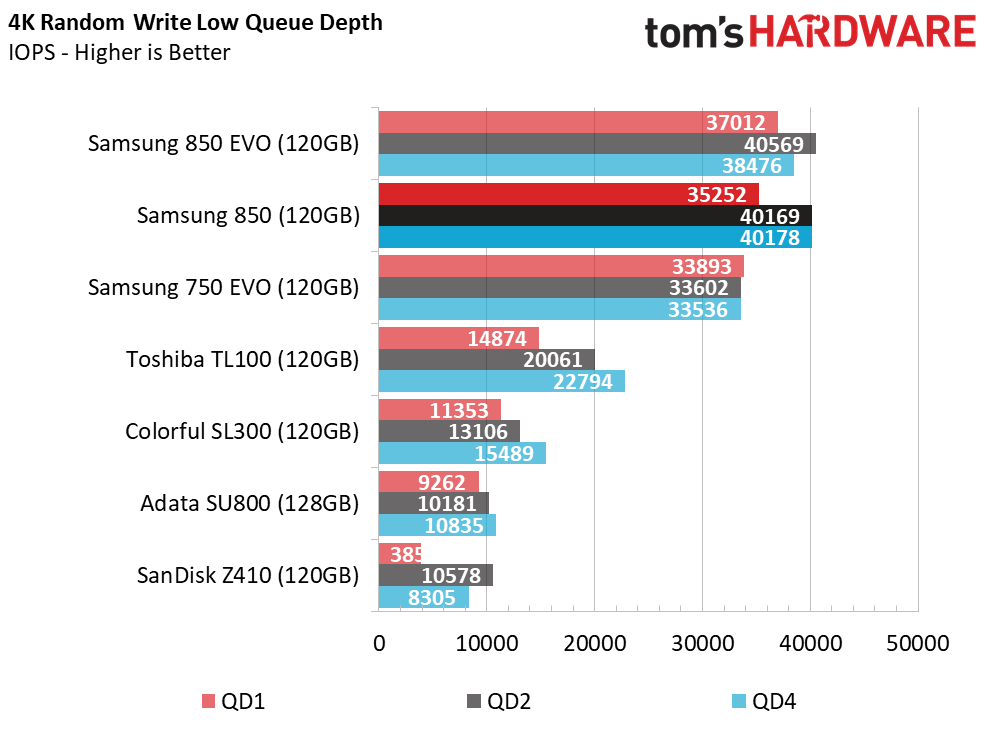
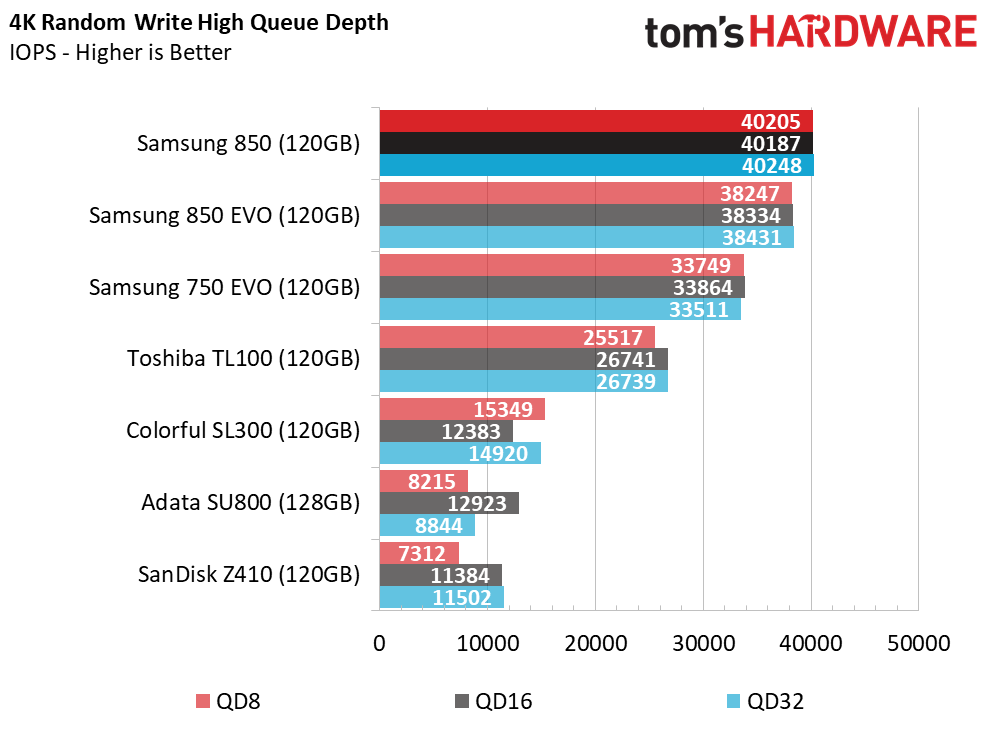
Samsung's SLC cache provides higher random write performance as well. The three Samsung TLC 120GB drives score well above the competing products. The 850 and 850 EVO provide nearly identical performance at low queue depths.
80% Mixed Sequential Workload
We describe our mixed workload testing in detail here and describe our steady state tests here.
Samsung's SATA SSDs dominate sales year after year. Even in small capacities, the drives simply outperform the competition where it matters.
80% Mixed Random Workload
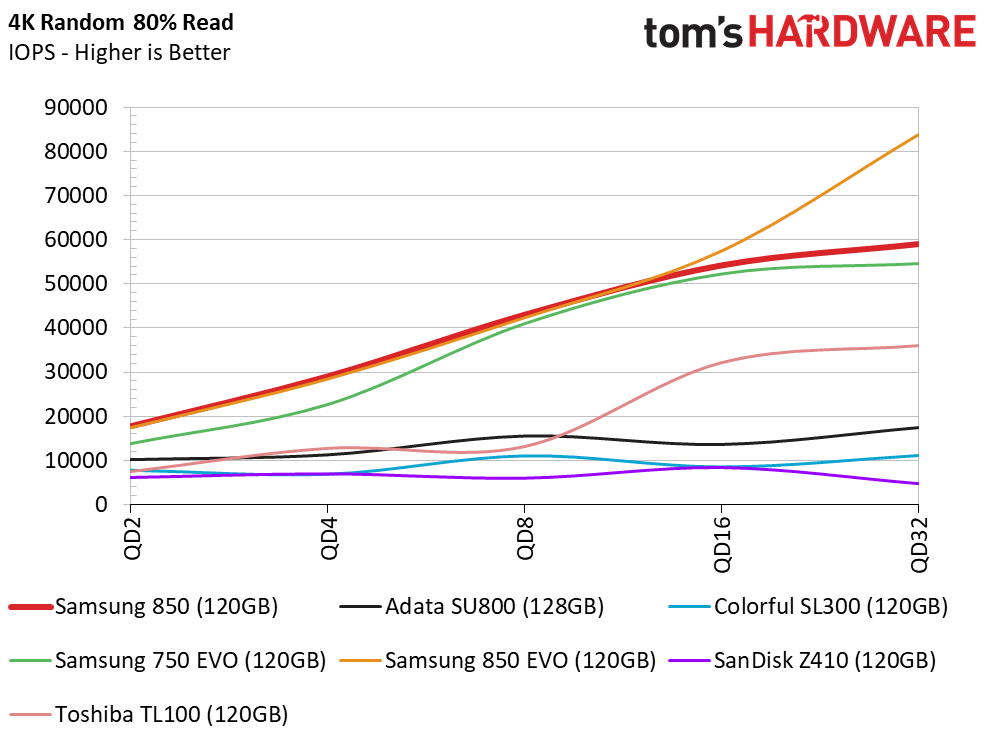
The 850 could easily replace the 850 EVO in the most important section of the test results. The 850's low-QD performance mirrors the aging, but still dominant, 850 EVO. For most of us, the 4KB mixed random workloads show everything you need to know about the user experience. This robust performance should carry over to applications, which we will test later in this review.
Sequential Steady-State
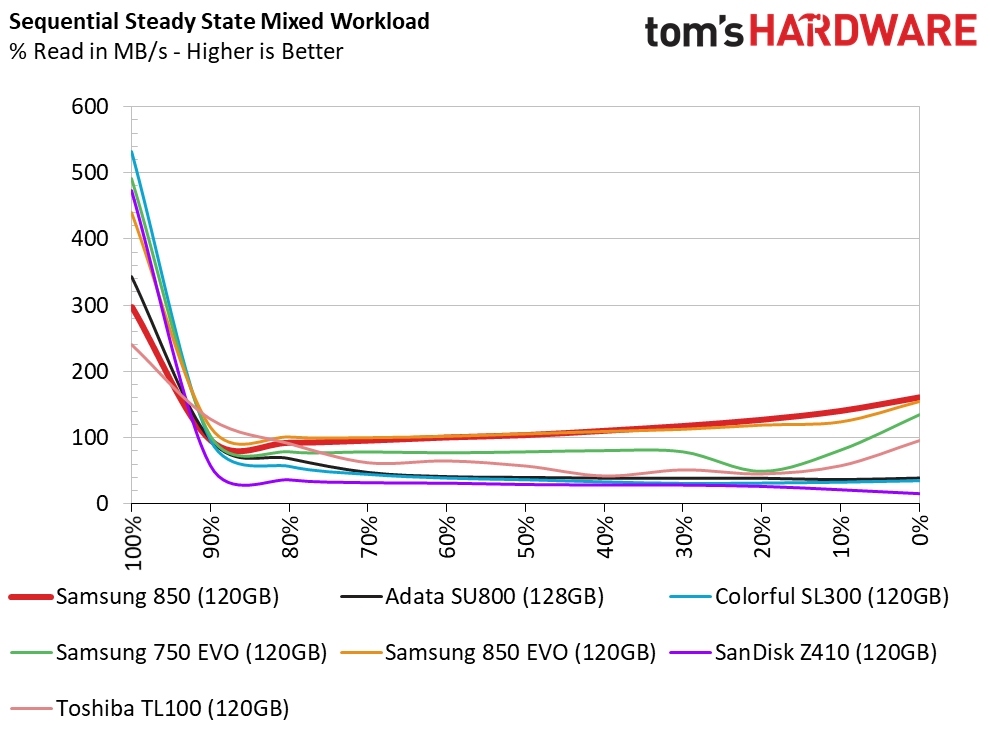
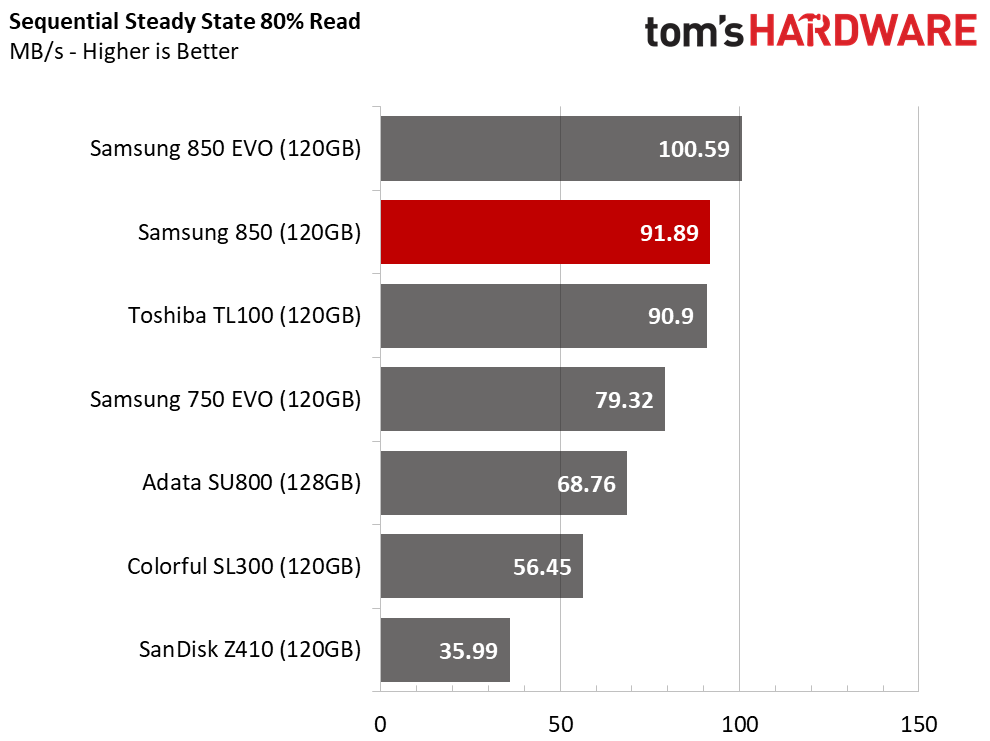
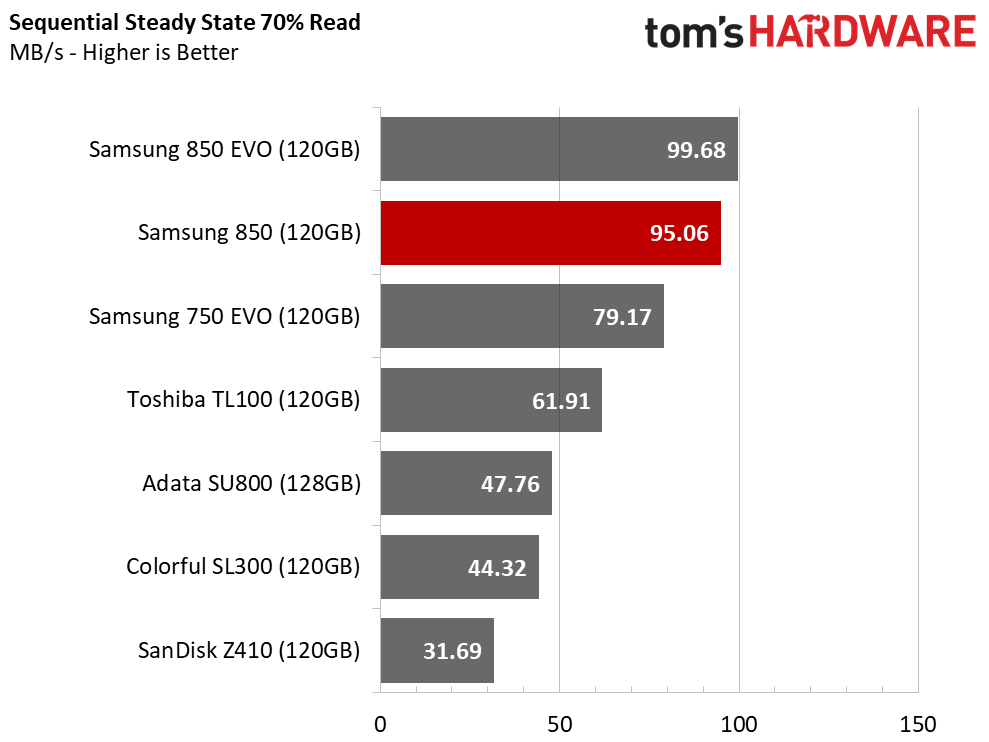
These low-cost products were not designed for workstation use in a heavy write environment. We do see that Samsung's TLC V-NAND grossly outperforms the competition.
Random Steady-State
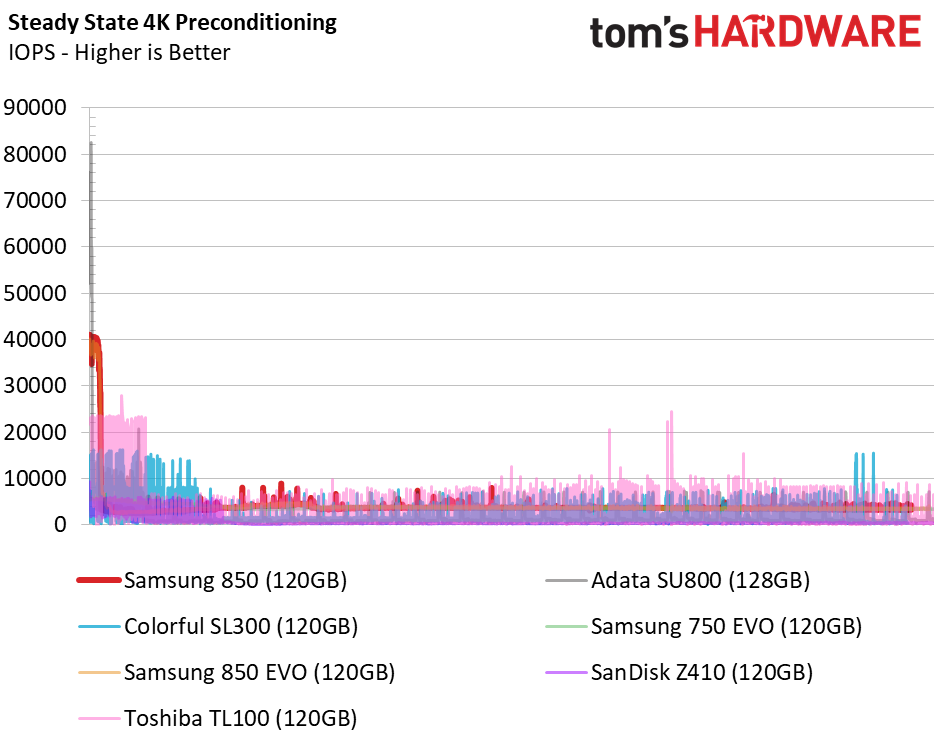
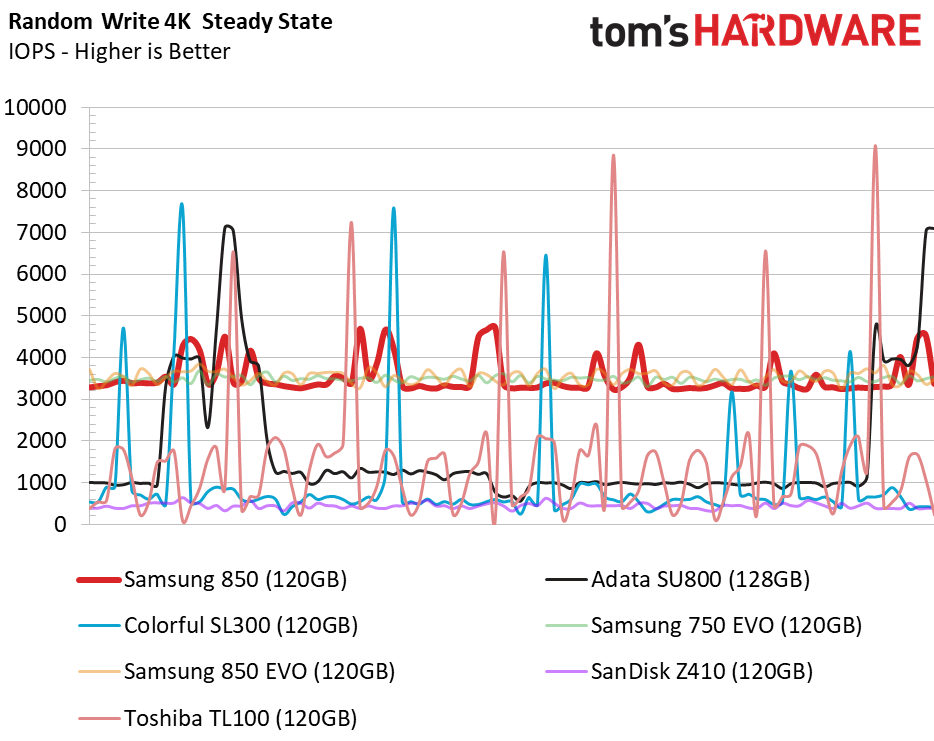
The 850 with new 64-layer V-NAND is less consistent than Samsung's older TLC, but it does deliver the same average performance and higher bursts. We can attribute the higher burst performance to the die's increased data transfer speed.
PCMark 8 Real-World Software Performance
For details on our real-world software performance testing, please click here.
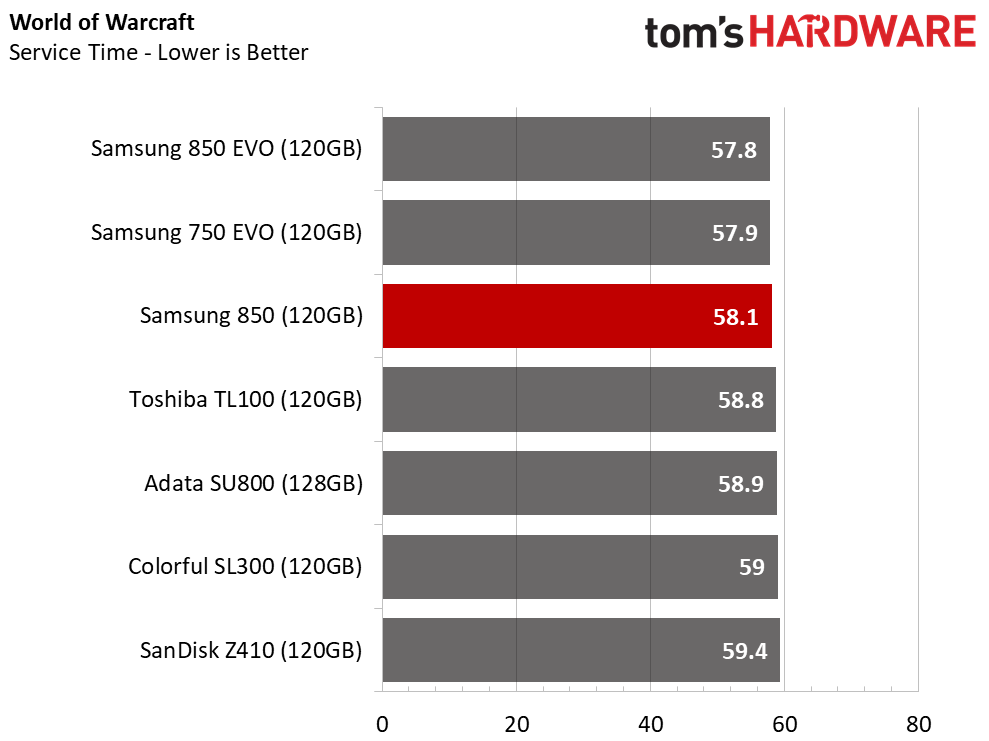
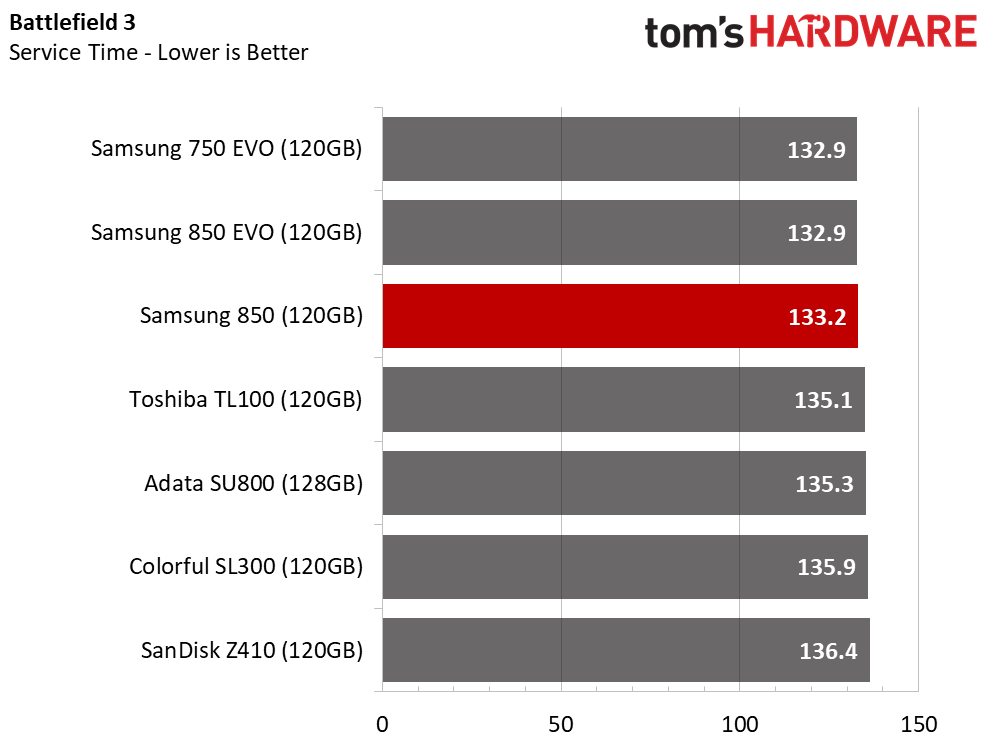
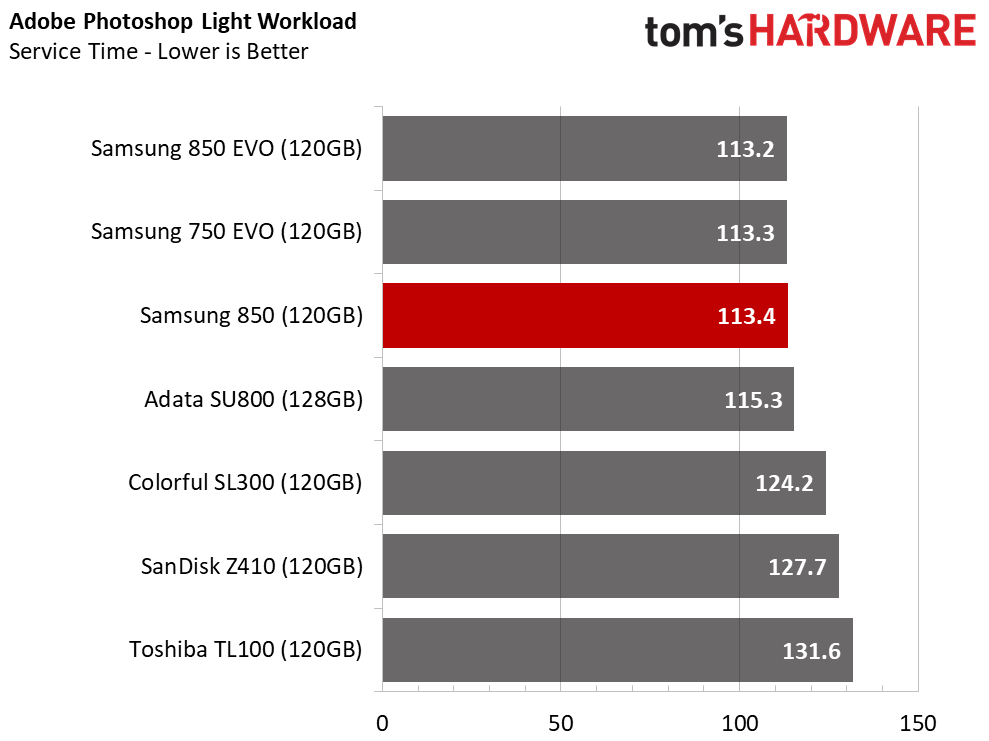
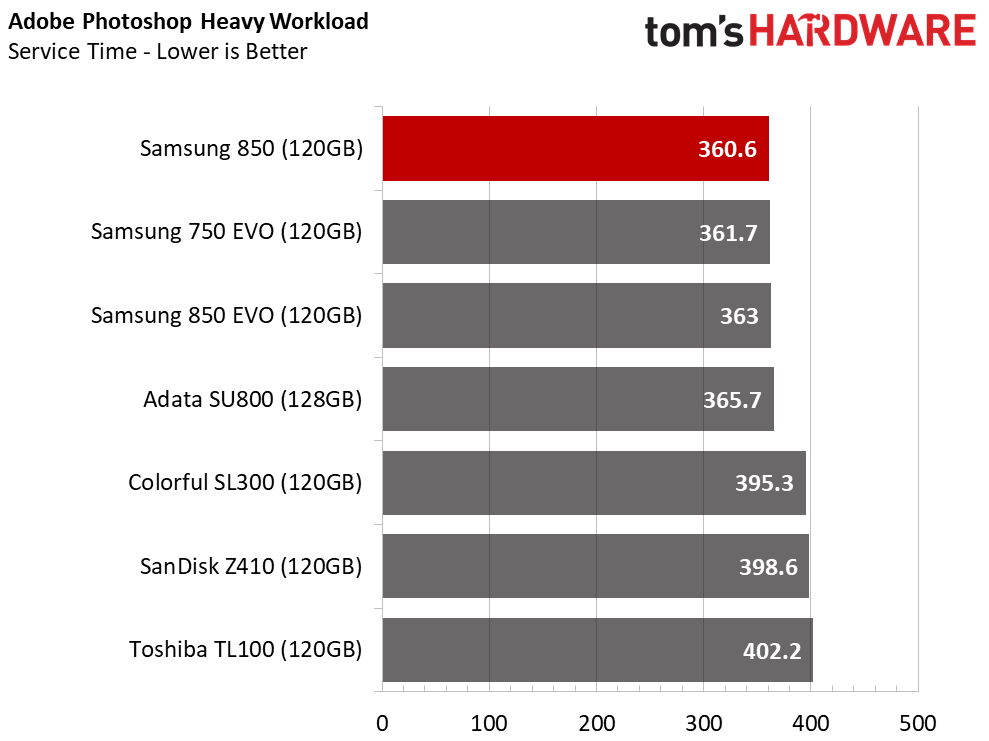
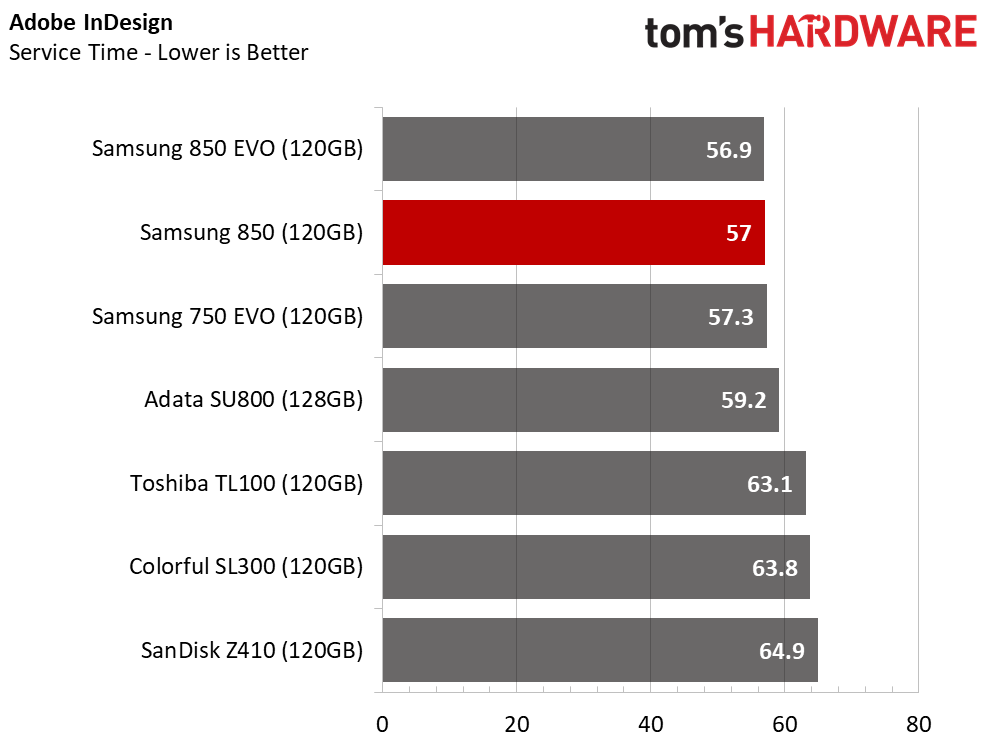
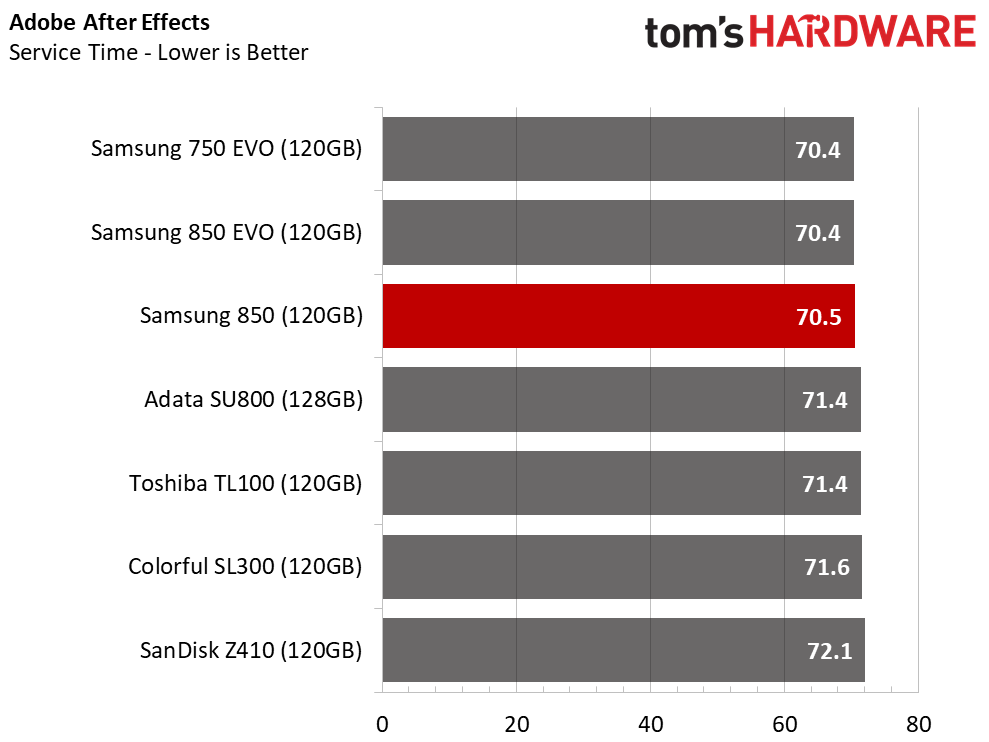
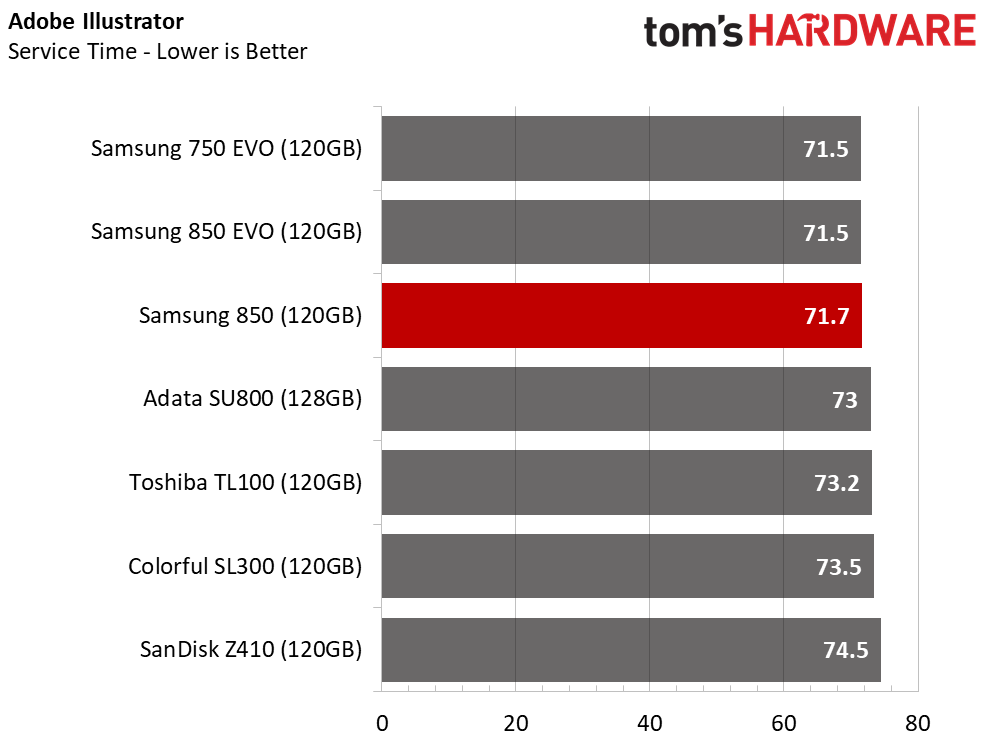
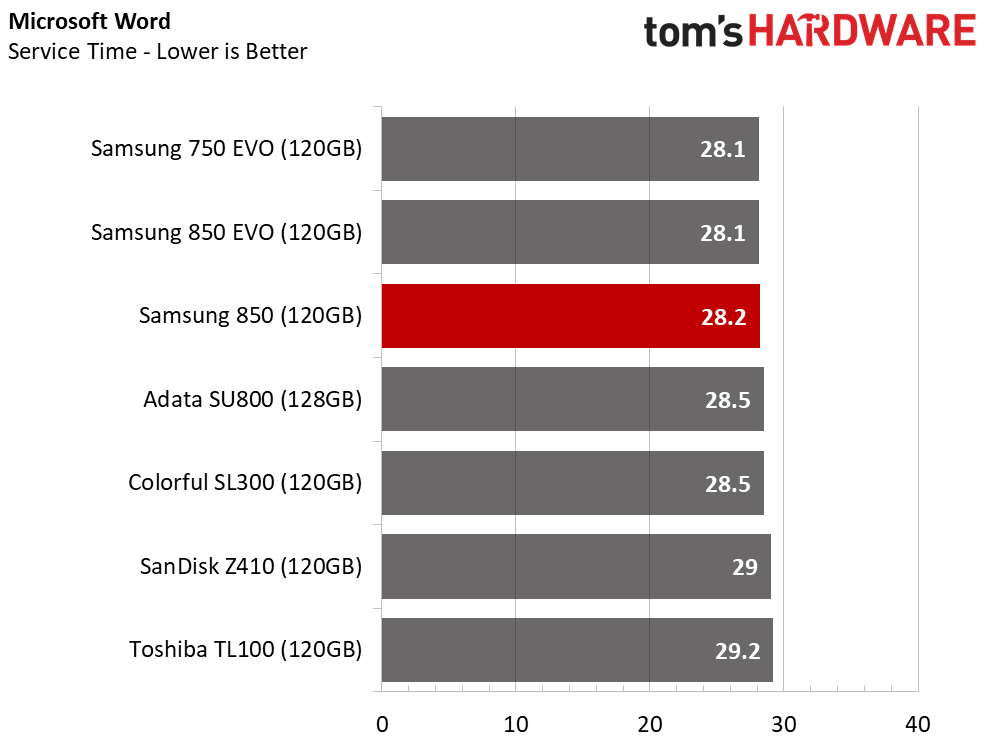
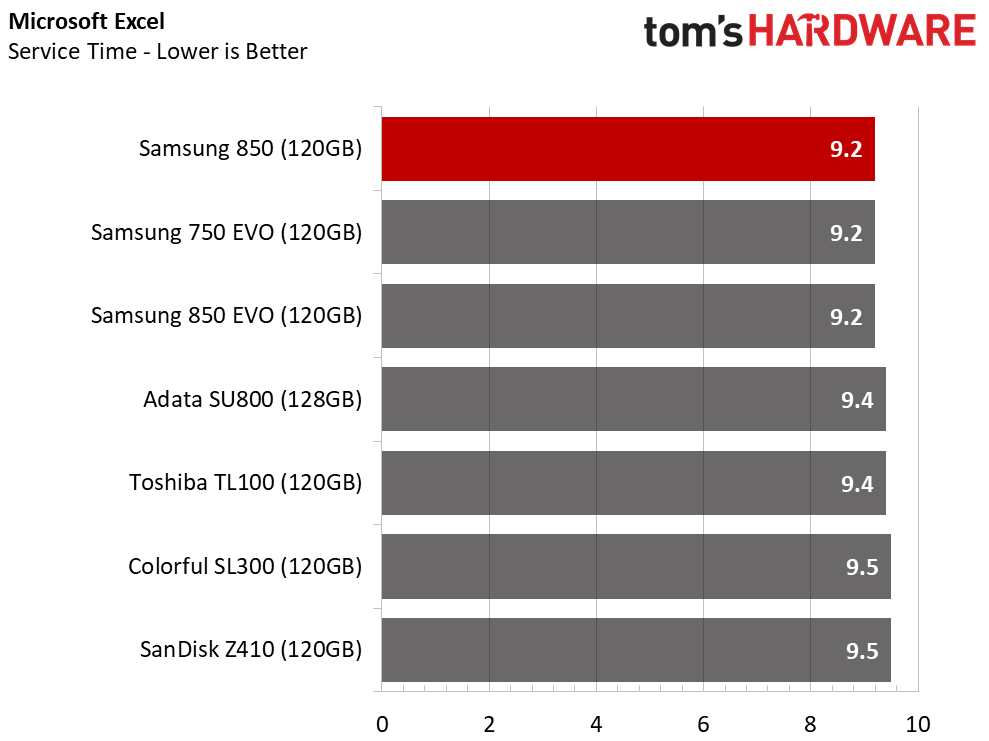
The new 850 performs in line with the 850 EVO and 750 EVO. The EVO SSDs have maintained a lead over competing products for some time, so it's good company. The 850 outperformed the other Samsung drives in some tests but trailed slightly in others.
Application Storage Bandwidth
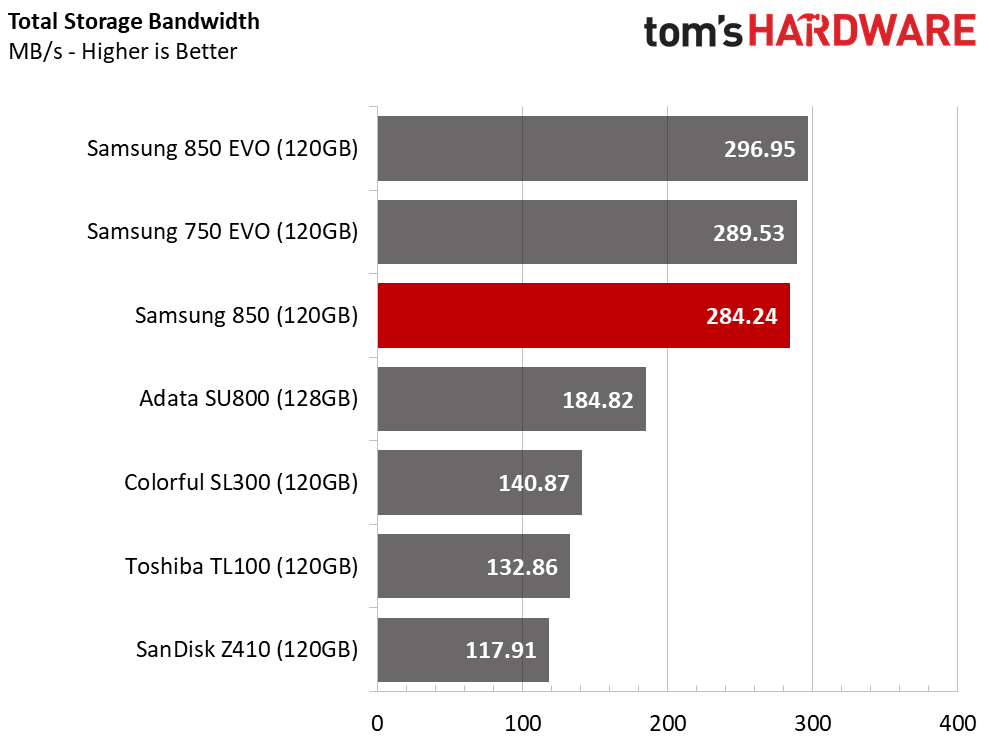
We can easily see the two distinct performance tiers when we present the results as an average throughput score. The Samsung SSDs have a 100 MB/s advantage over the other products. The 850 is the slowest of the three Samsung SSDs, but the performance delta is so small that you would not be able to tell the difference during normal use.
PCMark 8 Advanced Workload Performance
To learn how we test advanced workload performance, please click here.
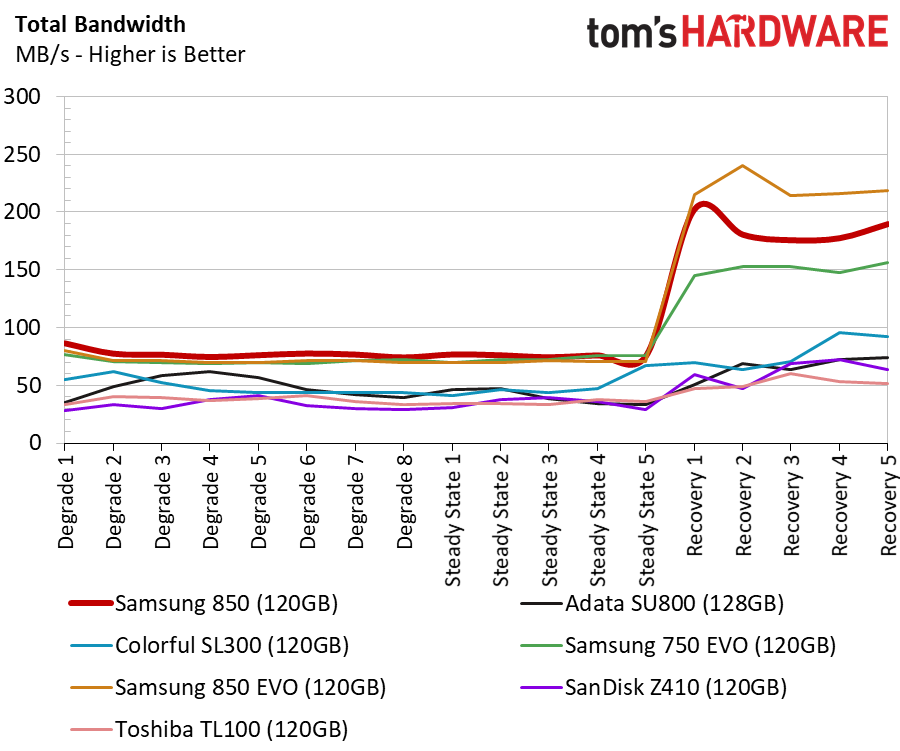
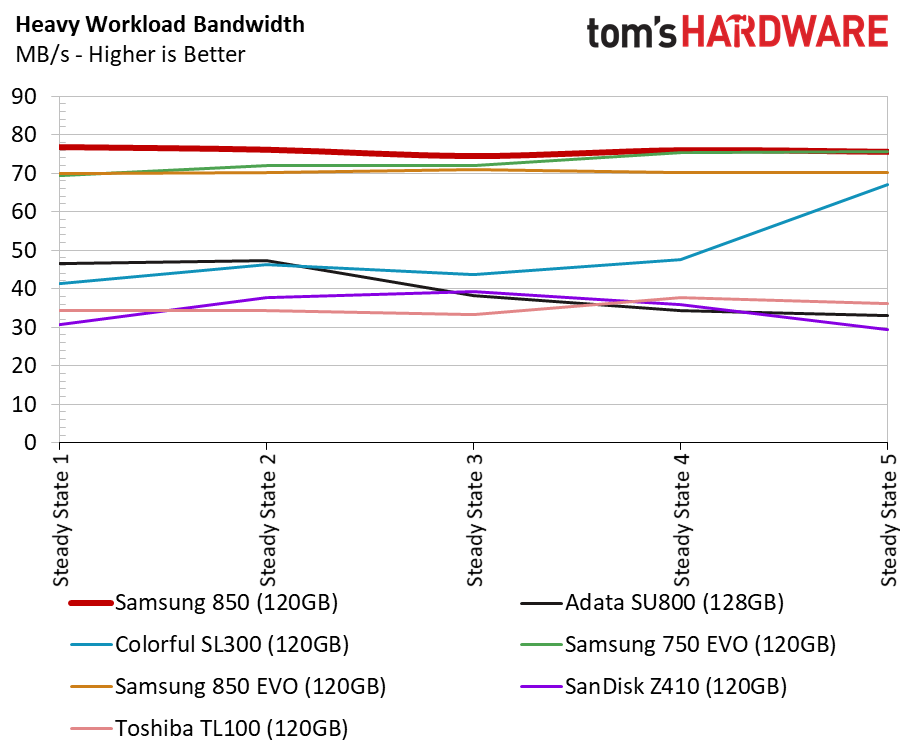
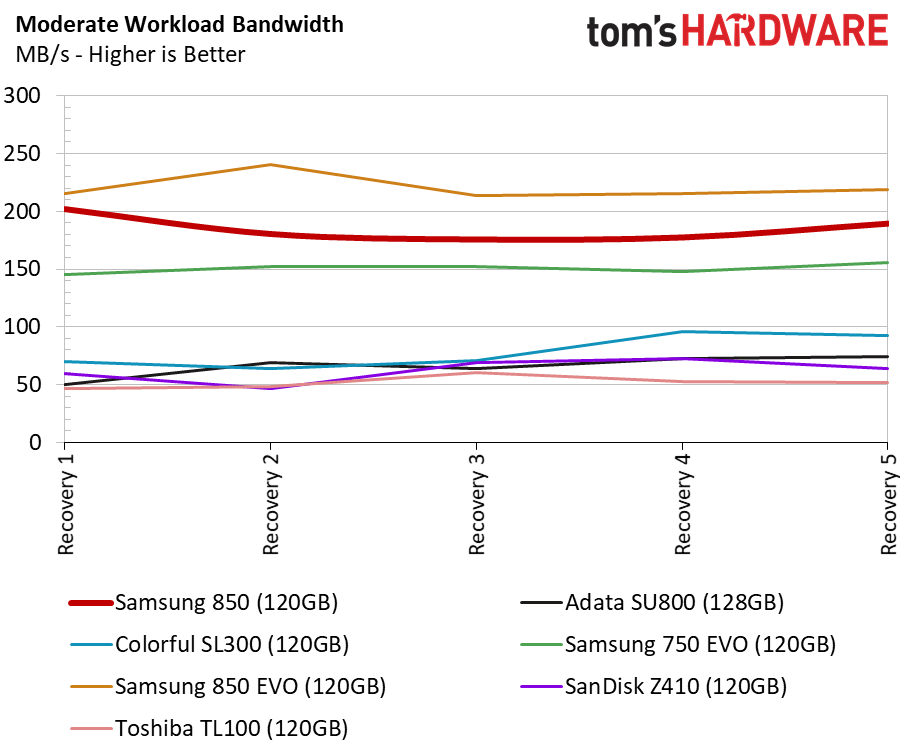
Lately, it's much easier for even casual PC users to fill up smaller boot drives. The operating systems and Office software have increased in size along with downloadable games that no longer require disks. Just downloading one or two games can fill a small drive. This test fills the drives with data to characterize performance when the drive is full.
It shouldn't come as a surprise to see the three Samsung SSDs outperforming the rest of the field. The 850 trails the 850 EVO during the recovery section of the test. There isn't much of a difference between the three Samsung SSDs during the heavy section of the test, but the 850 comes out on top.
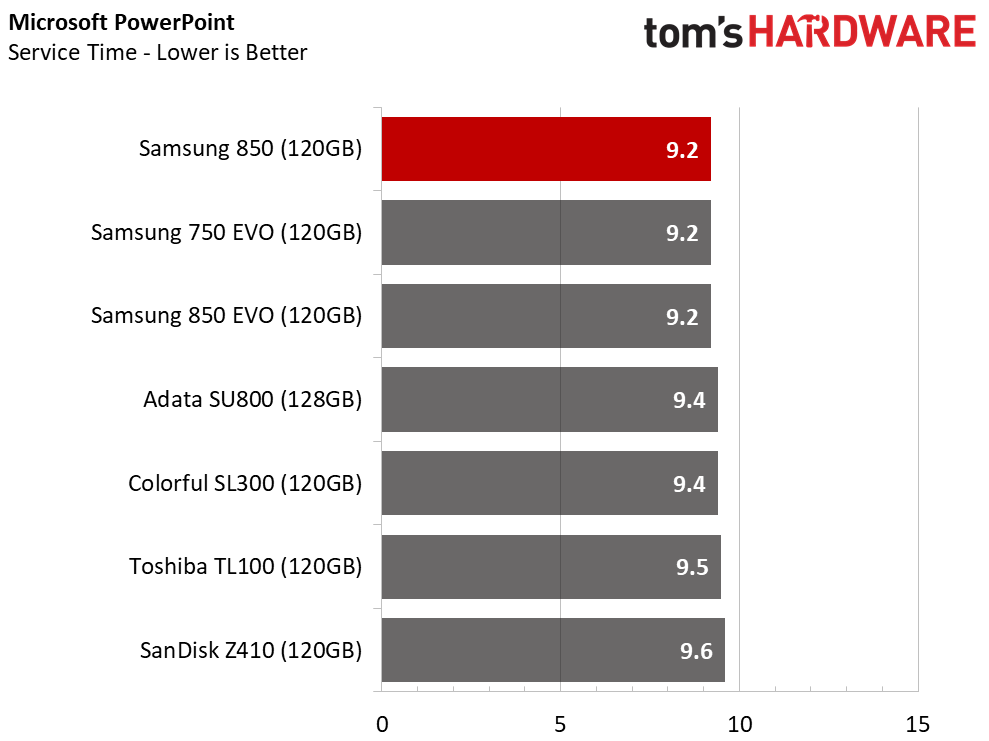
Total Service Time
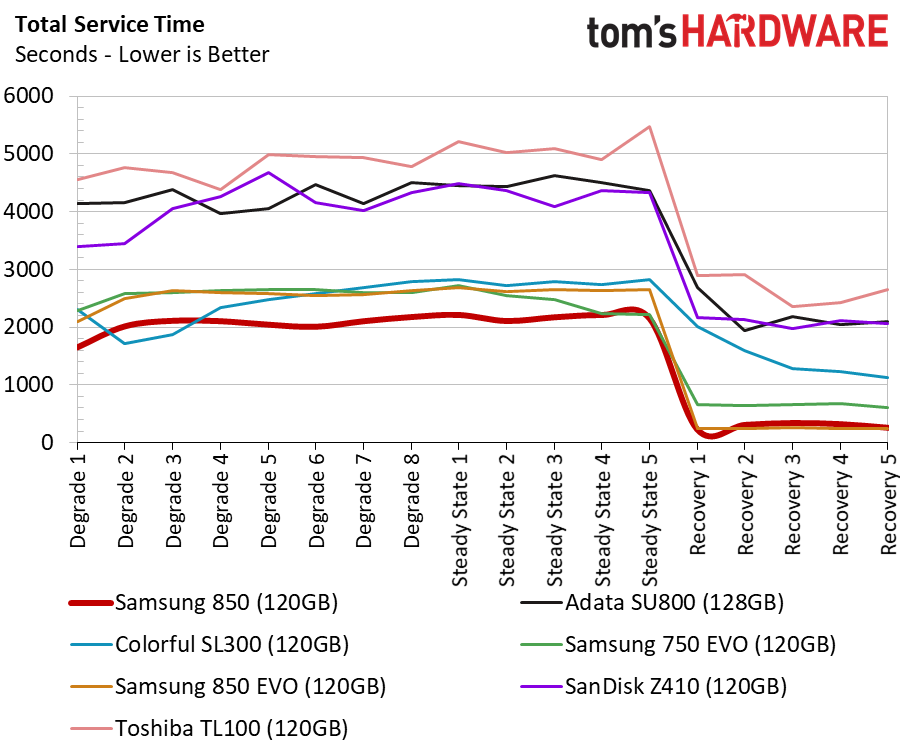
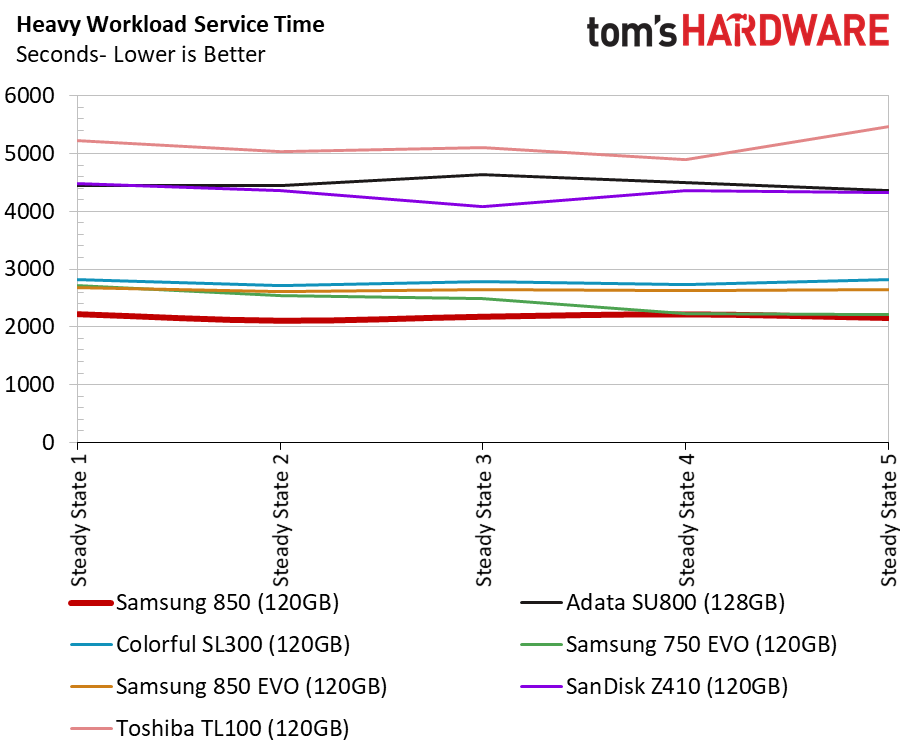
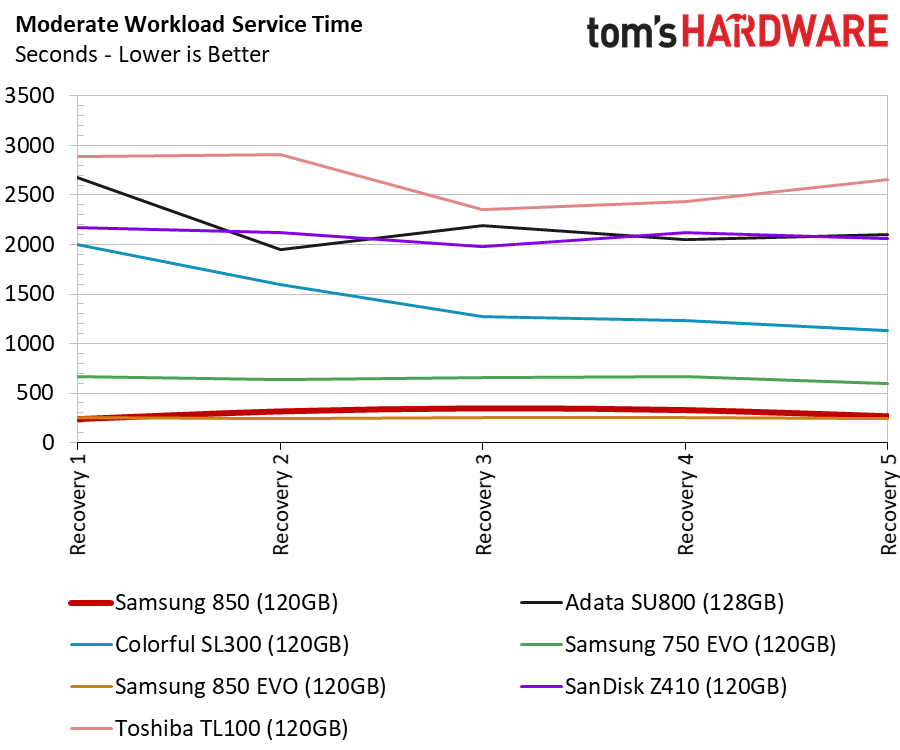
The three Samsung SSDs drop into their own high-performance tier during the service time tests. We can also spot the difference between the 850 and 850 EVO with 3D V-NAND and the planar (2D)-based 750 EVO.
Disk Busy Time
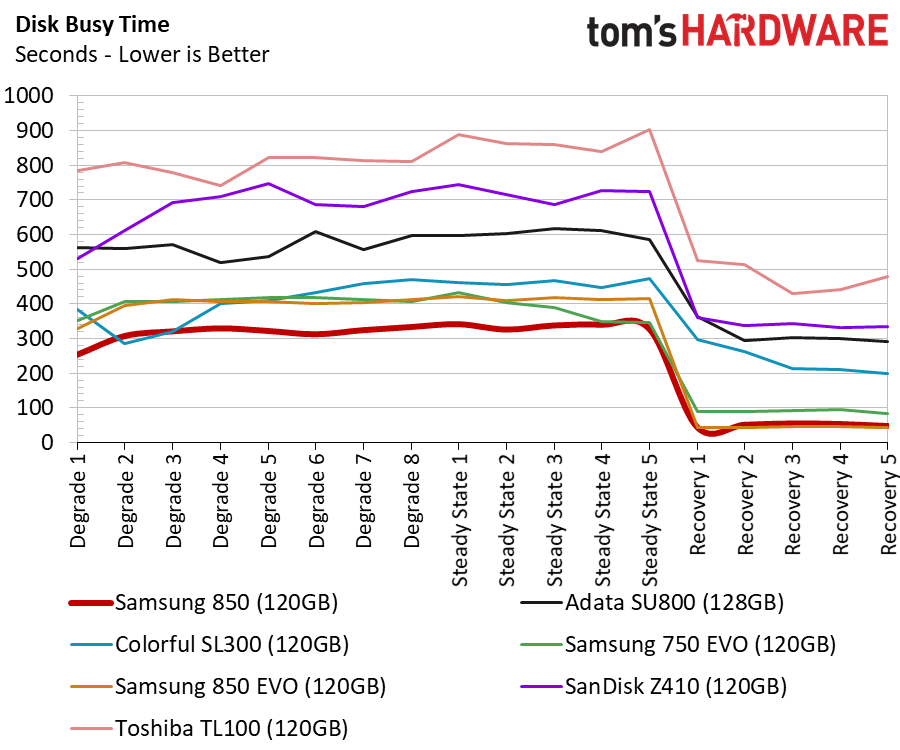
The new 850 works the least to perform the same tasks. Samsung’s latest flash is much faster than the previous-generation 48-layer V-NAND. It holds even more of an advantage against the 32-layer V-NAND in the 850 EVO.
Responsiveness Test
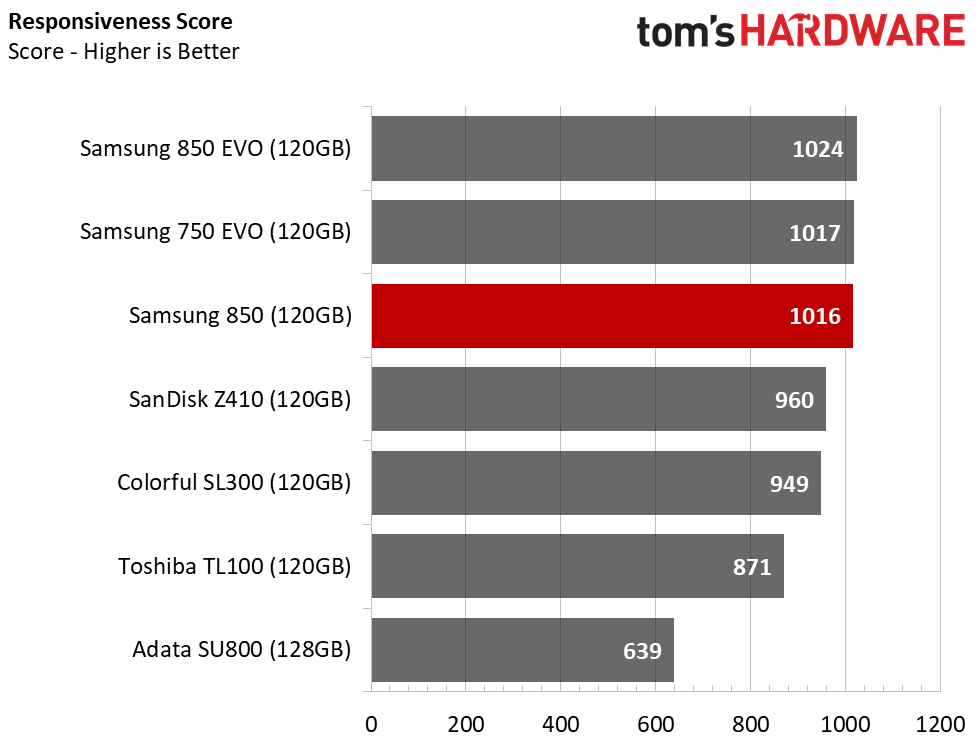
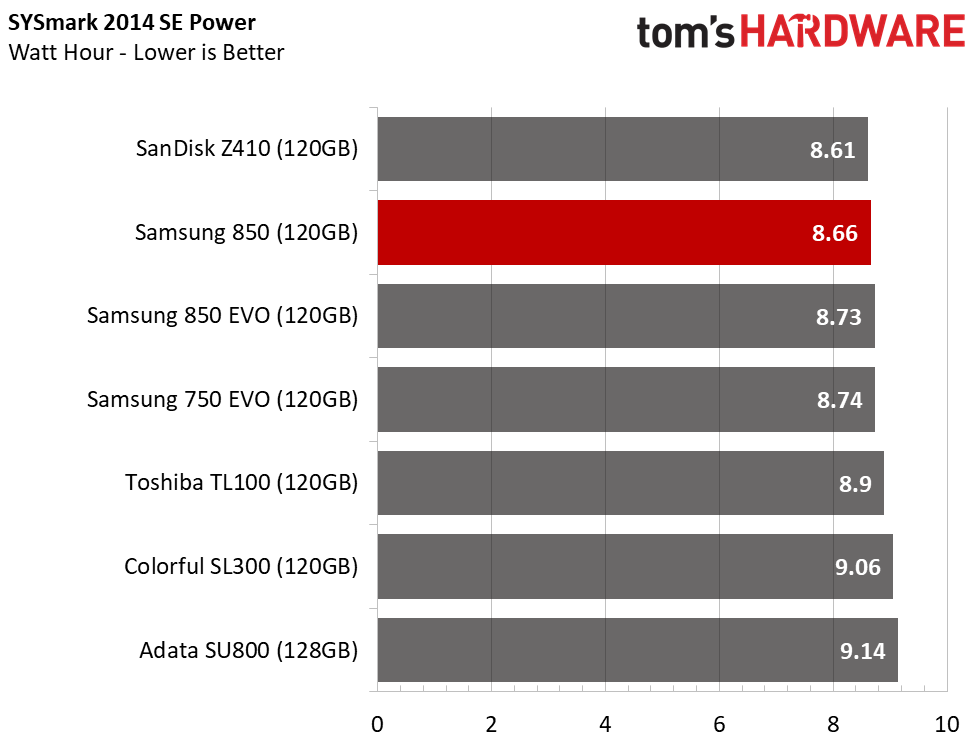
Samsung's SSDs have been the only SATA drives able to surpass a 1,000 rating on the BAPCo's SYSmark 2014 SE Responsiveness Test. A Samsung OEM drive set the original base score of 1,000 in a business-focused mainstream desktop. Samsung remains at the top of the SATA SSD charts, but the position is much more impressive when you consider that many entry-level NVMe SSDs fail to reach the same mark.
Notebook Battery Life
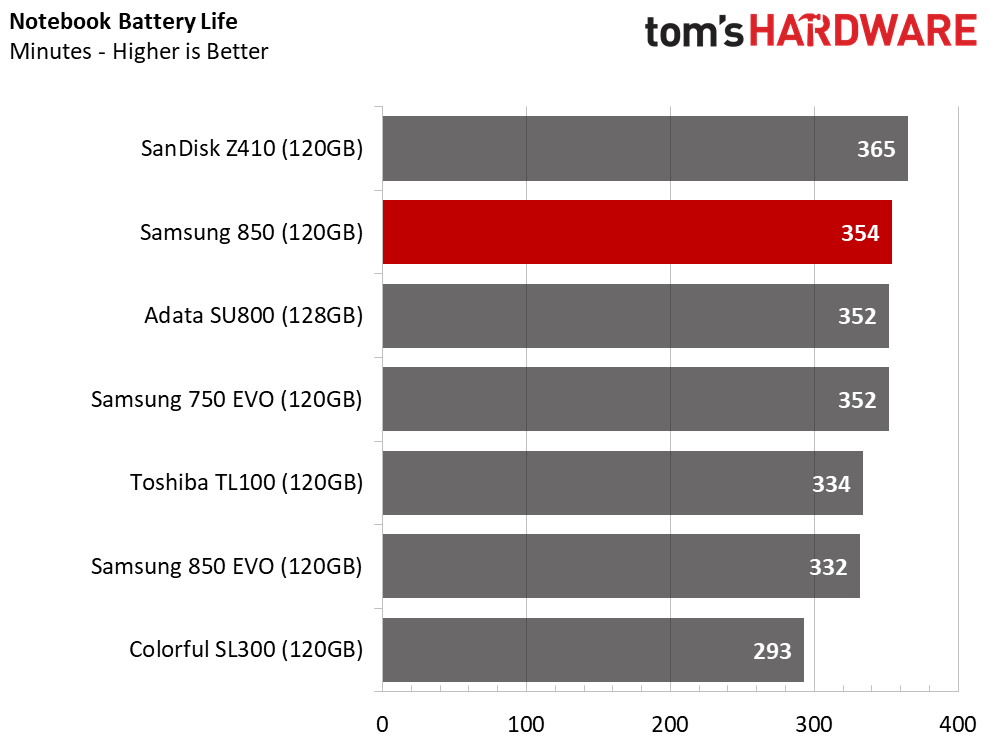
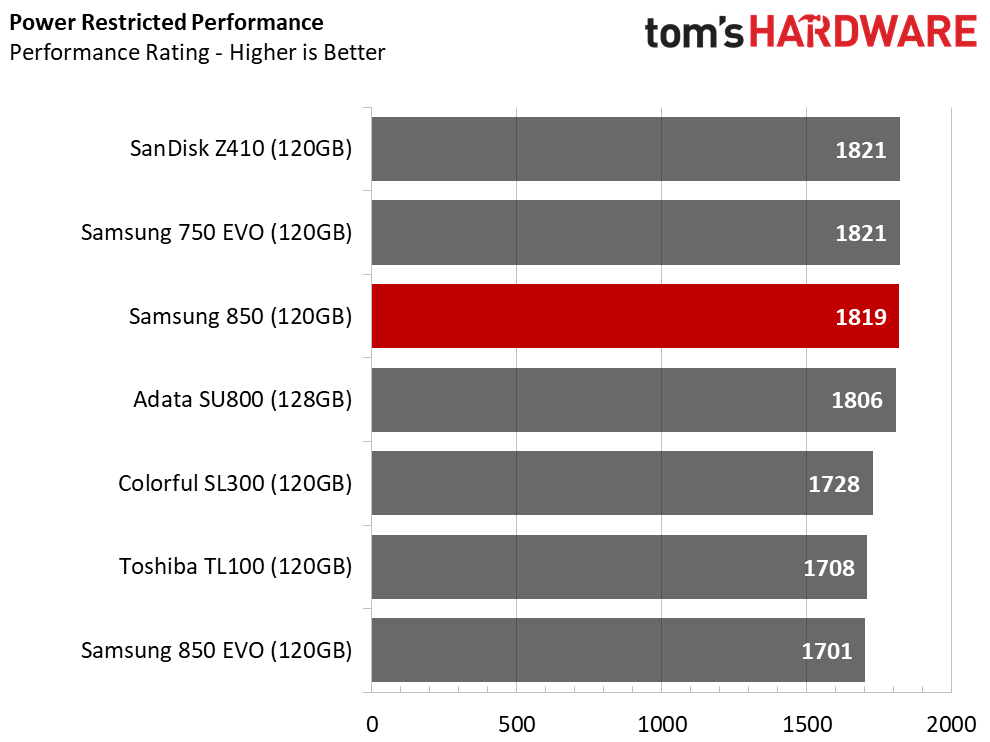
The new 64-layer NAND is enough to propel the 850 above the 750 EVO and 850 EVO in our notebook battery life chart. Samsung's new NAND uses a 2.5V input for the circuits. Samsung claims that results in a 30% improvement in power efficiency compared to 48-layer V-NAND, which uses a 3.3V input.
The faster die interface also allows the garbage collection and other background activities to complete faster. These activities are battery killers and can use as much power as running an extended random write workload.
MORE: Best SSDs
MORE: How We Test HDDs And SSDs
MORE: All SSD Content
Current page: 128GB Class Performance Testing
Prev Page Samsung's 64-Layer 3D V-NAND Comes To The Desktop Next Page Conclusion
Chris Ramseyer was a senior contributing editor for Tom's Hardware. He tested and reviewed consumer storage.
-
DerekA_C ha shortage my BUTT it's a cash cow right now as everyone is trying to switch over so why not make a few extra billion of gullible people just like everything else the fabs the money the time and investment is already there for years yet prices hiked bogusly, no one can convince me otherwise same with the GAS shortage all a bunch of BS to make extra billions to screw the population over PERIOD. Oh just like the LCD TV panel shortage HA then 4 companies including Samsung sued for 1 billion for strong holding the market. Practice as usual the elite finding new ways to make themselves more rich and powerful.Reply -
USAFRet So how is this new and different from the current 850 EVO drives?Reply
This, from my existing 850 EVO:
Yes, mine is a 500GB vs the test subject of 128GB, but just because there is a different TLA at the end of the model number does not make it 'better'. -
zodiacfml Not bad. I could use one but I bought 250GB EVO just a few days ago to match a 4TB HDDReply -
bit_user Please try to report the power-off data retention time of SSDs you review. As bits are being packed more densely, I suspect this number is falling and might already be low enough to cause issues for some people. For one MLC SSD I own, it's just 3 months.Reply -
Jeffs0418 Reply
How does one determine Power-off data retention time without TIME? That would fall under the Long-Term test.20426654 said:Please try to report the power-off data retention time of SSDs you review. As bits are being packed more densely, I suspect this number is falling and might already be low enough to cause issues for some people. For one MLC SSD I own, it's just 3 months.
-
mapesdhs Would be interesting to see how this compares to the old 840 and 840 Pro, and indeed the 830, see whether the competition has at least caught up to those older models (excluding the 840 EVO, too many issues with performance degradation over time).Reply
-
fanafirmino Must I endure a video of someone playing games everytime I hit your homepage??? Come on, there must be another way, guys!Reply -
bit_user Reply
It should be specified by the manufacturer, as in the case of my Intel drive. If it's not in the datasheet, then I would like the author to contact the manufacturer and ask them what it is. This will also hopefully send the message that people care about this attribute, and perhaps they'll be more mindful of it.20428005 said:
How does one determine Power-off data retention time without TIME? That would fall under the Long-Term test.20426654 said:Please try to report the power-off data retention time of SSDs you review.
