Samsung PM981 NVMe SSD Review
Why you can trust Tom's Hardware
1TB Performance Testing
Comparison Products
Intel's Optane SSD is the clear performance leader for hosting your operating system. But the 900P only scales up to 480GB and retails for $600, so there is a big price and capacity divide between the Optane and NAND performance tiers. The Optane 900p will not work in a notebook, either.
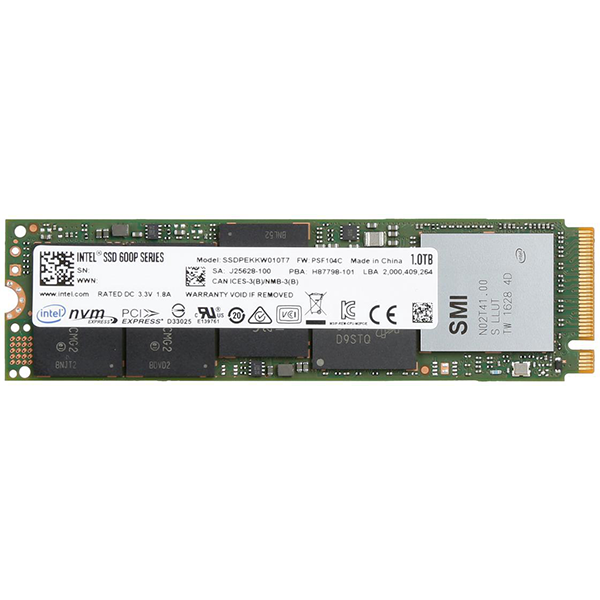
The Samsung PM981 M.2 NVMe SSD joins the Samsung 960 Pro and 960 EVO in the 1TB-class tests. The Intel 600p, Toshiba RD400, and Plextor M8Se round out the M.2 products.
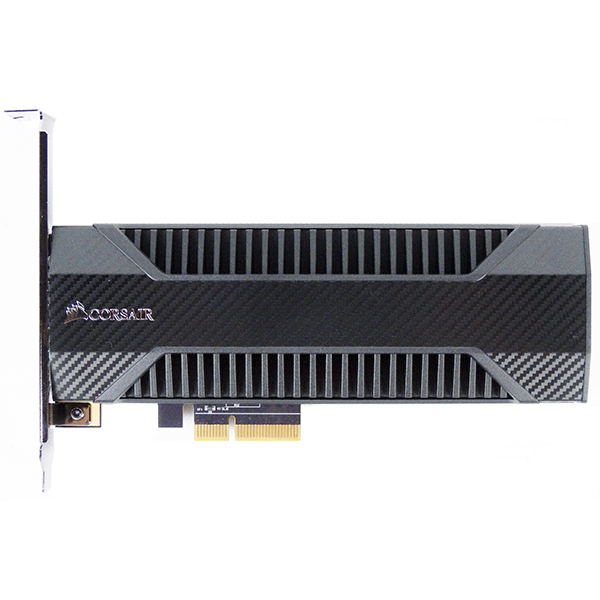
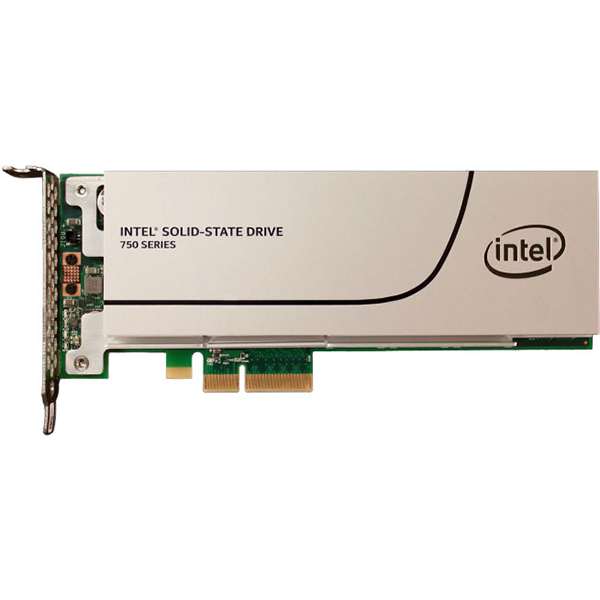
The Intel SSD 750 1.2TB and Corsair Neutron NX500 800GB made the comparison list. They are half-height, half-length add-in cards.
Sequential Read Performance
To read about our storage tests in depth, please check out How We Test HDDs And SSDs. We cover four-corner testing on page six of our How We Test guide.
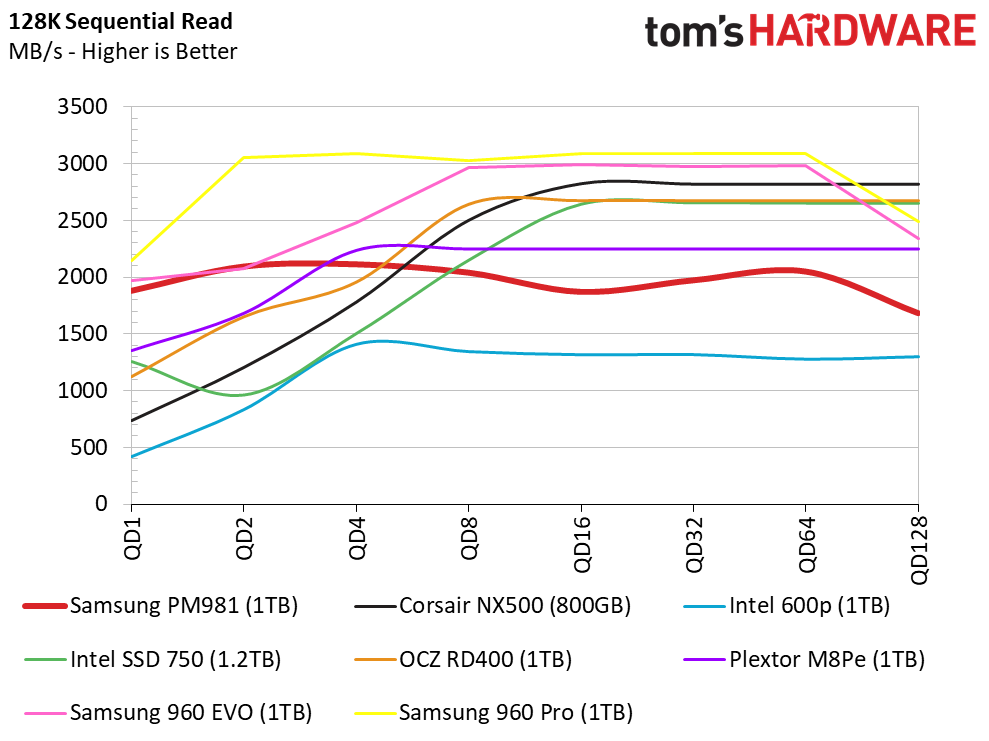
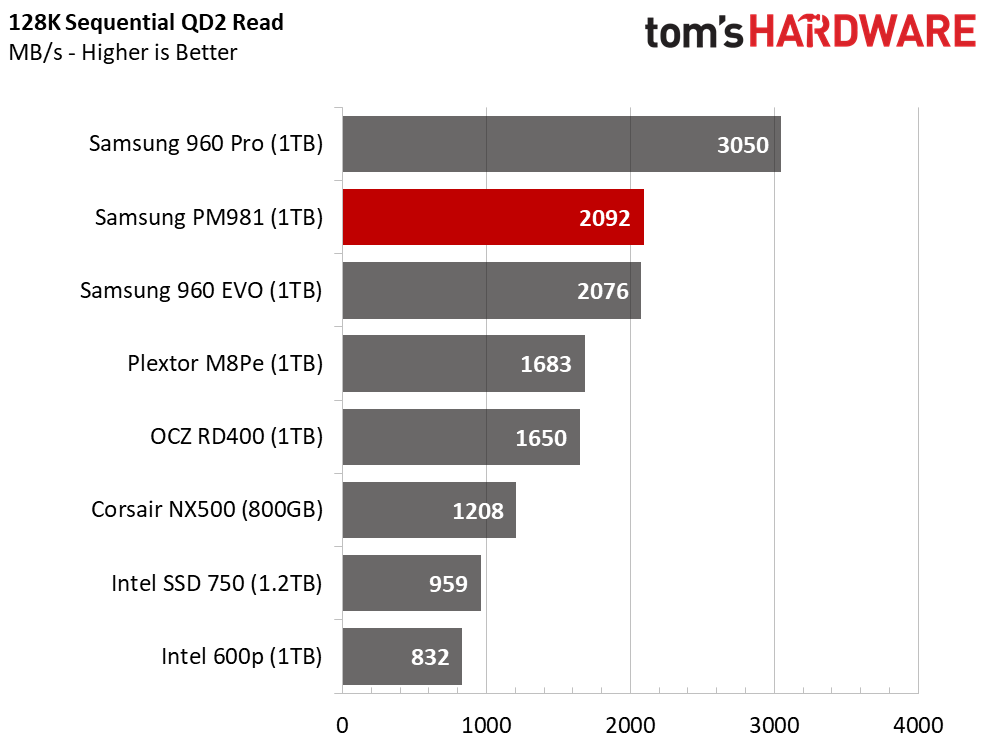
We ran our thermal throttle test early in the review to show how the PM981 OEM drive throttles before the other Samsung NVMe drives. We suspect the drive began throttling during our synthetic workloads, which is why sequential read performance is much lower than we expected. The PM981 isn't the first high-performance NVMe SSD to enter a thermal protection mode, but it's much more common during write testing.
Sequential Write Performance
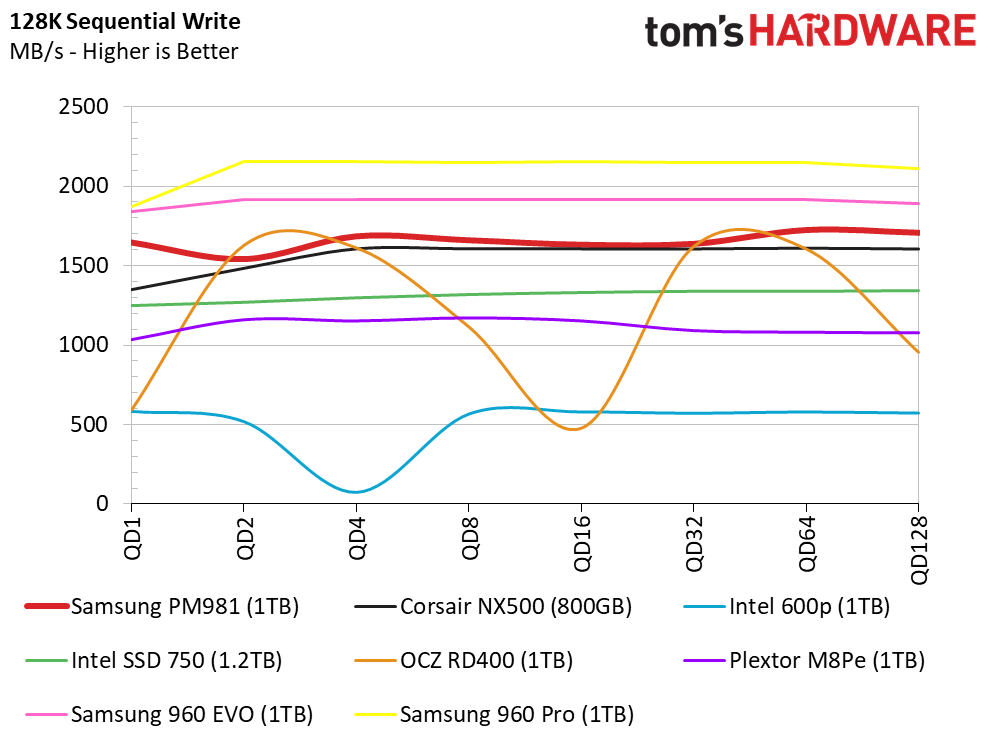
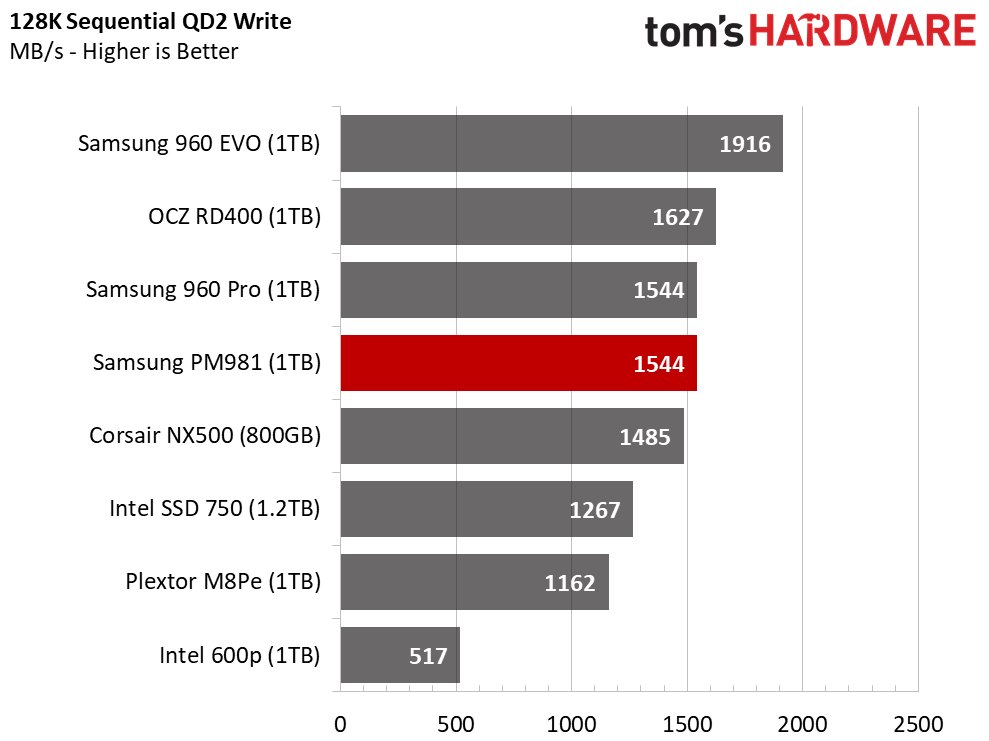
We managed to reach 1,900 MB/s with the PM981 at QD1 during some of our other tests. Again, throttling created an issue during our testing. SLC caching, which is a common technique to improve performance with TLC SSDs, also presents challenges. The entire industry is moving to TLC flash, so this may be one of the last reviews before we transition to a new burst testing methodology.
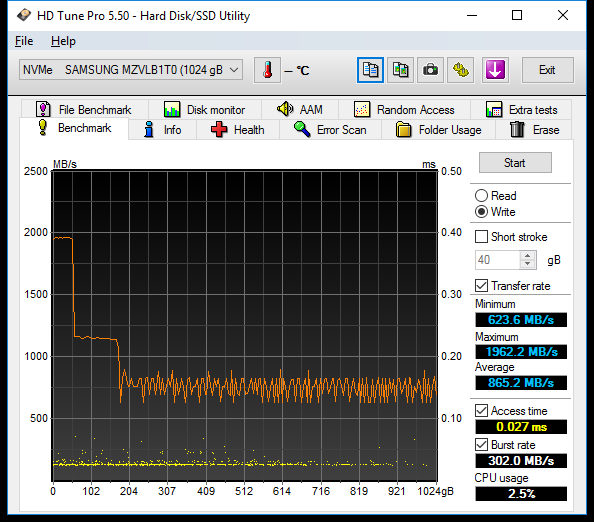
Eight-channel high-performance NVMe controllers without heatsinks also cause just as many headaches for workstation-level applications that prize consistent performance. Pairing them with TLC NAND just complicates matters even more. In this test, we write sequential data across the entire drive. The SSD speeds along at 1,900 MB/s until we write 50GB, or roughly the equivalent of a Blu-Ray ISO. Then the sequential write speed drops to around 1,200 MB/s for just over 100GB of writes before the SSD finally drops to its native 750 MB/s.
Get Tom's Hardware's best news and in-depth reviews, straight to your inbox.
Random Read Performance
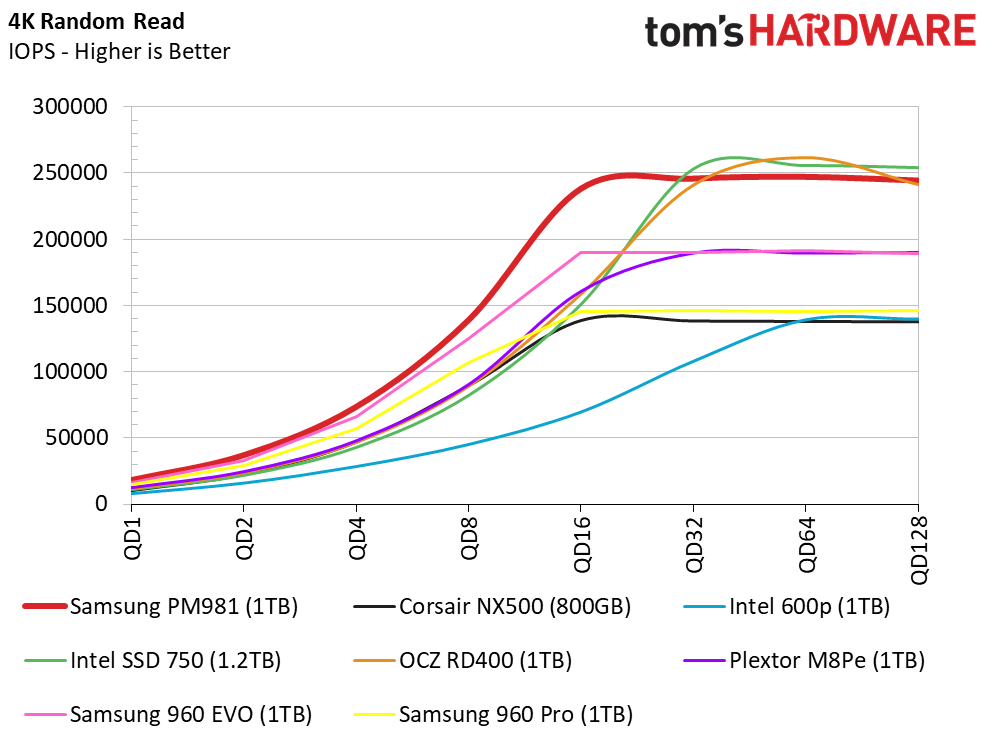
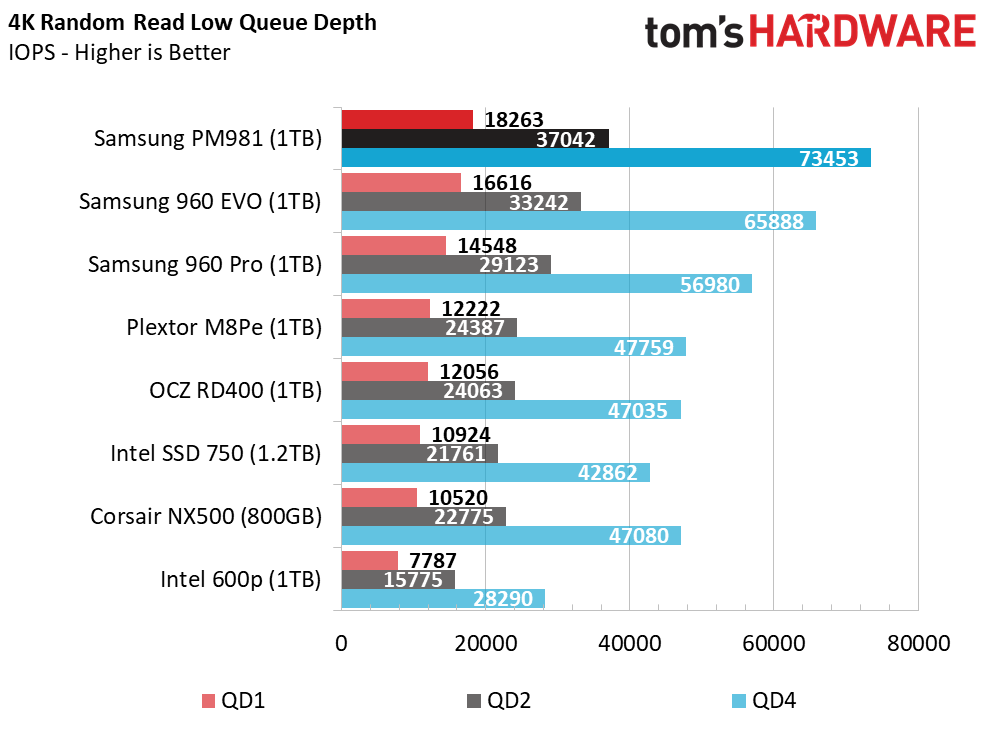
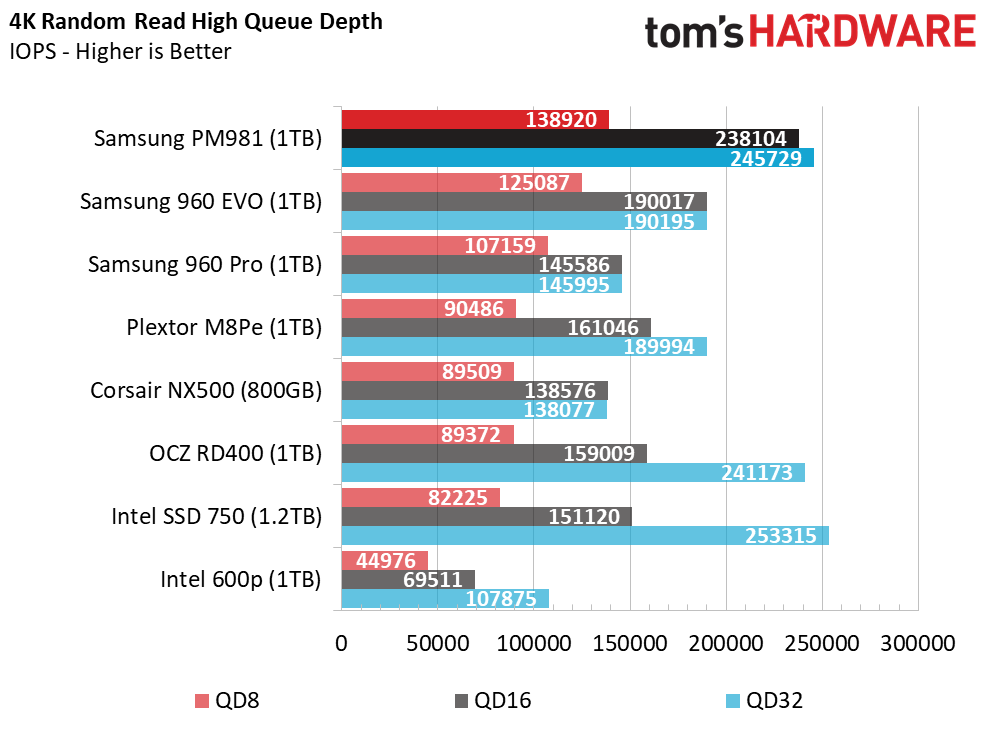
Random read performance is the most critical measurement for most of us. Samsung managed to increase the performance again with the latest generation. This is common for Samsung. We usually see a 2,000 IOPS increase at QD1 with each new generation. The PM981 also reaches its peak performance at QD16, which is well before the 960-series products.
Random Write Performance
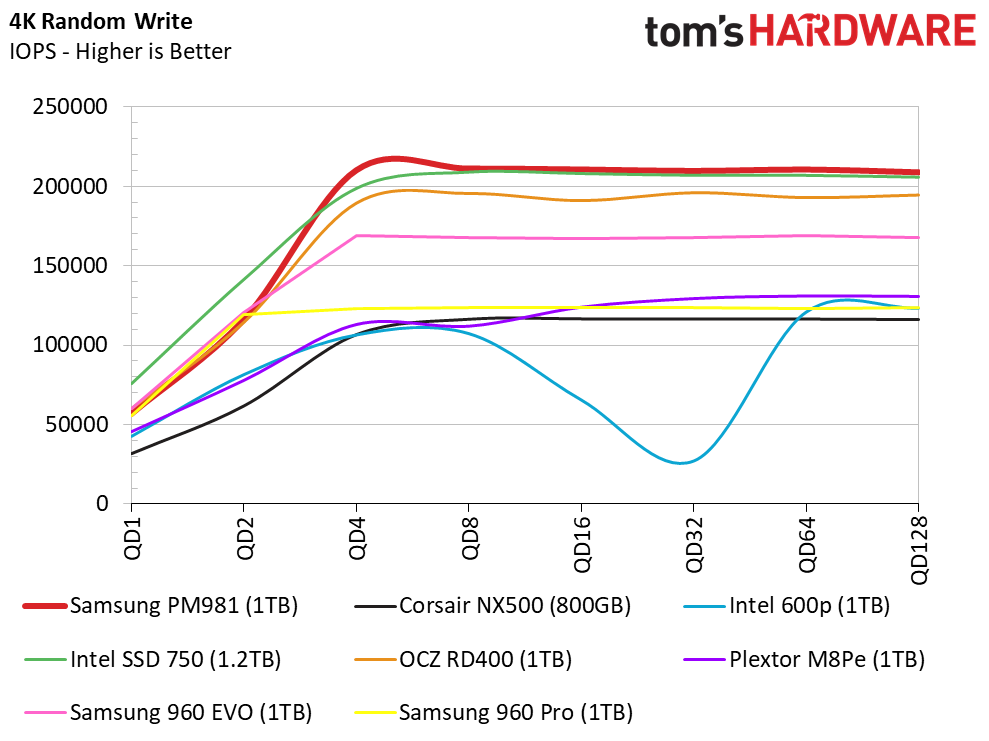
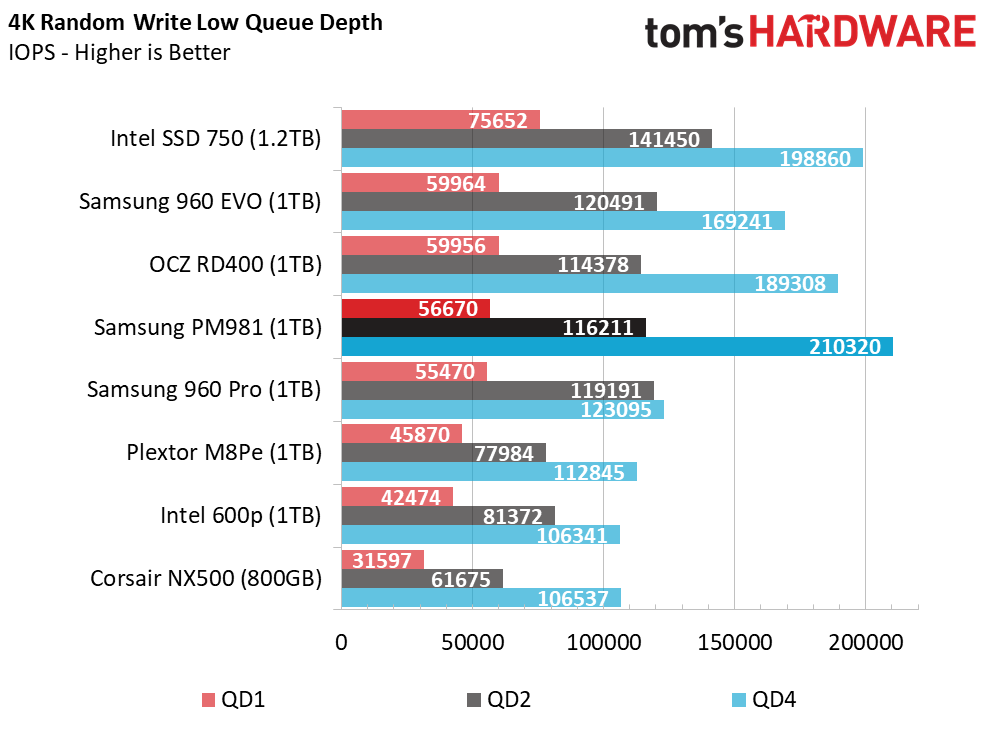
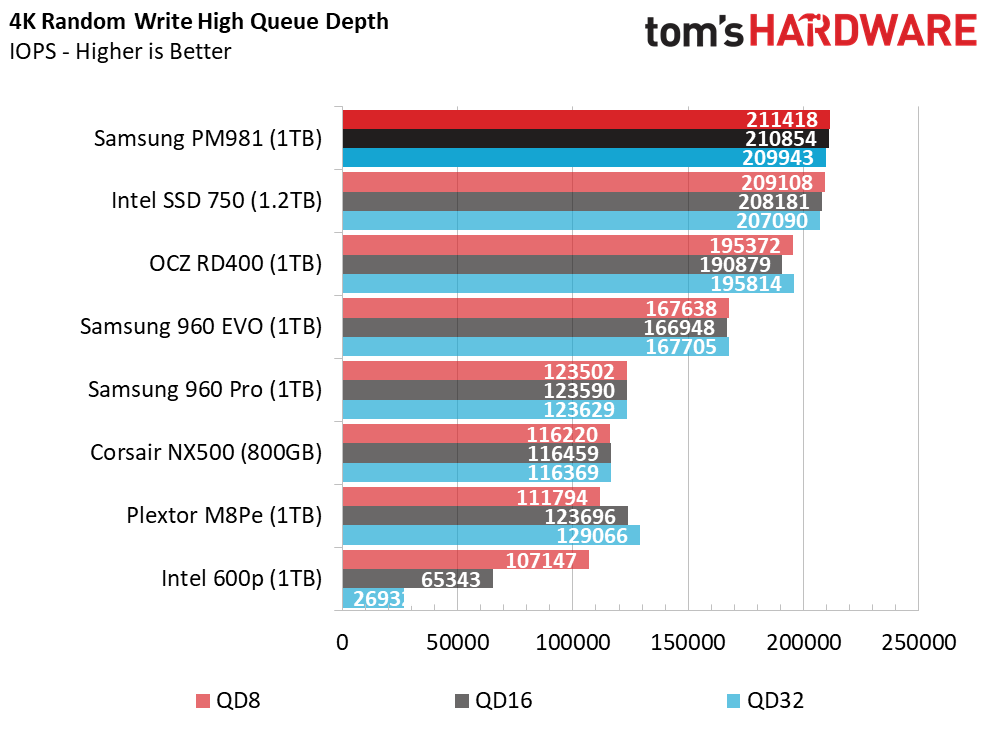
The PM981 1TB doesn't gain much in low-QD random writes, but it surpasses the Intel SSD 750 at high queue depths. This is the first consumer SSD we've tested that delivers more random write performance than the 750 1.2TB. Even the Optane SSD 900P couldn't pass Intel's 750.
80% Mixed Sequential Workload
We describe our mixed workload testing in detail here and describe our steady state tests here.
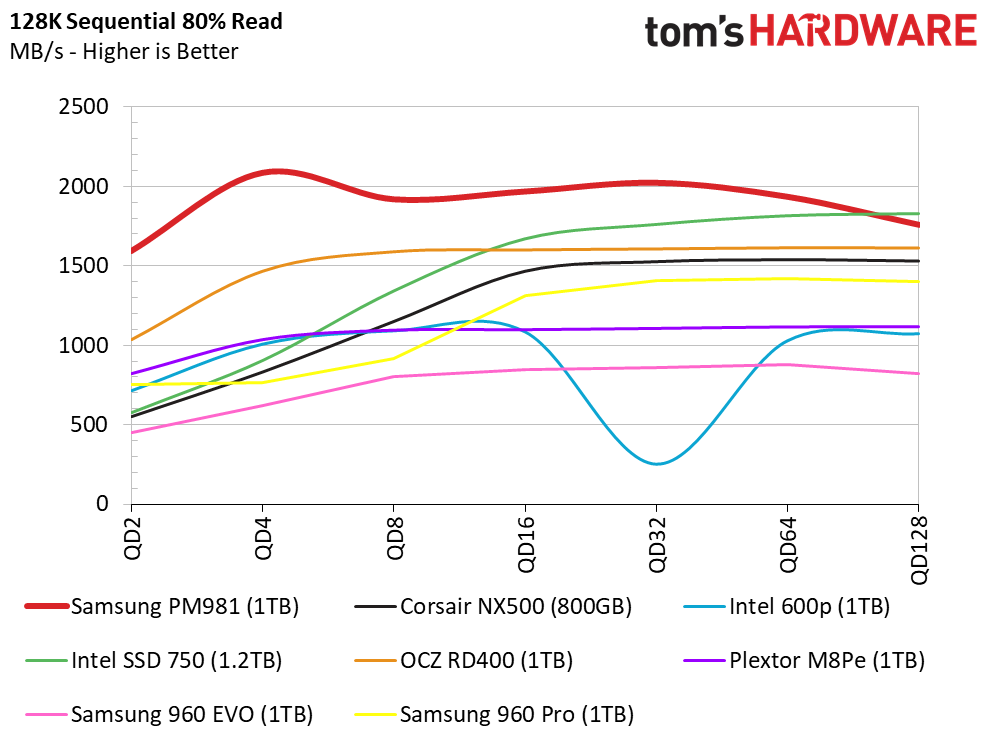
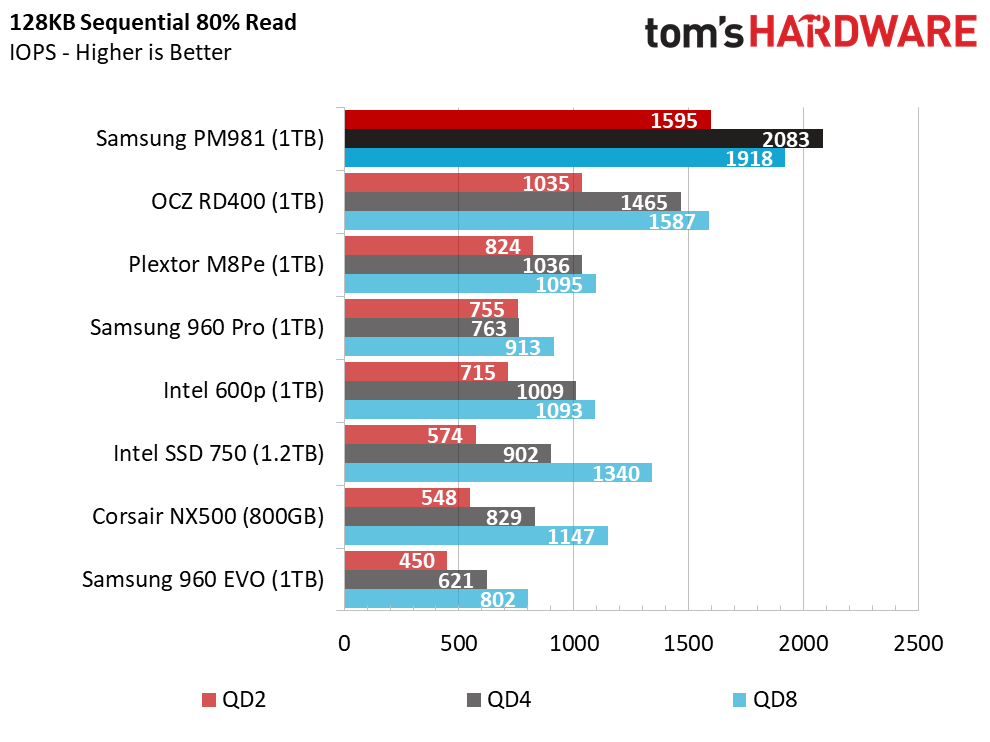
The PM981 takes off during the mixed sequential workload. The PM981's mixed sequential performance is the highest we've recorded with a NAND-based product. Without question, this is much more important for desktop performance than the 100% read or write test results. This level of performance could not have come by accident. Samsung obviously tuned the Phoenix controller for mixed workloads.
80% Mixed Random Workload
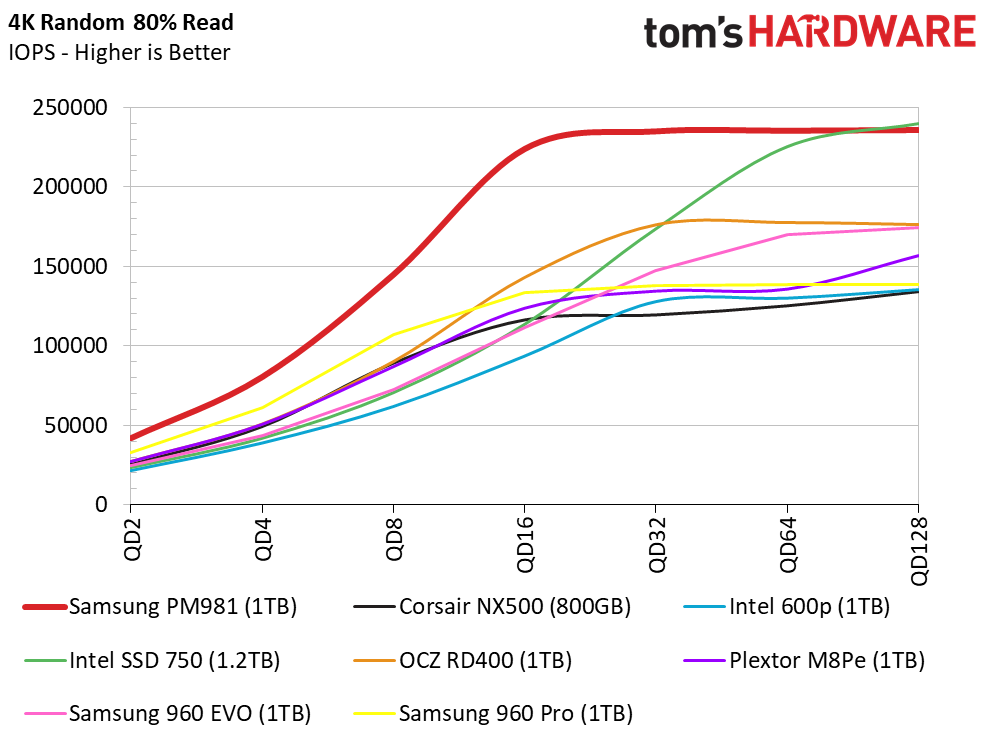
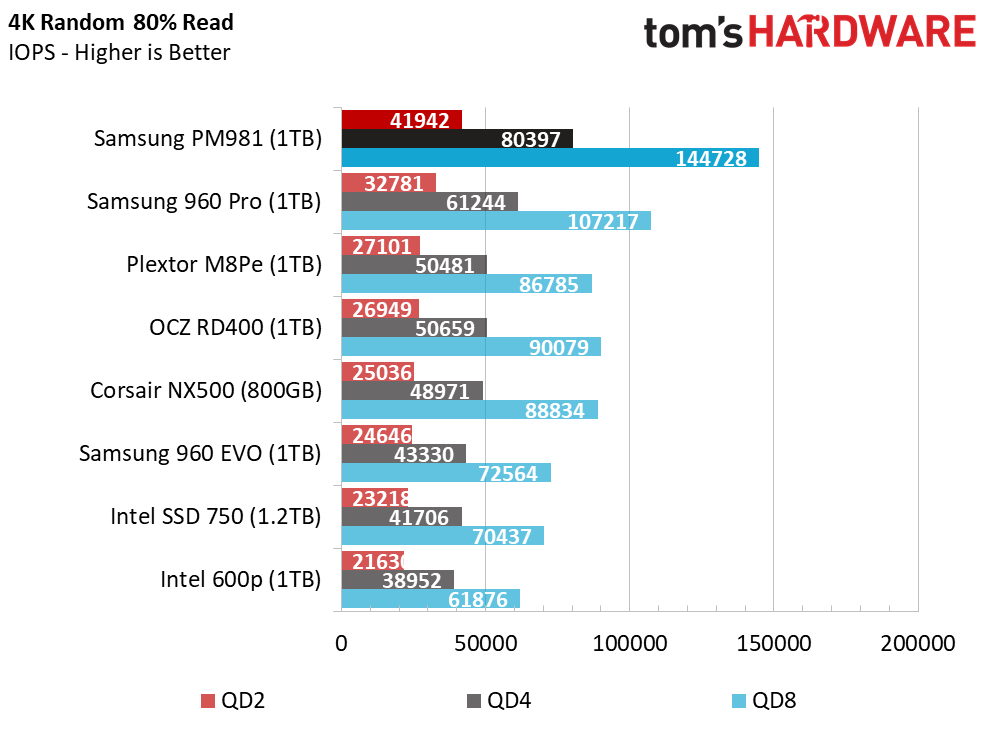
We also recorded a big performance increase with mixed random workloads compared to the previous-gen Samsung NVMe SSDs. The PM981 provides nearly 10,000 more random IOPS than the 960 Pro at QD2. The drive also peaks at QD16 while many of the other products need much higher queue depths to reach peak performance. Delivering higher levels of performance under lighter mixed workloads results in a much snappier user experience.
Sequential Steady-State
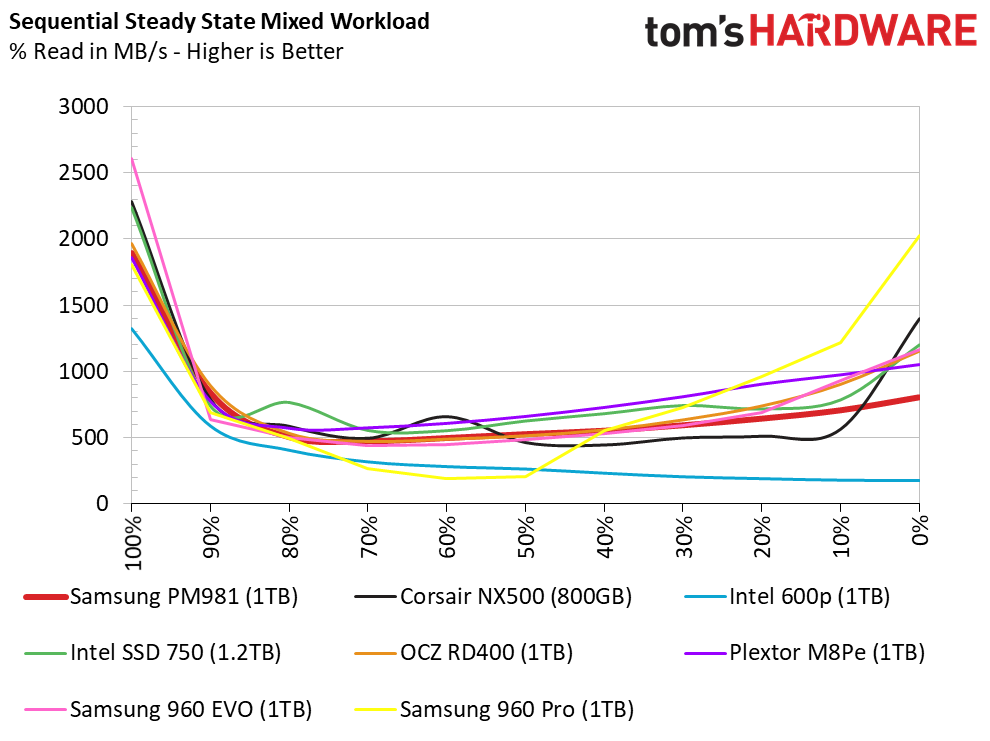
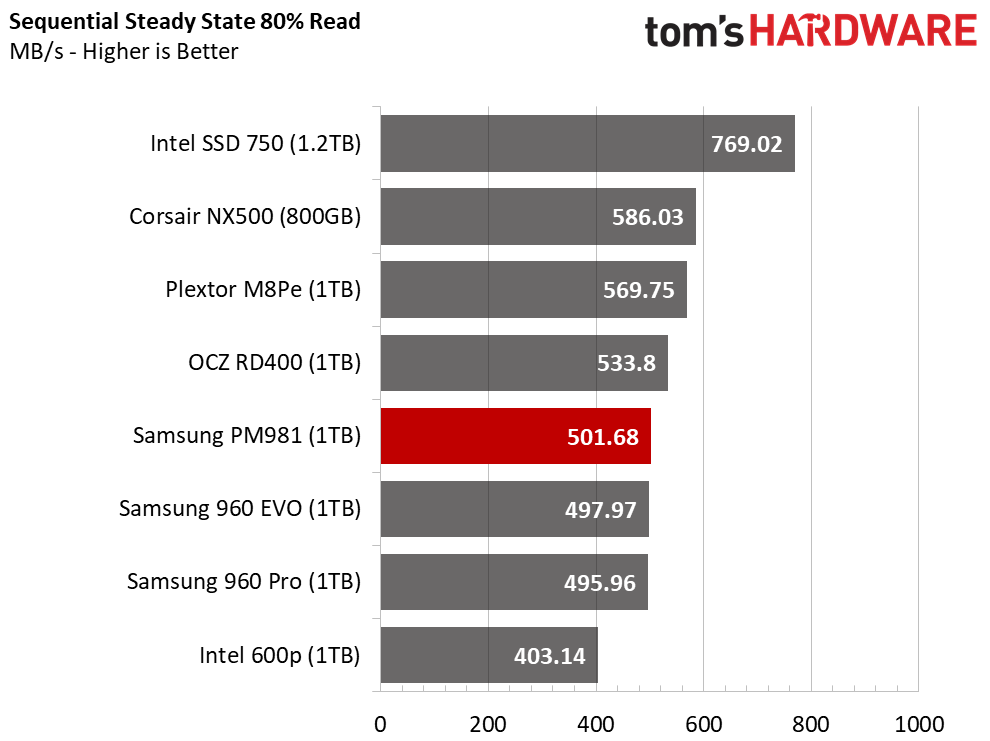
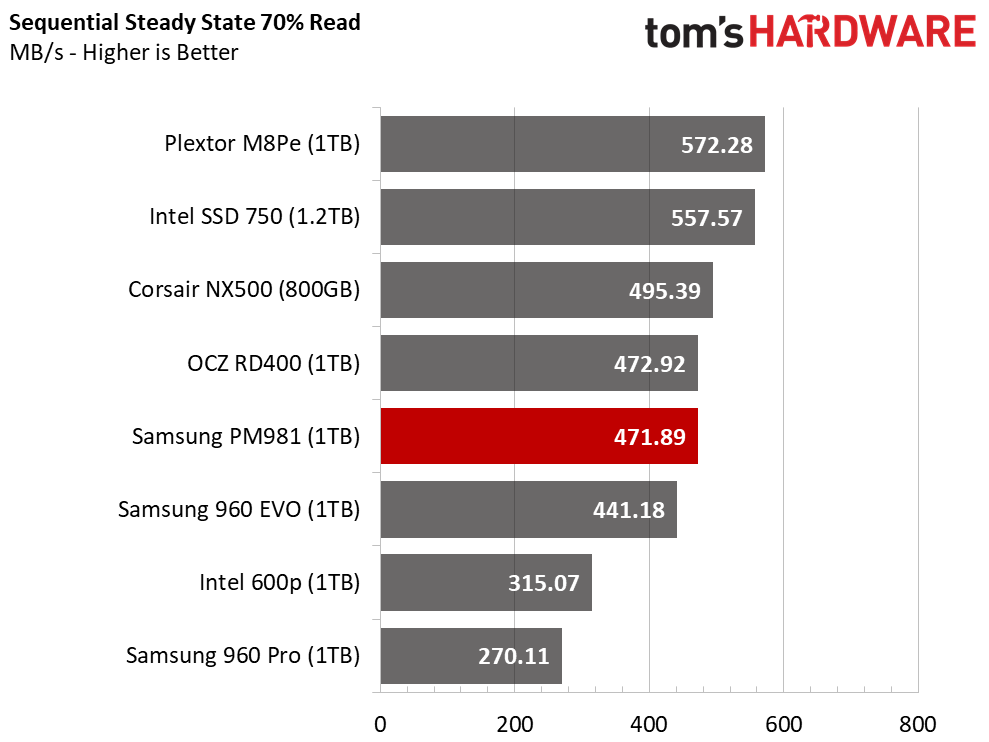
We've shied away from discussing workstation workloads with TLC SSDs, but it's time to stop using the flash as an excuse. The reality is that MLC SSDs will disappear in 2018 and your only options will be expensive 3D XPoint or TLC SSDs.
The Samsung PM981 is the fastest TLC drive in steady state. It also outperforms the 960 Pro in 70% and 80% mixed workloads.
Random Steady-State
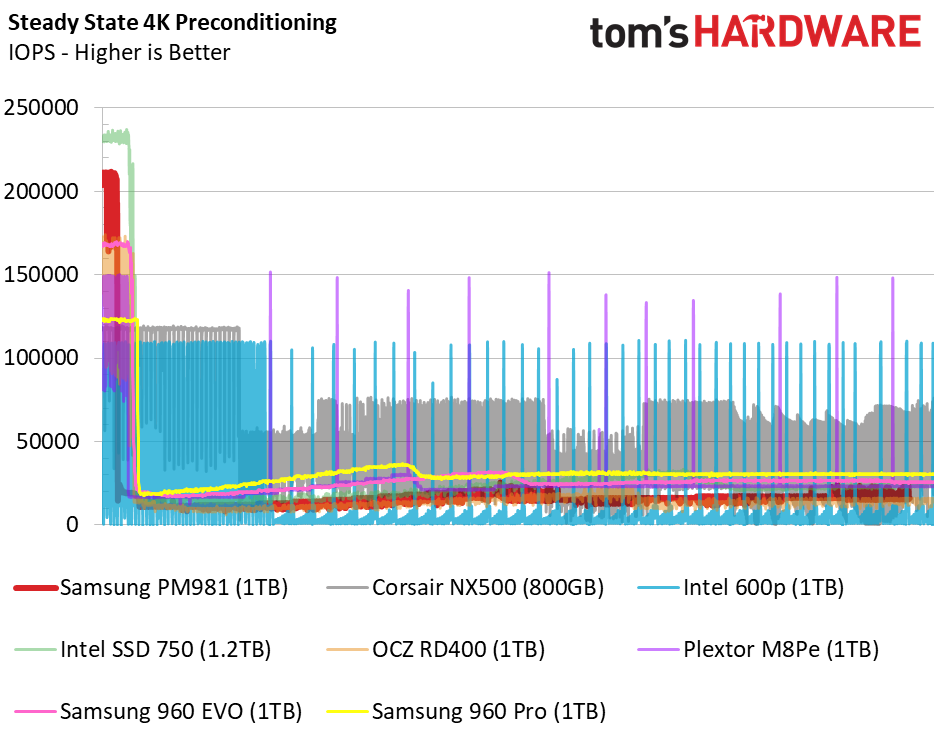
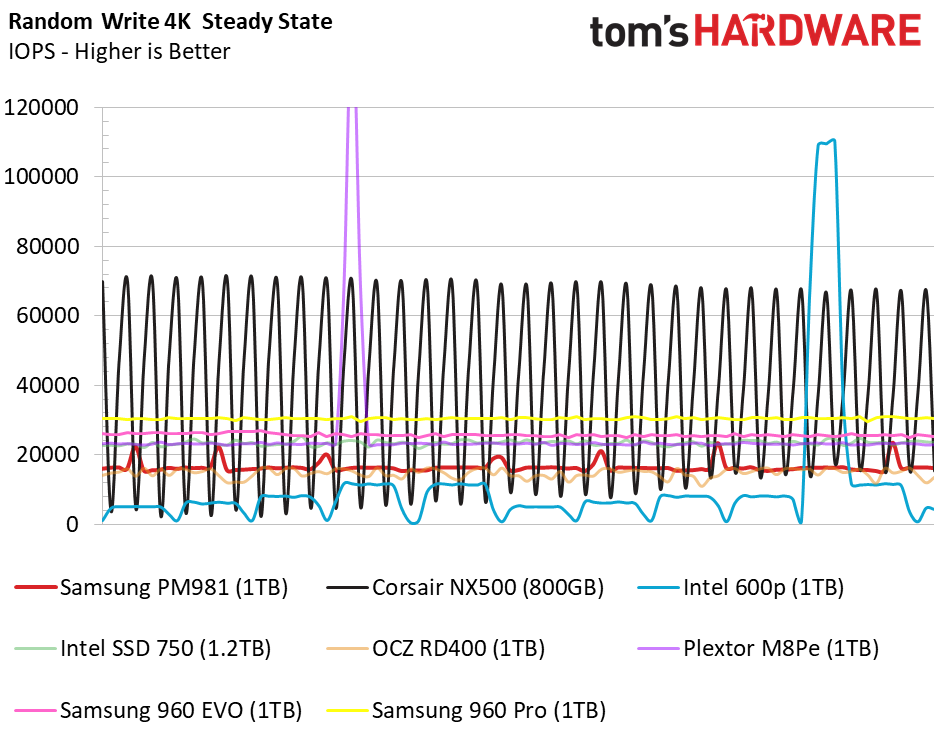
The PM981 1TB is well off the pace set by the 960 Pro 1TB during the extended random write workload, though it is fairly consistent. Surprisingly, the PM981 delivers slightly higher performance than the Toshiba RD400 that comes armed with 15nm MLC flash.
PCMark 8 Real-World Software Performance
For details on our real-world software performance testing, please click here.
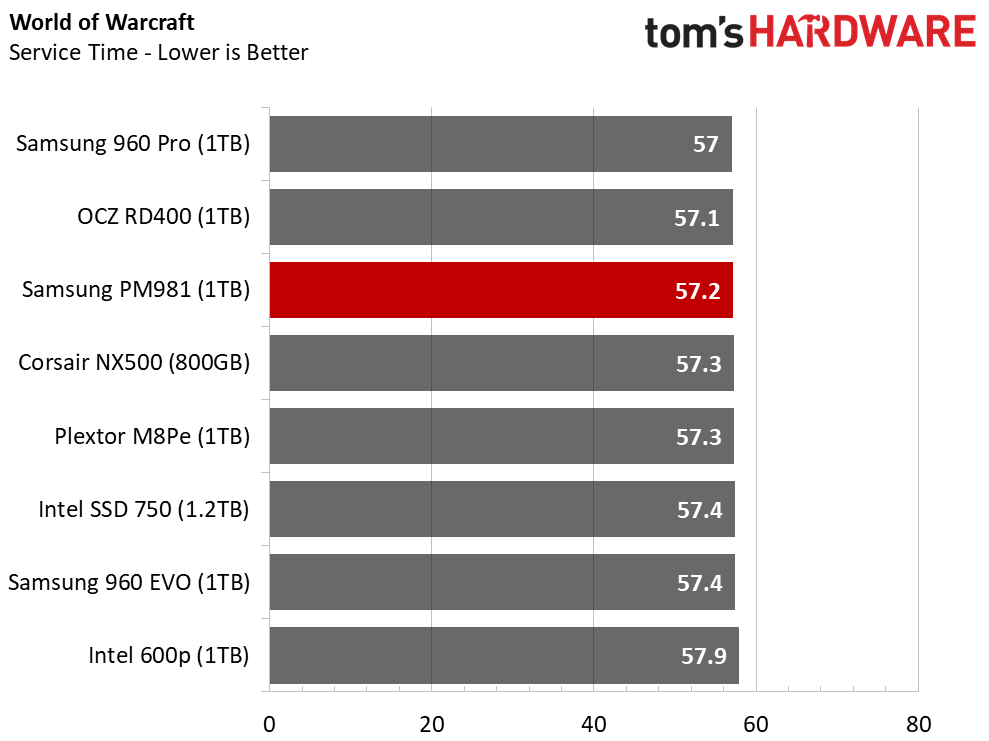
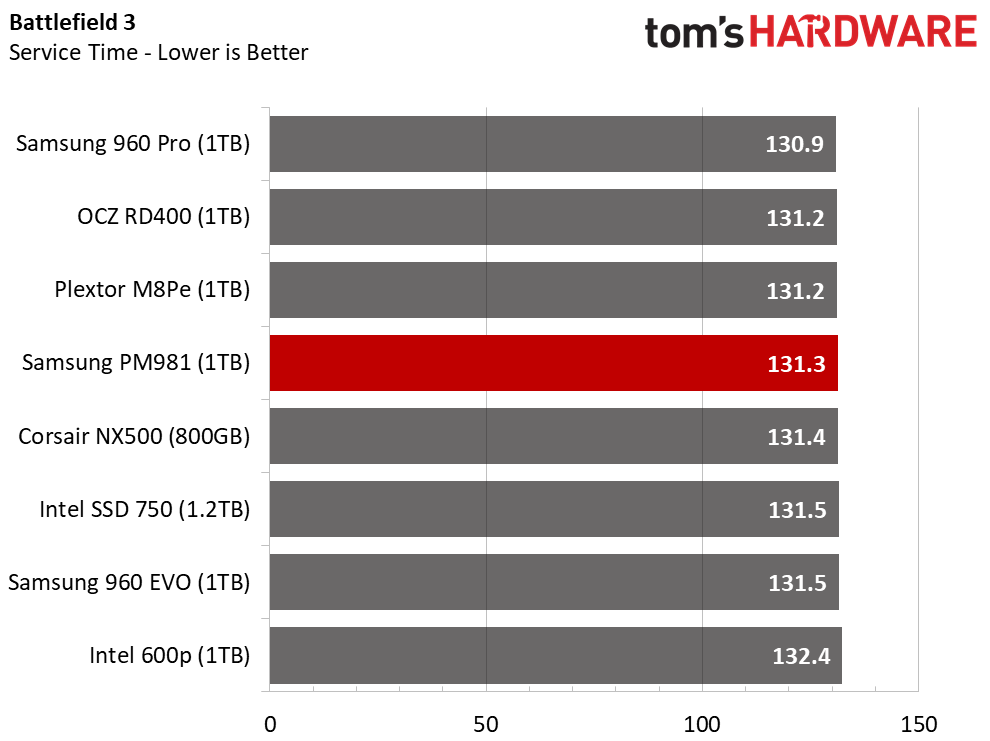
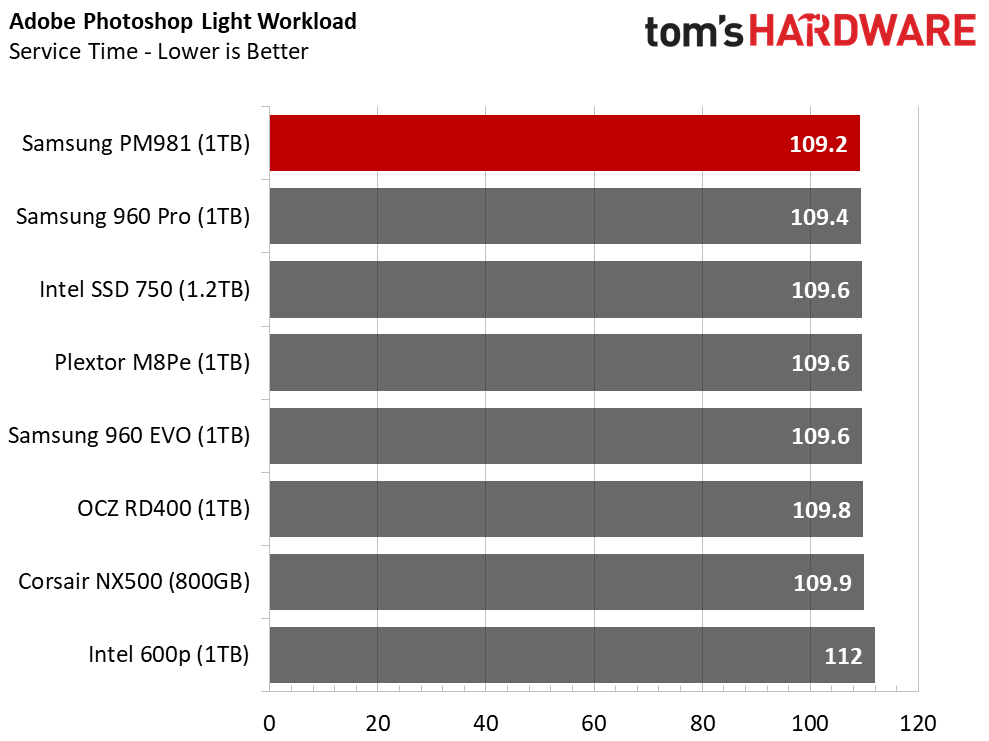
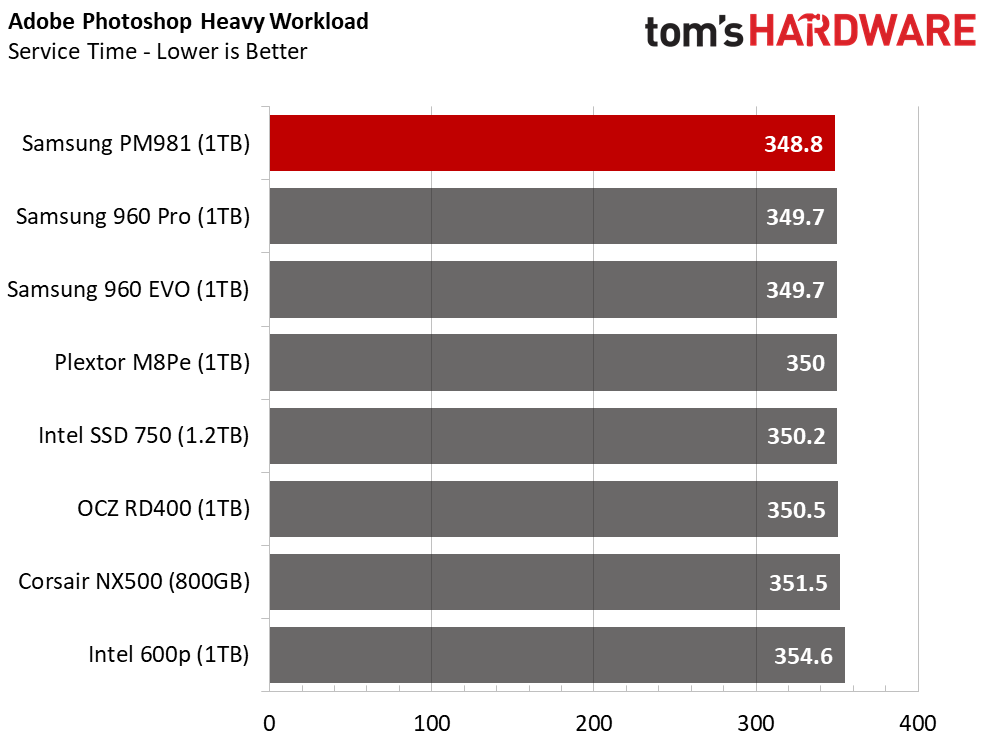
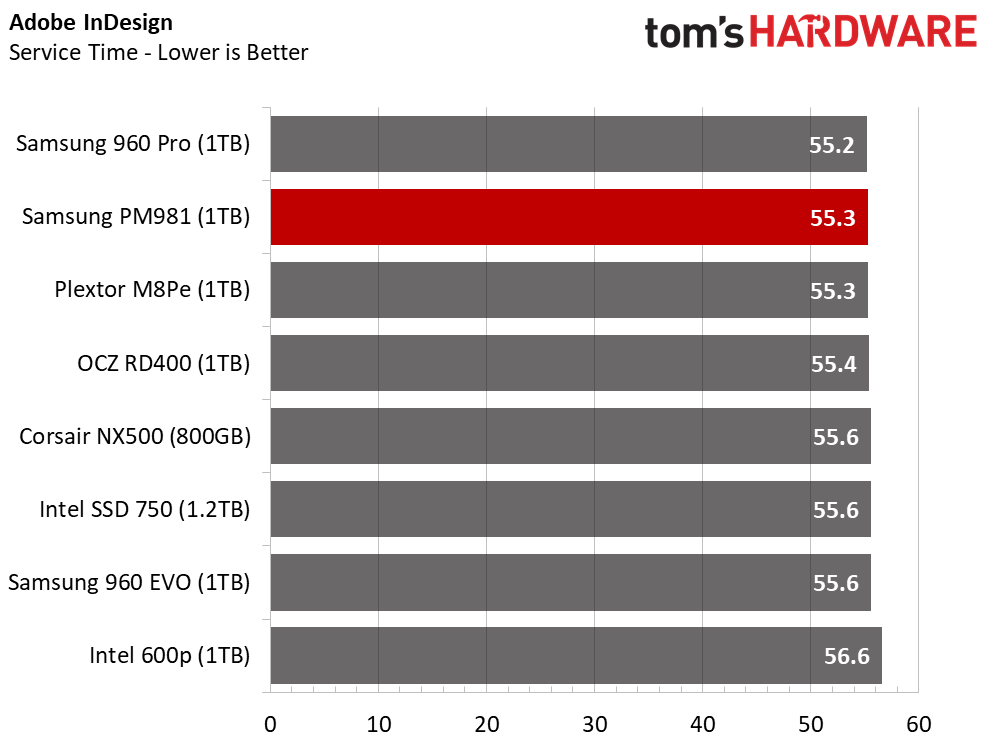
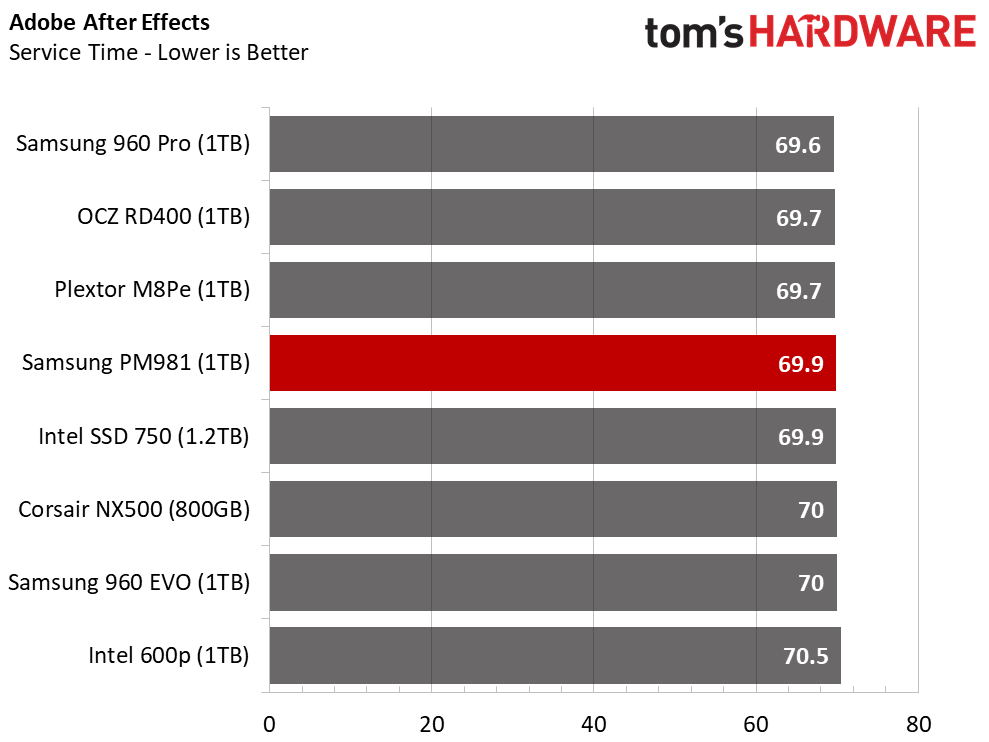
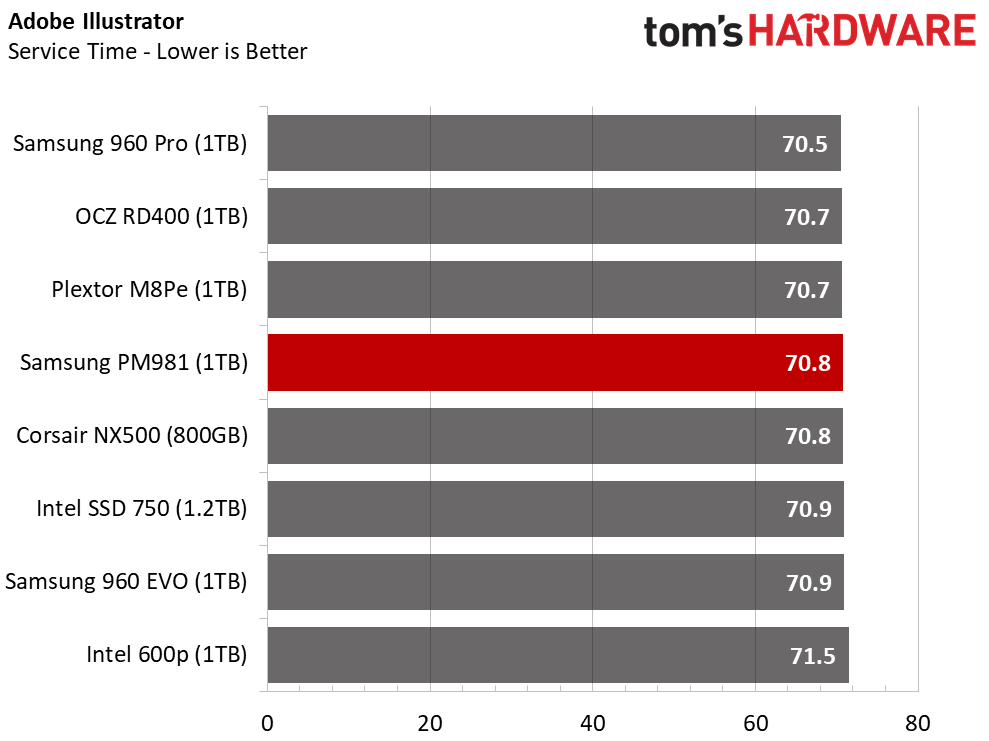
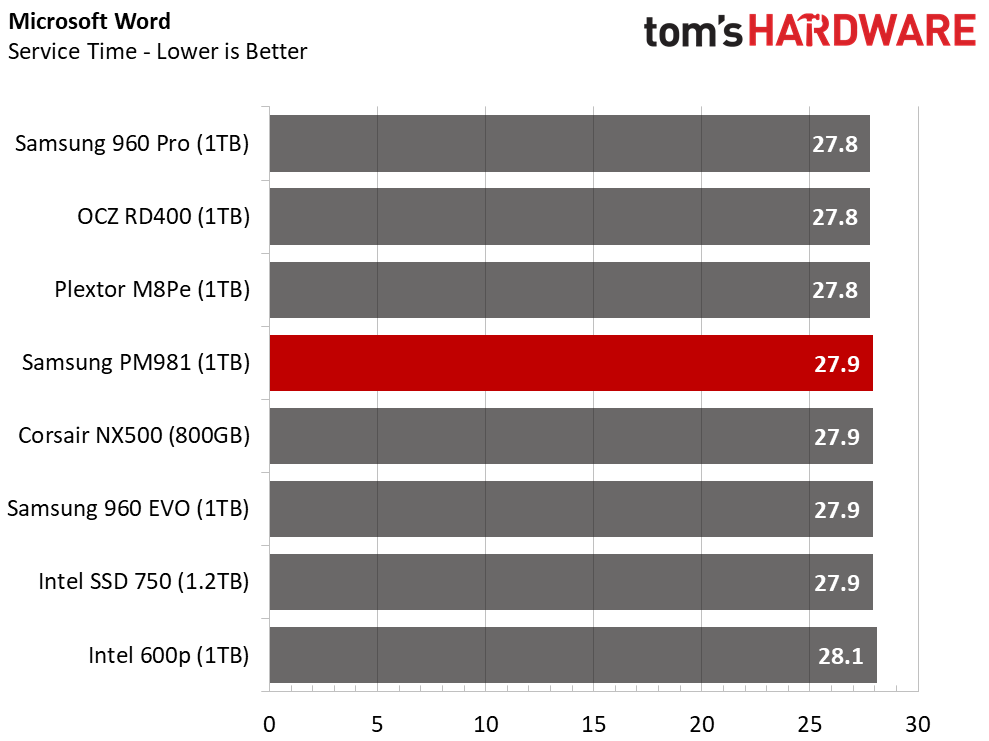
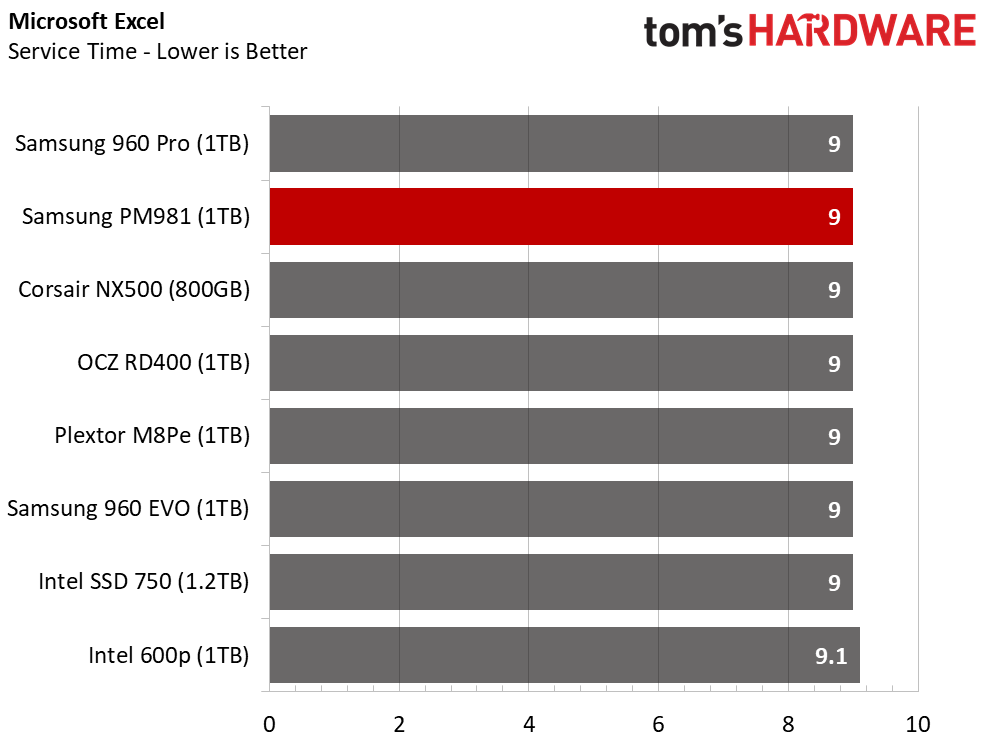
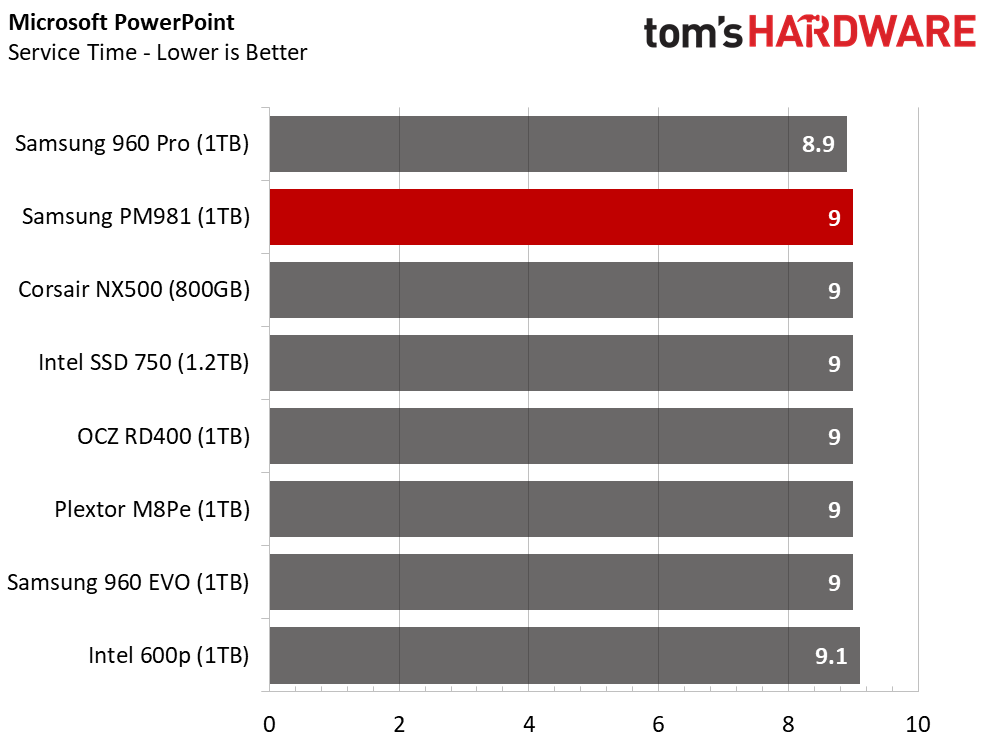
They say you take two steps forward and then take one step back. The PM981 failed to unseat the 960 Pro 1TB from its leading position in many of the application tests. The PM981 did lead the Heavy Photoshop test. Usually, TLC SSDs lag well behind MLC drives in that test.
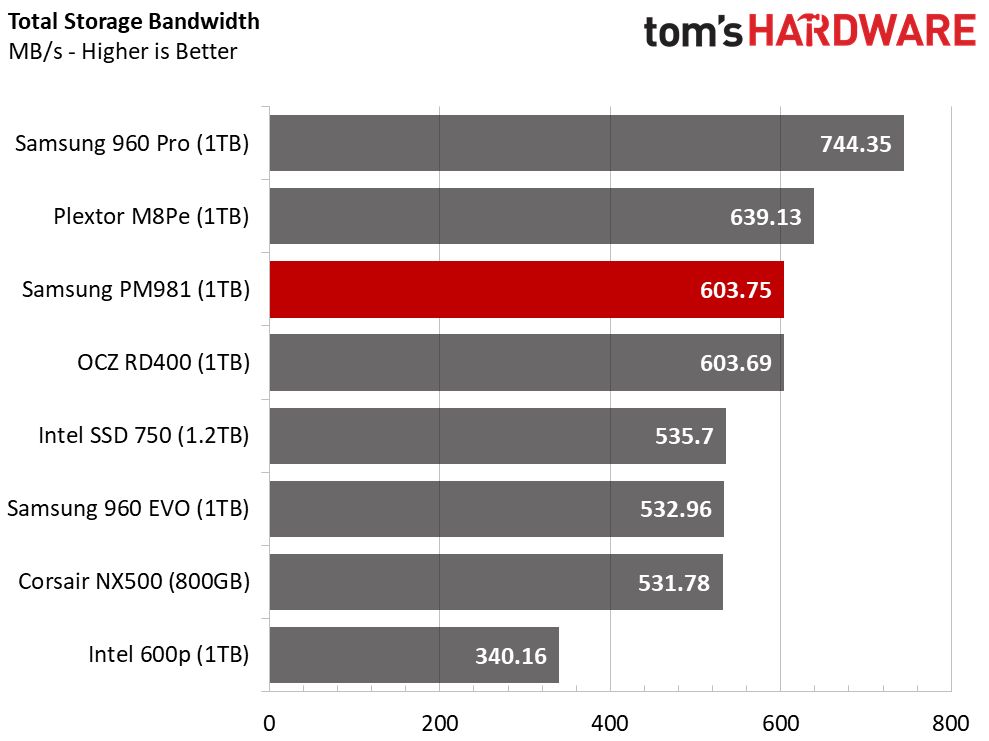
Application Storage Bandwidth
The PM981 1TB gives you 70 MB/s more performance than the 960 EVO 1TB in the PCMark 8 Standard Storage Test. The 960 Pro 1TB still holds a 140 MB/s advantage
PCMark 8 Advanced Workload Performance
To learn how we test advanced workload performance, please click here.
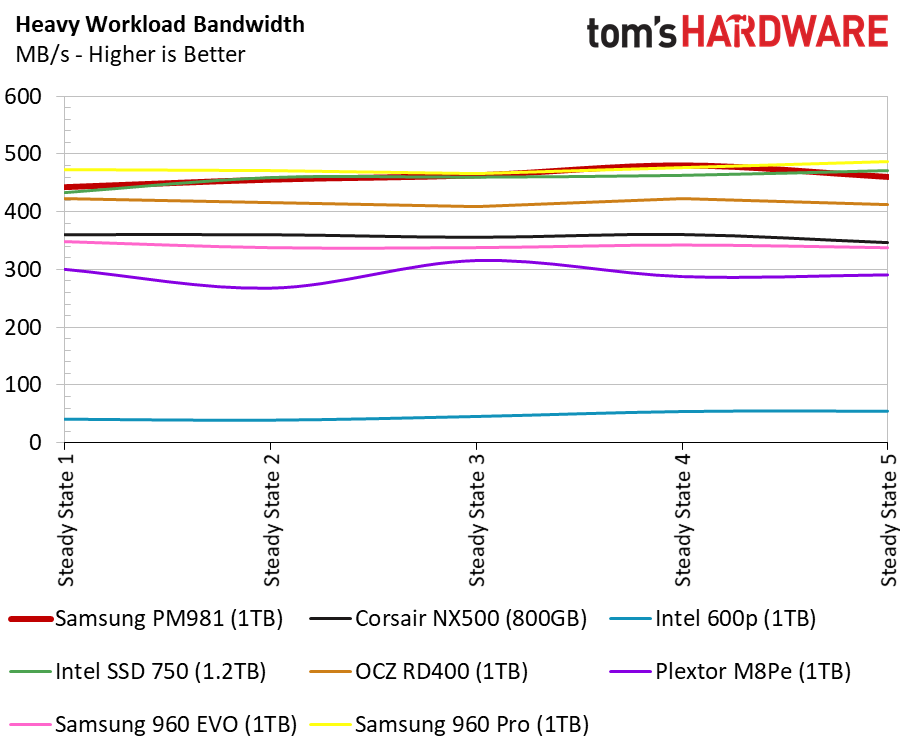
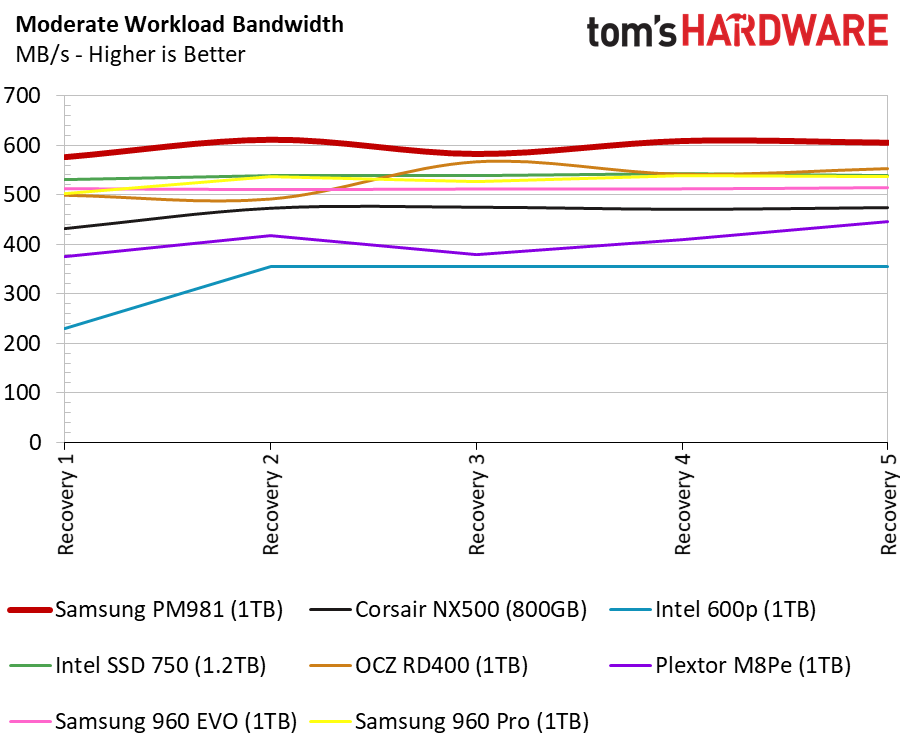
During a more strenuous workout, the PM981 rises to the top where it matters. The faster 1Gb/s NAND interface and Samsung's already aggressive background operations help during lighter consumer-focused workloads.
Total Service Time
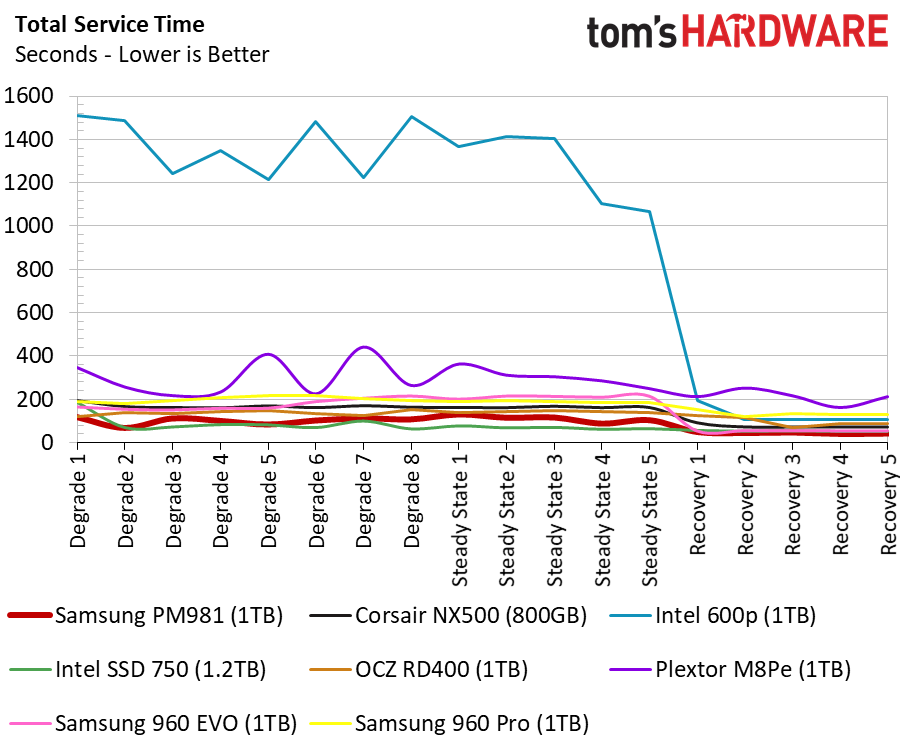
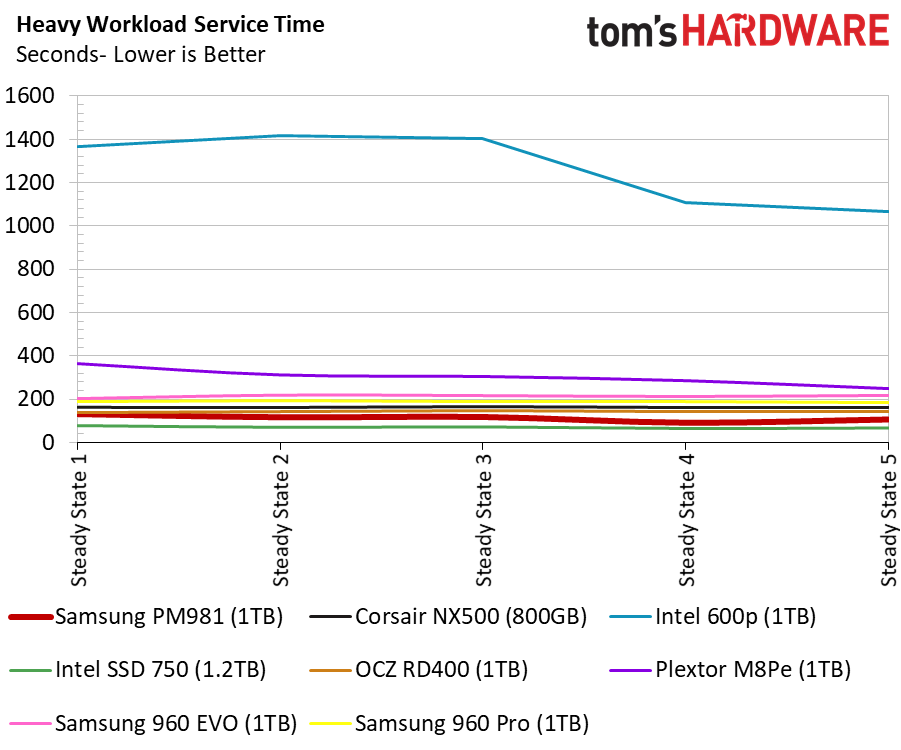
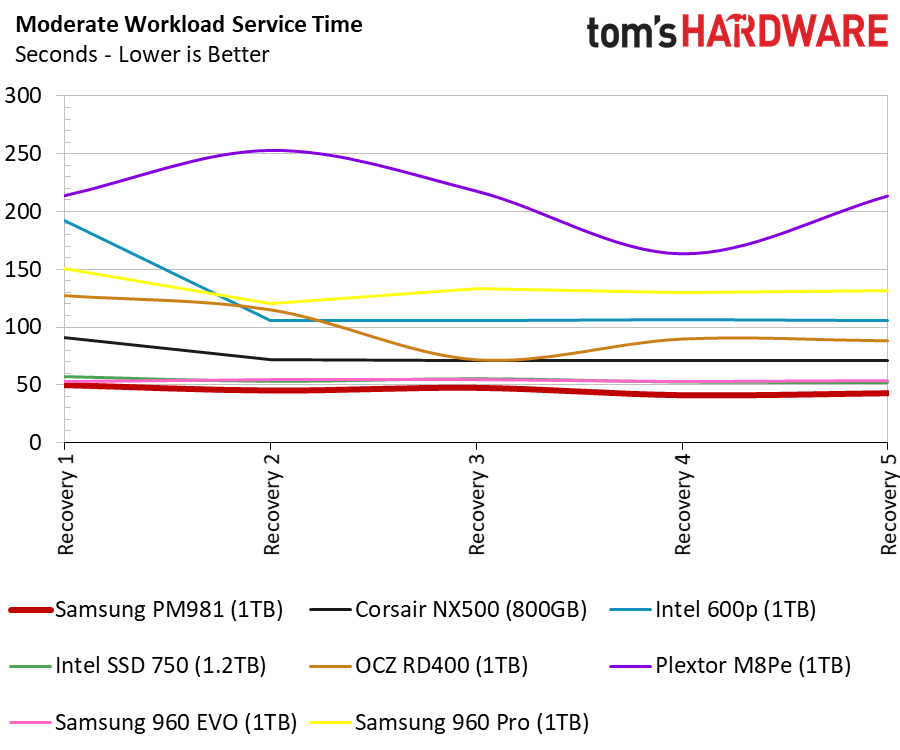
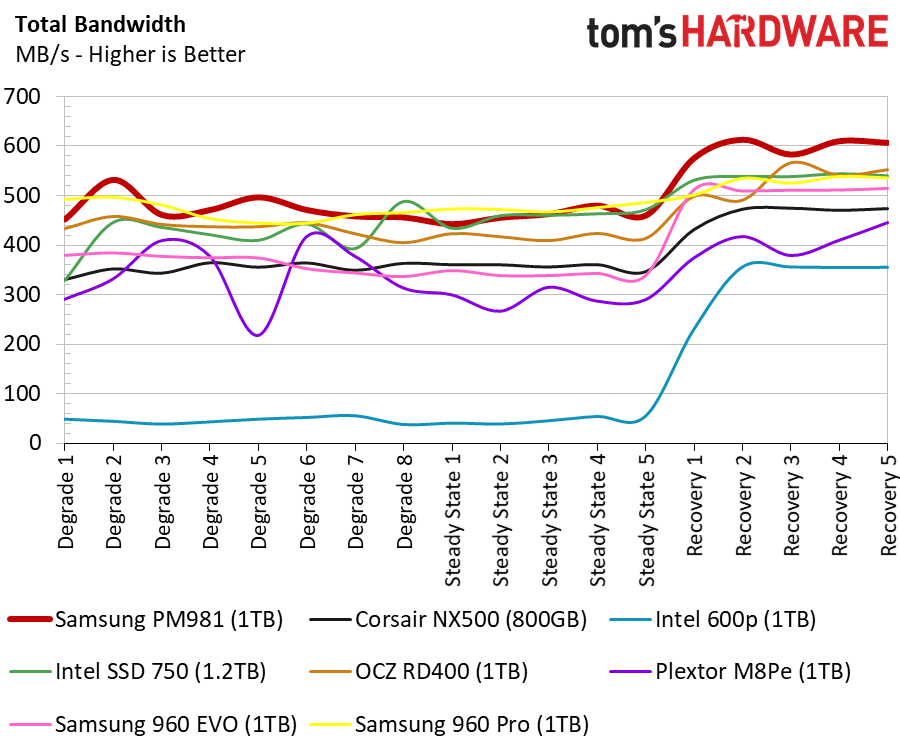
Many have asked over the years why SSDs slow down after several months of use. This test allows us to simulate months of use in a brief 24-hour period. The early degradation cycles push the drives down into a steady state by dirtying the cells. The drive bounces back to its long-term level of performance during the recovery phase.
The PM981 is the new latency leader for NAND-based devices during the recovery stages.
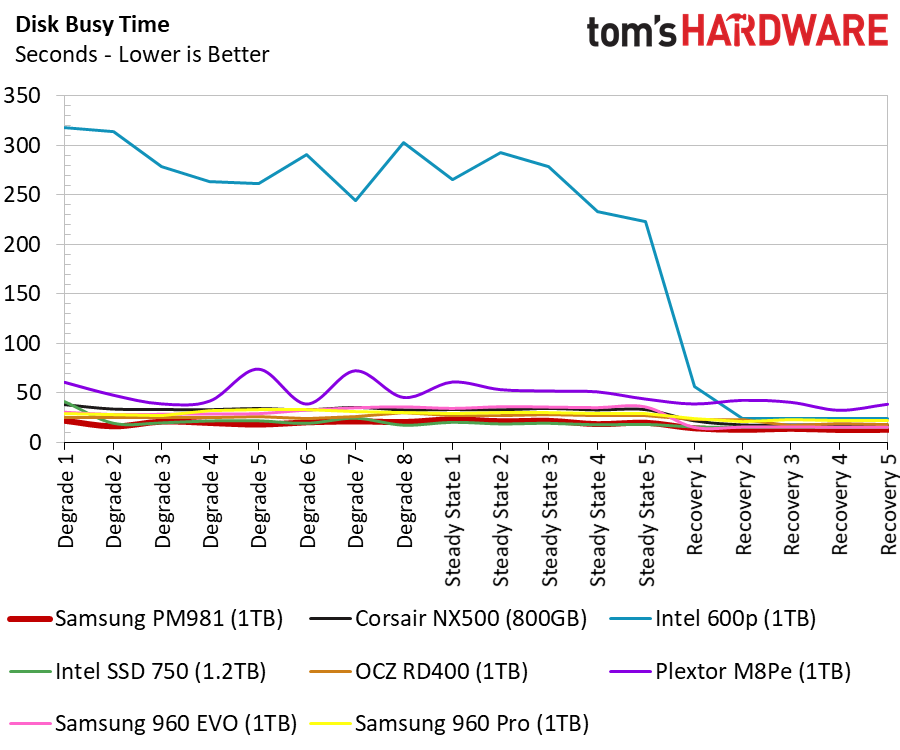
Disk Busy Time
The disk busy time test measures how long the drives were active during the test. The PM981 didn't have to work very hard to complete the workloads.
Responsiveness Test
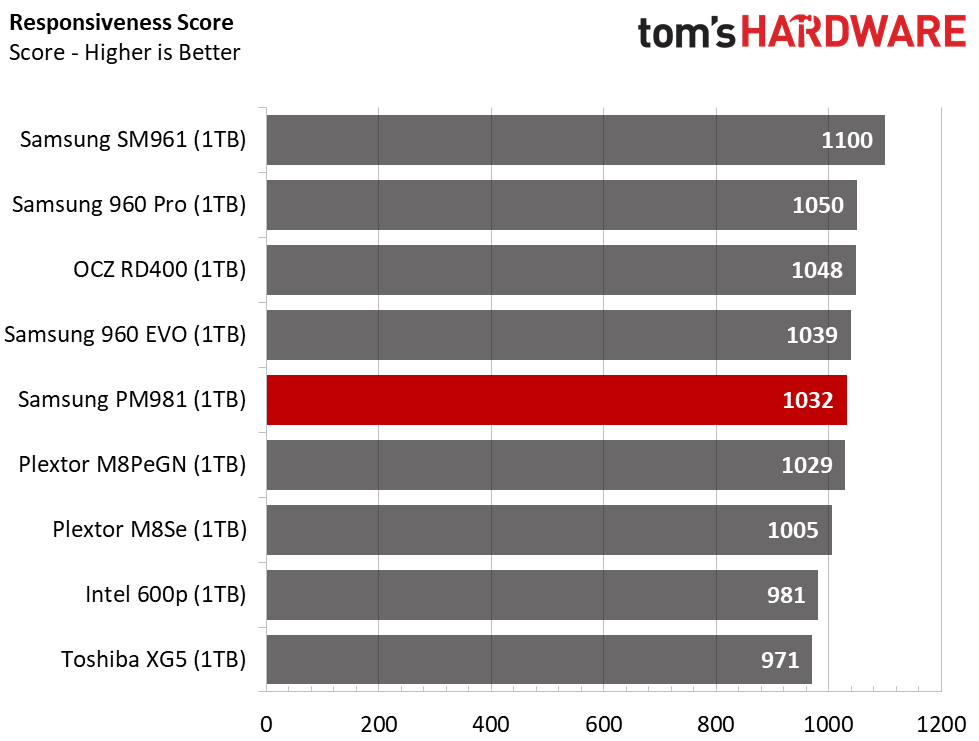
Responsiveness is another way of measuring the user experience. Many factors come into play during this test, and it's difficult to ”fake” strong performance. The PM981 slightly trails the other Samsung NVMe SSDs in this test, but it performs much better than the other TLC-based SSDs.
Notebook Battery Life
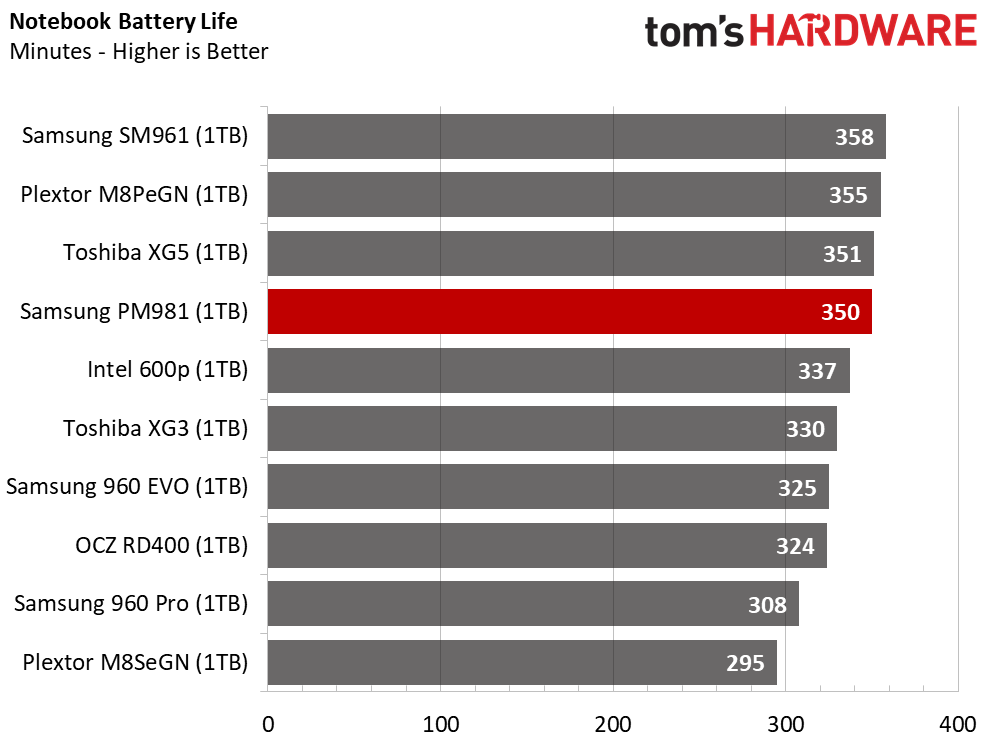
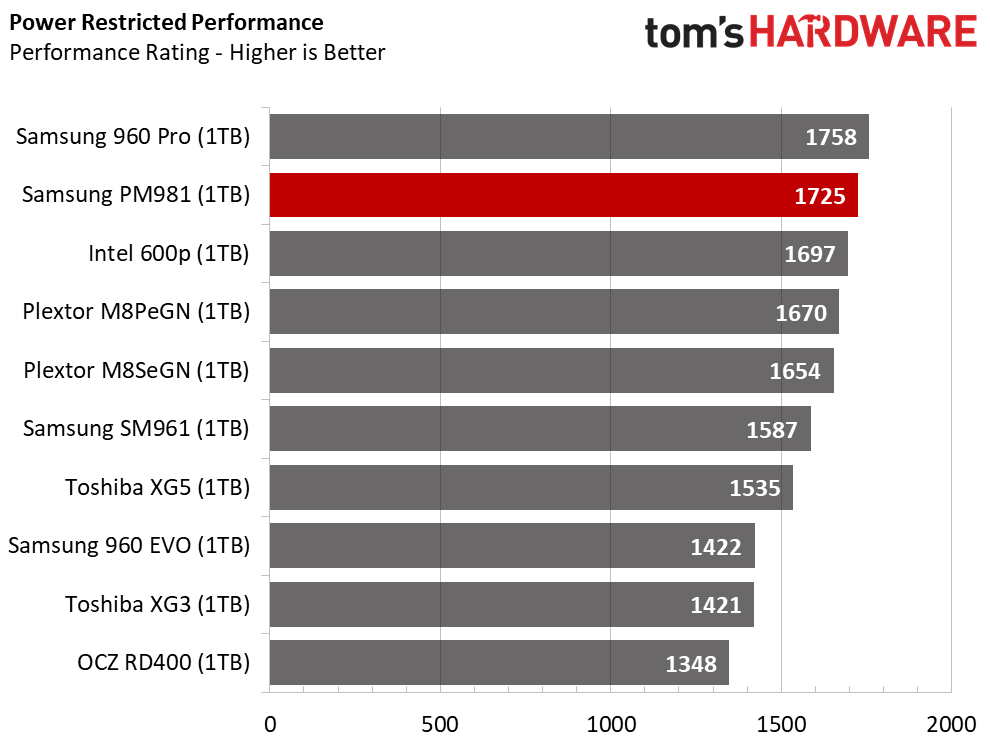
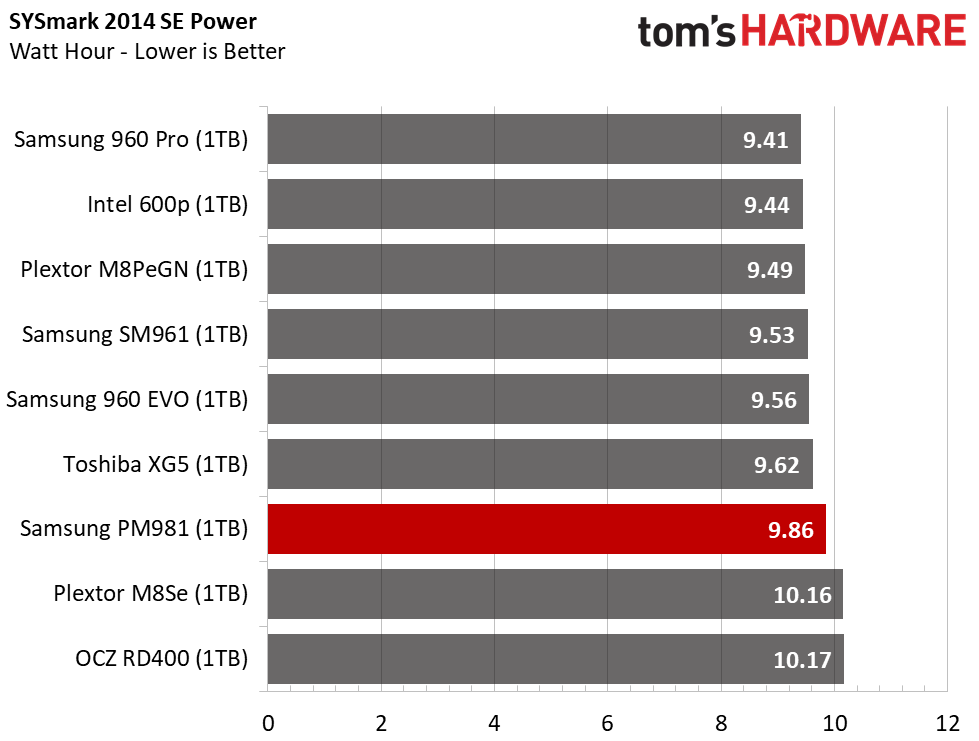
The PM981's notebook battery life results are very interesting. On the one hand, TLC consumes more overall power due to increased error correction and control algorithms, wear leveling, and background activity. On the other hand, Samsung reduced the die power input from 3.3v with 48-layer NAND to just 2.2v for the new 64-layer NAND.
The new hardware combination places the Samsung PM981 near the top of the battery time and performance charts. This shouldn't surprise anyone since OEMs steer tuning for mobile use in notebooks. The PM981 1TB is currently shipping in the Lenovo Yoga and unknown models from Dell and HP.
MORE: Best SSDs
MORE: How We Test HDDs And SSDs
MORE: All SSD Content
Current page: 1TB Performance Testing
Prev Page Features & Specifications Next Page 512GB Performance Testing
Chris Ramseyer was a senior contributing editor for Tom's Hardware. He tested and reviewed consumer storage.
-
kiniku "The PM981's biggest drawback is TLC NAND, and as a result, sustained write performance took a step back." For most high-end gamers this won't be a factor unless you are writing multi-GBs of data back at a time back to the SSD. Which is why most gamers are throwing money away buying the "PRO" version of Samsung's NVE SSDs.Reply -
dgpadia Here's a question. I have a Lenovo Thinkpad Yoga 15, 20DQ Series. 200 or so SSD. Would I want to upgrade to this? Would absolutely kill my battery? If so, is there a better option. Let's assume reasonable budget (no more than $600-700, tops)Reply -
doesitmatter There's an error on page 2 in the Sequential Write Performance charts. The bar chart for QD2 128k write for the 960 Pro 1tb doesn't agree with what the line graph says. The bar chart shows it at 1544MB/s (exact same as the PM981), but the line graph shows it somewhere between 2100MB/s and 2200 MB/s, which should make it the top performer on the bar chart.Reply -
mapesdhs Why are PCMark 8 tests still included? They've never shown statistically meaningful or useful differences between products. The variation in results is miniscule.Reply -
AgentLozen ReplyGASARAKI said:Not impressed.
Hey! Thanks for the comment Gasaraki! Short, sweet, and to the point. I was sort of curious as to WHY you weren't impressed. You sort of left me hanging, but that's alright.
I think there's a lot to be excited about with the PM981. There are also a few disappointments.
I really liked the mixed work load performance. At low queue depth, the PM981 performed exceptionally well. Also, the battery life was a nice improvement over Samsung's last generation TLC drive (the 960 EVO).
With that said, I think the most interesting comparison to make is between the 960 PRO and the PM981. There were a number of sequential and random benchmarks where the PM981 wasn't as good a performer. I expected some inadequacies between MLC and TLC flash, but even the 960 EVO (with TLC flash) was beating it. The article states that the 64 layer flash being used in the PM981 was supposed to be faster and more power efficient. Is it a problem with the Phoenix controller? The author of the article claims that the culprit was probably thermal throttling.
Personally, the news I'm most happy to see is the pricing. I know $400 for 1TB probably doesn't reflect the final price of the consumer Samsung 980 drive due out in a few months, but if we could get this level of performance for $.40 per GB, that would be really terrific.
Edit: Typo and clarification -
Green_4 Can you please inclunde in this charts Intel Optane SSD 900p .... http://www.tomshardware.com/reviews/intel-optane-ssd-900p-3d-xpoint,5292-2.htmlReply -
Brian_R170 Reply20432954 said:Why are PCMark 8 tests still included? They've never shown statistically meaningful or useful differences between products. The variation in results is miniscule.
They pretty much show that the difference between the best and the worst SSD is hardly noticeable to most users.
Reviewers have found ways to use real applications to show CPU and GPU performance, but all of the SSD tests that are "meaningful" are synthetic and therefor, not actually meaningful. I liken most of the synthetic SSD benchmark data to automobile reviews that tout a vehicle's top speed. It's cool data, but not useful to nearly any owner. -
CRamseyer If you know what you are looking at all of the tests from PCMark 8 on have meaning for most of our readers. Please see the How We Test SSDs and HDDs article for details.Reply
