Second-Gen SandForce: Seven 120 GB SSDs Rounded Up
Benchmark Results: 128 KB Sequential Performance
SSD manufacturers often want to stress random performance because it's a clear case where they decimate conventional hard drives. Sequential performance is a little different, but still represents an important aspect of performance to examine.
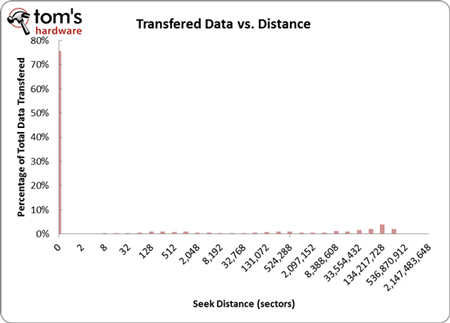
But how pervasive is sequential performance for the average user? Take a look at the graph below; it shows the distribution of all the seek distances from one of our traces.
The first thing you'll notice is that there's a preponderance of activity zero sectors away, which means that our trace is made mostly of back-to-back requests, or sequential I/O. If the trace was 100% random, none of the accesses would be zero sectors away. But that's the opposite of what we see here. Why?
Much of what you read and write to your storage device on a day-to-day basis is random in nature. But over the course of days and weeks, the read-modify-erase-write cycle has a significant effect on the sequential and random I/O balance. When you write random data, the block containing that data is going to accumulate invalid pages as you delete information (blocks are made up of multiple pages), and if you have a block with a lot of pages that need to be moved, the SSD controller rewrites them sequentially. So, when you read back that information, you do so sequentially, even though it was originally written randomly. Eventually, over time, you see random reads turn into sequential reads. This isn't a wholesale transition; it largely depends on firmware and the SSD controller's architecture.
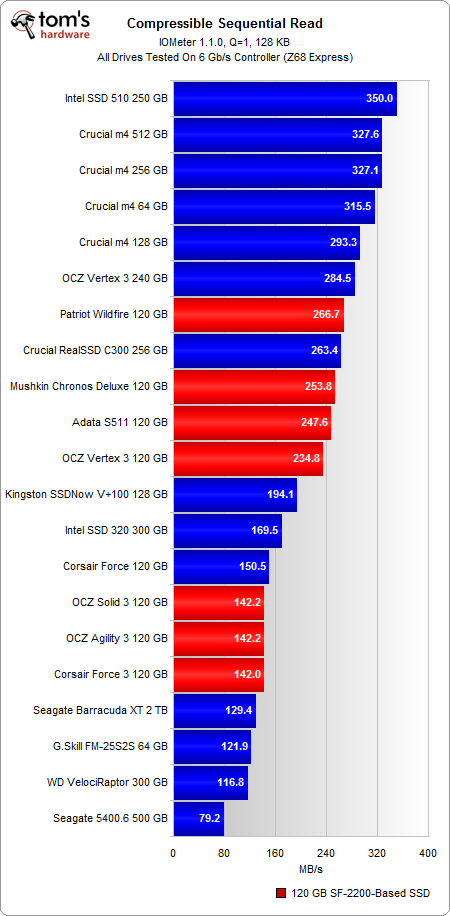
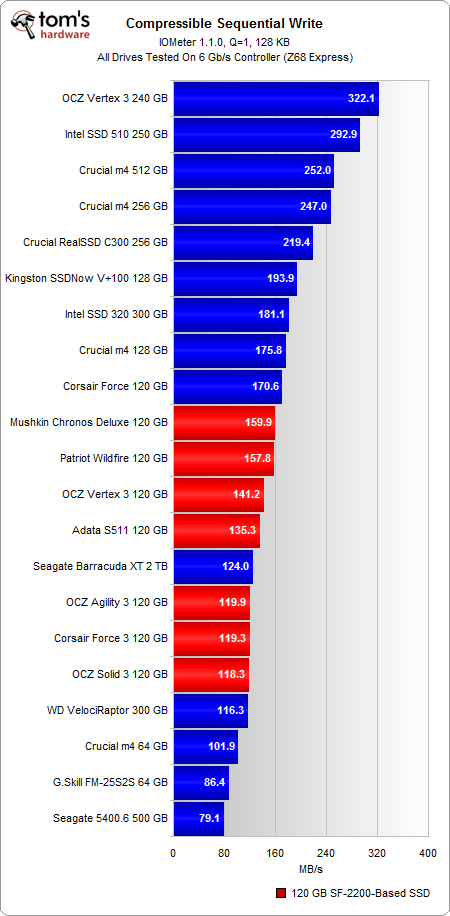
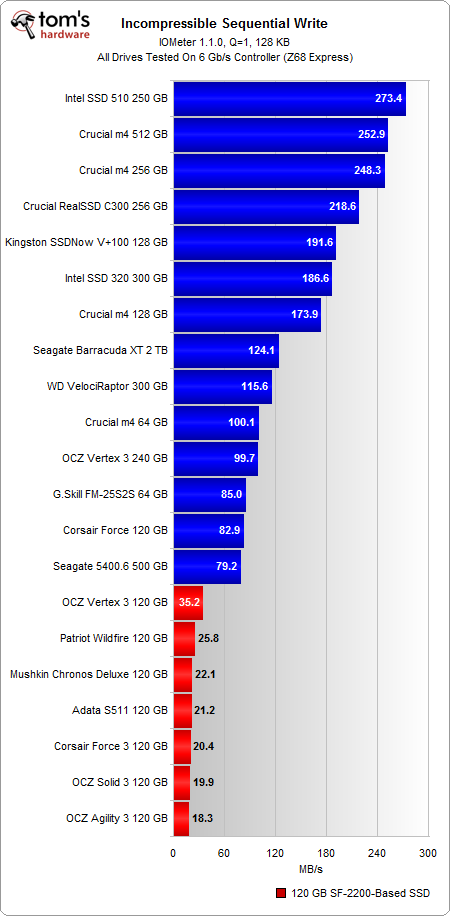
Intel's 250 GB SSD 510 leads the pack in reads, while the 240 GB Vertex 3 tops the chart in writes. Crucial's m4 drives perform admirably, but the 512 GB m4 falls 27% behind the 240 GB Vertex 3.
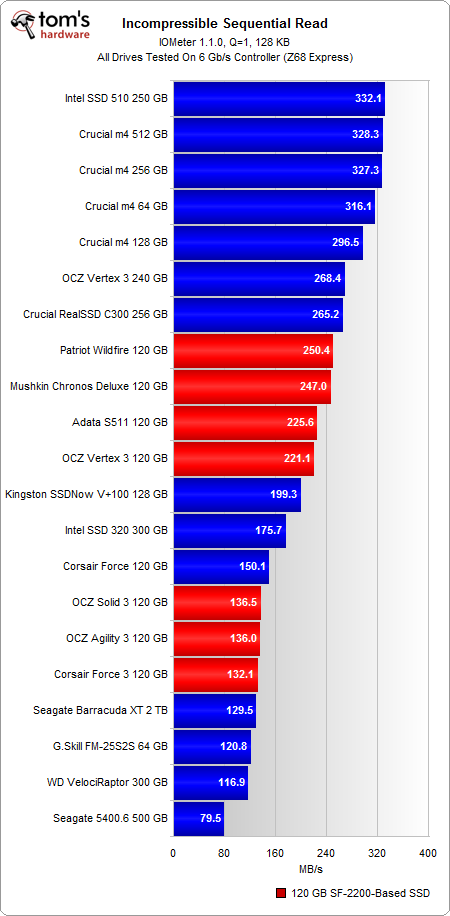
As we look at the 120 GB SF-2200-based drives, there's a clear difference between SSDs armed with synchronous and asynchronous flash. Drives with asynchronous memory (Solid 3, Agility 3, and Force 3) fall behind the pricier synchronous-equipped SSDs (Vertex 3, S511, Wildfire, and Chronos Deluxe) by at least 65%. In sequential writes, the delta is slightly smaller, ranging from 15% to 35%.
Don't be completely floored by those lower performance results. These aren't new-in-box numbers; they represent steady-state performance, which changes the behavior of the SSD. This is a particularly bad scenario because the testing happens after each drive is filled with incompressible data, but before idle garbage collection is able to help recover performance.
Get Tom's Hardware's best news and in-depth reviews, straight to your inbox.
As most of you know, SandForce's architecture is most efficient when it's operating on compressible data. In the real world, that's actually a pretty realistic expectation of what it'd be working with most often, making these results, again, a worst-case situation for the SF-2200-based drives.
Current page: Benchmark Results: 128 KB Sequential Performance
Prev Page Benchmark Results: 4 KB Random Performance (Response Time) Next Page Sequential Performance Versus Transfer Size-
dauthus The Corsair force series 3 drives should be instantly disqualified due to BSoDs etc. Go look at their reviews on newegg, it is horrifying.Reply -
garage1217 Nice review. You left out the corsair Force GT 120gb however which would have compared equally to the vertex as other sites have scored it. Also I own one, it ROCKS.Reply
On the force 3, it got horrible reviews because of a production issue. Corsair issued a full recall and now the issues with that particular drive have been cleared up which is why it was not disqualified. Very old news. -
dauthus ReplyOn the force 3, it got horrible reviews because of a production issue. Corsair issued a full recall and now the issues with that particular drive have been cleared up which is why it was not disqualified. Very old news.
You are wrong sir. -
gregzeng Googling told me that SSDs are almost impossible to use with Linux (EXT4). My netbook & notebook drives are in MS NTFS-COMPRESSED partitions (not Linux NTFS-4G, 'cos no compression). MS claims compressions has 'negligible' speed costs. Is that true, for about twice then storage space?Reply -
mayankleoboy1 why not include the max iops editions?Reply
anands benchies showed that 120gb vertex3 max iops ~= 256gb vertex 3 for quite a less price -
Hellbound This article mentions installing the OS and applications to SSD, and the rest (movies, music) to conventional hdd's. But I'm not sure how to do that. I've google'd it and there are many suggestions how to do it. I would like to know the best way to go about this.Reply -
whysobluepandabear HellboundThis article mentions installing the OS and applications to SSD, and the rest (movies, music) to conventional hdd's. But I'm not sure how to do that. I've google'd it and there are many suggestions how to do it. I would like to know the best way to go about this.WTF?Reply
Step 1.) Install SSD.
Step 2.) Install OS on SSD and everything you want to access and run quickly.
Step 3.) Install HDD.
Step 4.) Send files to E, F, G, H, I, J or whatever drive the HDD is. Performance orientated apps go to the C, or whatever drive your SSD is.
It's literally no different than if you were to plug in an external HDD via USB. You direct files and applications as accordingly.
We'll dismiss the Z68 - which allows you to use a small SSD to boost your normal HDD - otherwise if your SSD is large enough, it's actually a worse route, and just instead use the SSD. -
flong This is a superb review because it deals with real-world performance. I commend Tom's for providing a thorough review - one of the most thorough that I have read on any computer site. Tom's is right, the 120 GB size SSD is the sweet spot in SSD drive performance Vs cost.Reply
If you read similar reviews on other sites, the Patriot Wildfire, The Corsair Force 3 GT and possibly the OCZ Vertex 3 are the top performers in the 120 GB drive performance. The Wildfire uses 32 NM Toshiba toggle flash memory which is the best. The Force 3 GT uses 25 NM memory but somehow manages to keep up with the Wildfire. Note this is not the Corsair Force 3 listed in this review, it is the Corsair Force 3 GT - emphasize the GT. The GT and the wildfire are the two fastest 120 GB drives available right now based on real-world performance benchmarks.
The real important benchmarks to watch for are the real-world benchmarks at the end of each review. These really are the only ones that count. The other benchmarks are synthetic and they are not very accurate. The OCZ drives win all of the synthetic benchmarks but their real-world performance falls behind the Force GT and the Wildfire.
Another critical factor is that "fill-rate" performance of the drives. This is the performance of the drives as they fill. Again, the Wildfire and the Force GT rise to the top with the Vertex 3 coming in third place.
This review lists the Mushkin as a top performer, but it is not listed in many reviews (none that I have read) and so I have not included it in my comments. It is possible that this is a top performer also but I would like to read other reviews about it to confirm. -
Same thing with OCZ, to be honest. They got an error rate of 33% over at Newegg. Honestly I won't buy a single drive from them, no matter how fast, until they've fixed their issues that have lasted for two bloody generations.Reply
Crucial m4 for performance and Intel 320 for value is the best. -
compton HellboundThis article mentions installing the OS and applications to SSD, and the rest (movies, music) to conventional hdd's. But I'm not sure how to do that. I've google'd it and there are many suggestions how to do it. I would like to know the best way to go about this.Reply
Besides just manually managing your files on the HDD, there is another method you can use. It's more complicated to set up, but if you can google and follow directions, you'll find it may be easier.
With Windows 7 you can basically take your "My Documents" folder (the \Users\ stuff) and symbolically link the folders to the mechanical HDD. Everytime an application wants to save to one of your document folders, which would otherwise be on your system drive (in this case a SSD) will just end up on the HDD. From a file management perspective, you may find it easier.
I do it manually -- just install Windows, Office Pro 2010, Pantone, Google Chrome, iTunes, ect. to the SSD. All of my music, movies, backups of my SSD (I'm only using about 22GB of my Intel 510's 111GB) end up on the HDD. My Steam folder is about 200GB as well, so it goes on the HDD.
You just have to do stuff like change iTunes folder in advanced options to the folder on the HDD. It's really easy to do. That way, when I want to use another SSD, I have all the Steam games and media on the HDD. Fresh installs are really easy this way.
I tried installing some of my games on a few of the SSDs I own. Some games can really benefit, but mostly the increase in speed over a fast HDD isn't worth it.
I bought an original WD Raptor 36GB drive in 2003 that I used for many years, so I was completely comfortable trying to manage the stuff that ends up on my HDD. I ended up moving from a 60GB SSD to a 120GB SSD that is faster but I just can't bring myself to put much on it.
