Intel SSD 520 Review: Taking Back The High-End With SandForce
Breaking Out New Benchmarks
The business of SSD reviewing has evolved quickly over the past couple of years. On one hand, you have vendors who run their tests in such a way as to demonstrate maximum performance using settings that typically wouldn't be found in a desktop environment. This is the way a great many tests are run because, frankly, it's a good way of exploring the differences between drives.
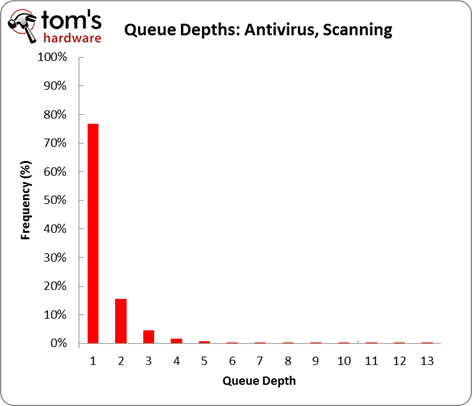
On the other hand, though, if you try to represent what most enthusiasts do on a daily basis, you don't end up exposing what an SSD is actually capable of, even if you paint a more realistic performance picture. It's a matter of relevancy, and that's why we focus a lot of attention on queue depths that fall between one and four. As an example, the chart below shows that, during a virus scan, nearly 80% of operations are queued one-deep.
There's another variable to consider, too: the difference between logical (formatted) and physical (unformatted) performance. We’ve covered this before to a small degree in a section titled Understanding Storage Performance.
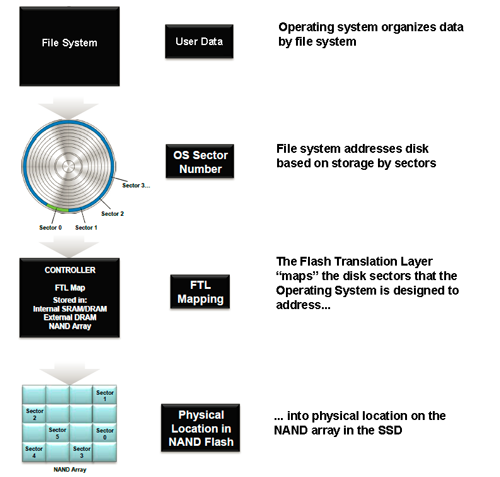
Solid-state drives employ a flash translation layer to map the sectors Windows and OS X are designed to address into a physical location on the SSD's array of NAND memory. Firmware plays a major role in this process...
Nearly every SSD review you read involves testing at the physical level (second tier in diagram). This means you’re writing raw pages/blocks to the SSD, circumventing the file system entirely (first tier in diagram). Why are benchmarks run this way? Well, the idea is to try to isolate the performance of the storage subsystem, cutting out all other variables. The logic is sound.
When you introduce a file system into the picture, there’s no real way to separate the performance of the drive from the efficiency of the total system. However, we still think it's important to talk about formatted drive (logical) performance. Every file system has some sort of overhead, and it ultimately affects real-world use. Furthermore, the interaction between the firmware and the file system can have an impact, too.
Perhaps most importantly, nobody interacts with a drive at the physical level. And that’s why we're adding tests specific to NTFS (Windows 7) and HFS+ (Mac OS X), capturing real-world performance.
Get Tom's Hardware's best news and in-depth reviews, straight to your inbox.
Steady State: The Real Skinny
We've talked about steady-state performance in the past, sure. But we wanted to get more specific this time around. To be clear, there is no such thing as a static steady state. You might have one steady state for sequential reads and another one for sequential writes. Then there's the condition of the drive to consider. Are all of its blocks full? Or are there scattered bits of data across it?
At the end of the day, it's easiest to just assume that SSDs slow down once you start using them. Day 100 using a solid-state drive is generally slower than day one as a result of the storage activity going on in the background. But you can't reproduce that exact same steady state on another drive because it was defined by each of your actions during the 99 days prior.
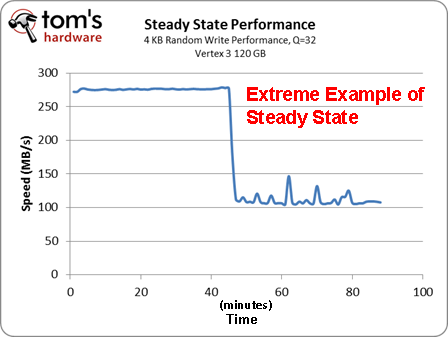
The aim of achieving a steady state translates to testing at a point where an SSD's performance no longer changes over time. In the enterprise, that necessitates constant writing to the drive in order to determine sustained performance. The chart above is an extreme example of that. In the consumer space, you aren't going to see the same dramatic performance drop. The underlying idea is the same, though. You want the drive's garbage collection active so you can evaluate how it'll behave once it's in your desktop machine, handing real-world workloads over the course of years.
Now, we already know that an SSD's firmware plays a big part in defining its overall performance picture. But you also want TRIM support and garbage collection working properly in order to keep the drive running at speeds as close to fresh-out-of-box as possible. That's ideal. The exact opposite is when you read and write to a dirty drive with all of its blocks previously written-to, similar to what we've done in past torture tests.
You're always going to see performance somewhere between those two extremes. Last year, our suite hadn't evolved to the point where we could show you both ends of the spectrum. Instead, we provided a single performance snapshot by defining our steady state as the condition of an SSD after running a specific trace. Now that we have both tests, though, we can show off fresh-out-of-box performance from Iometer without misrepresenting real-world performance. You can contrast those numbers with the results from our torture test, where we force an SSD into an undesirable condition.
Current page: Breaking Out New Benchmarks
Prev Page Test Setup And Benchmarks Next Page 4 KB Random Performance: Raw, Windows, And Mac-
phamhlam I love Intel SSD. 128GB for about $210 isn't bad. It is just hard to not chose something like a Corsair GT 120GB that cost $150 with rebate over this. I would always put a Intel SSD in a computer for novice since it is reliable.Reply -
jaquith Nice article :)Reply
Just need more SSD's to compare, I'd like to see similar tests done with 120GB...180GB...256GB and several more brands. Further, as I mentioned before in the other article please list the exact model numbers and OEM specs including their 4KB IOPS; otherwise folks don't understand the results and if relying on this a purchasing will have in many cases a 4 in 5 chance of selecting the wrong SSD.
Prior article - http://www.tomshardware.com/reviews/sata-6gbps-performance-sata-3gbps,3110.html -
theuniquegamer costly but i think reliability comes at a price. These ssds are best for enterprises . If the price will be little lower then the common user can afford these and get a good reliable ssd.Reply -
bildo123 "Measuring boot time is one of the best illustrations of how an SSD benefits your computing experience." Be that as it may I find it almost irrelevant seeing as I hardly ever boot my computer, perhaps 2-3 times a month if that. Getting out of standby on my HDD is a matter of seconds.Reply -
danraies These prices are lower than I thought. $20-$40 extra (depending on the comparison) for peace-of-mind is not outrageous.Reply -
acku carn1xHmmm, maybe I missed a good excuse, but I'd like to see the Octane in these tests.Reply
We didn't have the Octane on hand in the 256 GB capacity, but we'll be sure to make that side by side comparison down the road.
phamhlamI love Intel SSD. 128GB for about $210 isn't bad. It is just hard to not chose something like a Corsair GT 120GB that cost $150 with rebate over this. I would always put a Intel SSD in a computer for novice since it is reliable.
Excellent point. Price is always a fickle thing.
thessdreviewNice Review!Thanks Les. :)
jaquithNice article Just need more SSD's to compare, I'd like to see similar tests done with 120GB...180GB...256GB and several more brands. Further, as I mentioned before in the other article please list the exact model numbers and OEM specs including their 4KB IOPS; otherwise folks don't understand the results and if relying on this a purchasing will have in many cases a 4 in 5 chance of selecting the wrong SSD. Prior article - http://www.tomshardware.com/review ,3110.html
We'll keep that mind for future reviews. However, we already list model and firmware on the test page.
Cheers,
Andrew Ku
TomsHardware.com
-
willard bildo123Getting out of standby on my HDD is a matter of seconds.And with an SSD, your computer comes out of standby faster than your monitors do. Not kidding.Reply -
mrkdilkington Anyone else disappointed Intel isn't producing their own high end chipset? Been waiting to upgrade my X25-M for a while now (Intel 320 isn't a big upgrade) but might just go with Samsung.Reply


