SSD Performance In Crysis 2, World Of Warcraft, And Civilization V
Understanding Storage Performance
No matter what storage technology you're looking at, the benchmarks that size them up are usually framed by words like IOPS, MB/s, queue depths, transfer sizes, and seek distance.
IOPS and Throughput
The term IOPS stands for input/output operations per second, and it’s a common measurement unit used to evaluate computer storage devices. While the acronym sounds fancy, it isn’t. An input operation is just a way of identifying an individual write access (output is read).
If a benchmark isn’t presenting results in IOPS, the other likely candidate is MB/s (throughput). These two units have a direct relationship, as average transfer size * IOPS = MB/s.
However, most workloads are a mixture of different transfer sizes, which is why the storage ninjas in IT prefer IOPS. It reflects the number of operations that occur per second, regardless of size and seek distance. If a benchmark only tests a single transfer size, you can use the formula to easily convert between the two units.
Queue Depth
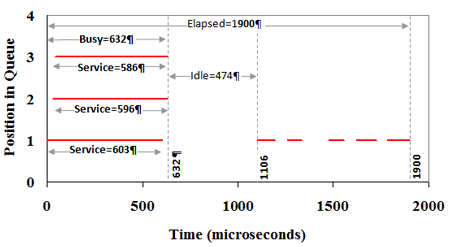
Queue depth refers to the number of outstanding access operations. In the picture above, each solid line represents one disk operation, which can be either a read or write. Because three operations overlap in the same period, there’s a queue depth of three.
Get Tom's Hardware's best news and in-depth reviews, straight to your inbox.
This affects how storage benchmarks are presented. When we benchmark SATA-based disk drives, we use AHCI mode to enable Native Command Queuing support, which lets the drive optimize the order in which outstanding commands are addressed. Of course, when it comes to spinning media, there's a limit to the benefit of a feature like that. Consequently, most hard drives (especially on the desktop) are tested at lower queue depths.
SSDs are different, though. They're built using multiple NAND flash channels attached to a controller, and maximizing the utilization of each channel requires high queue depths. Otherwise, performance isn't nearly as impressive as it's often presented by SSD manufacturers. As such, review sites have gotten into a bad habit of following suit, which is why you see solid-state drives benchmarked with queue depths of 32 (despite the fact that you'd likely never see a queue depth that high).
If you want the most realistic representation of an SSD versus a hard drive, you have to test in a way that reflects real-world use.
Transfer Sizes
At the physical level, each NAND die consists of a number of blocks, which, in turn, consist of a certain number of pages. Pages are the basic units used for read and write operations. But they can't be erased individually. In order to erase the data on a page, the information in its entire block must be erased. Any valid data that still exists on neighboring pages must then be rewritten.
Architecturally, that's very much different from a hard drive, which know exactly where blocks of data are located by means of logical block addressing. Operating systems expect that integer-based system. Understandably, SSDs require a workaround just to live in a world where magnetic storage came first.
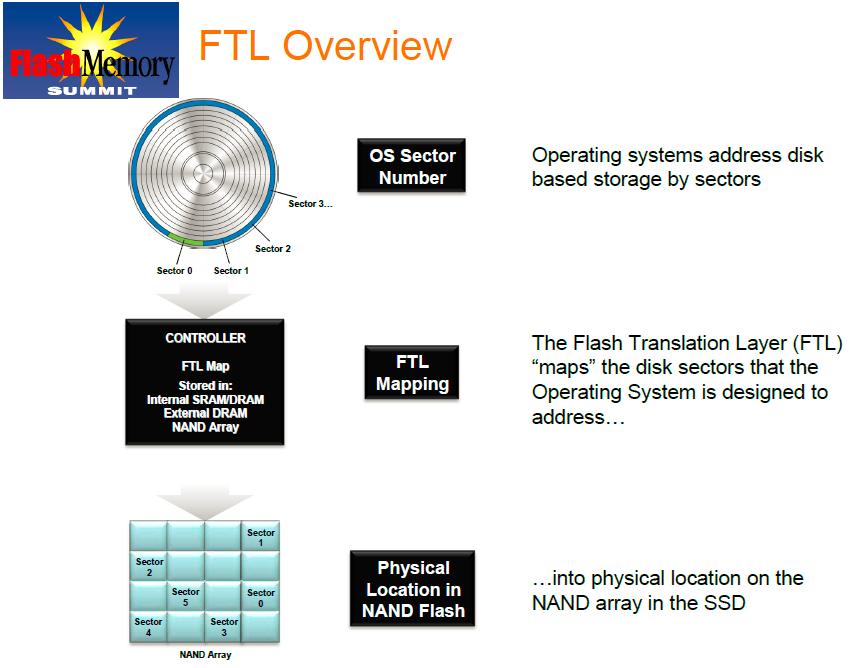
Solid-state drive employ what's called a flash translation layer to map the sectors Windows or OS X are designed to address into a physical location on the SSD's array of NAND memory. Firmware plays a major role in this process, and it's consequently shrouded in secrecy. Intel, Marvell, and SandForce all use page-level mapping in their respective controllers, but remain quiet on the specifics. Naturally, there are multiple ways to implement this functionality, and that's one reason you see differences in SSD performance.
Seek Distance
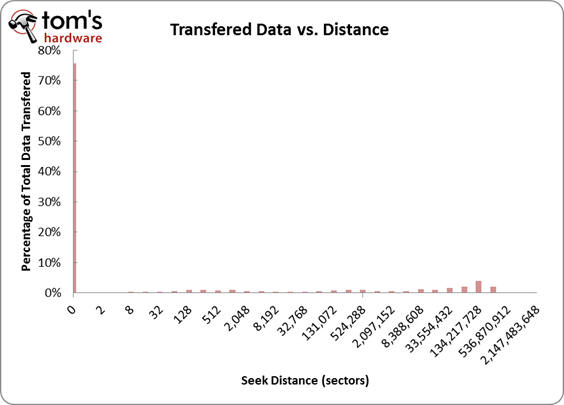
Seek distance determines if your disk access is sequential or random. In a conventional hard drive, random accesses occur when the hard drive accesses non-adjacent sectors. They're referred to as random because the data is scattered across multiple sectors. And when you're talking about a spinning disk, it's obviously going to be more difficult to fetch information distributed across the medium than in a sequential track. The time it takes a hard drive's read/write head to move to where it needs to go is known as seek time, which is really what limits random performance. The greater the distance between requested sectors, the longer the seek time. Typically, you can expect to see less than 5 MB/s of random throughput on a hard drive moving 4 KB blocks with a queue depth of one.
Of course, if data is written across adjacent sectors, giving you zero seek distance, the head doesn’t have to move at all. That results in a sequential transfer representative of the way movies and large images gets stored. The difference between random and sequential transfers is significant enough that we often see hard drives able to push sequential transfers in excess of 150 MB/s. That's why playing a high-bitrate movie from a hard drive doesn't leave you with a stuttering mess. That same film, stored randomly across the disk, wouldn't be nearly as enjoyable to watch.
SSD specifications don't list a seek time because they don't have physical read/write heads that move around, incurring latency. As with hard drives, sequential data on an SSD is stored adjacently (in pages, rather than sectors). But random data is handled slightly differently by each SSD architecture. This is where the firmware plays another role in affecting performance. Over time, even through you're writing data randomly to different sectors at the operating system level, an SSD's FTL can reorganize data in the drive's NAND, turning what might have been a random access into a sequential one.
Current page: Understanding Storage Performance
Prev Page Test Setup Next Page Is A Trace-Based Analysis Accurate?

