Why you can trust Tom's Hardware
Protection Features
Check out our PSUs 101 article to learn more about PSU protection features.
|
OCP (Cold @ 26°C) |
12V: 93A (131.17%), 11.945V, >200mV ripple |
|
OCP (Hot @ 43°C) |
12V: 93.4A (131.73%), 11.955V |
|
OPP (Cold @ 29°C) |
1124.11W (132.25%) |
|
OPP (Hot @ 44°C) |
1129.88W (132.93%) |
|
OTP |
✓ (148°C @ secondary side) |
|
SCP |
12V to Earth: ✓ |
|
PWR_OK |
Proper operation |
|
NLO |
✓ |
|
SIP | Surge: MOV Inrush: - |
OCP at 12V needs to be set at a lower level since it allows for a very high ripple on this rail, a clear sign that the platform is pushed beyond its capabilities. OCP is set high on the minor rails, too, but we didn't encounter load regulation or ripple problems. Nonetheless, there is no need for such high power levels at 5V and 3.3V.
Despite the lack of an NTC thermistor and relay combo, the PSU seems to have another way of lowering inrush currents, which proved quite effective.
DC Power Sequencing
According to Intel’s most recent Power Supply Design Guide (revision 1.4), the +12V and 5V outputs must be equal to or greater than the 3.3V rail at all times. Unfortunately, Intel doesn't mention why it is so important to always keep the 3.3V rail's voltage lower than the levels of the other two outputs.
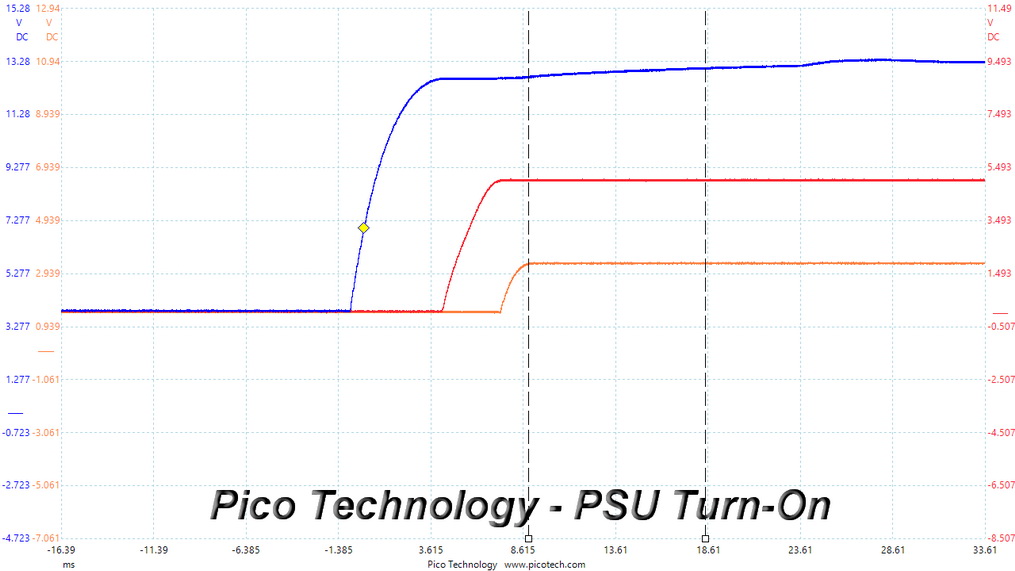
DC Power Sequencing Scope Shots
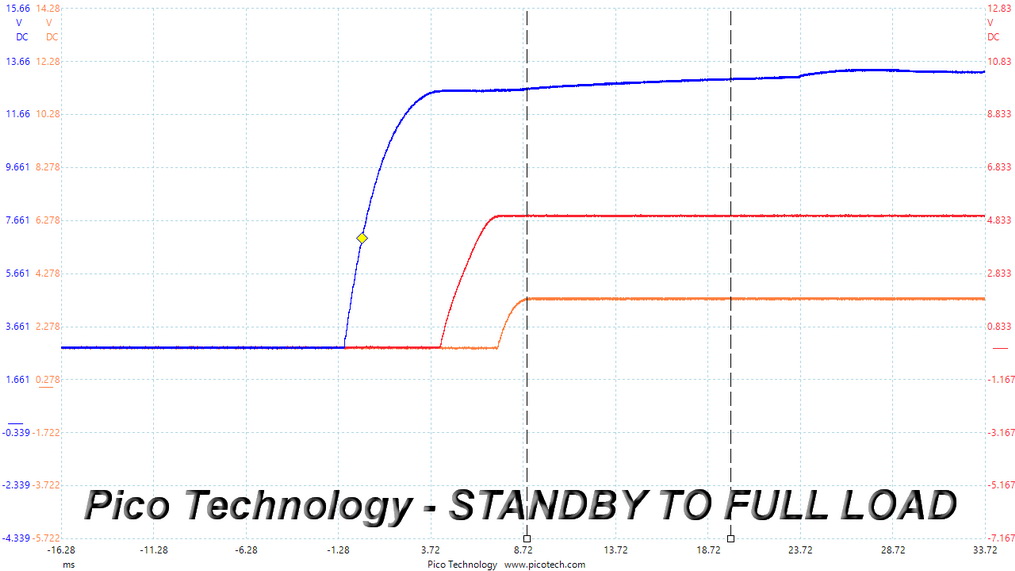
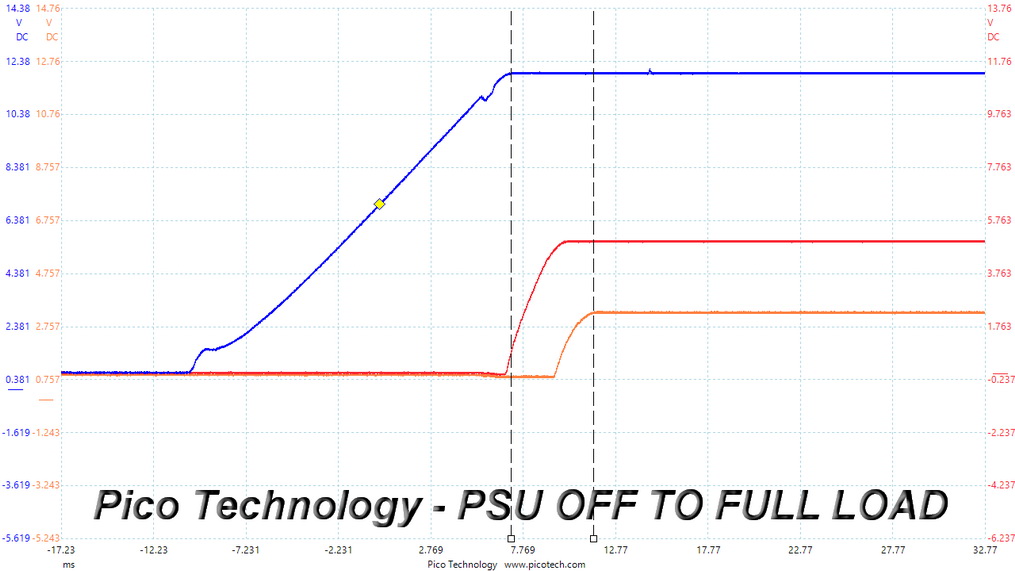
No problems here since the 3.3V rail is always lower than the other two.
Cross Load Tests
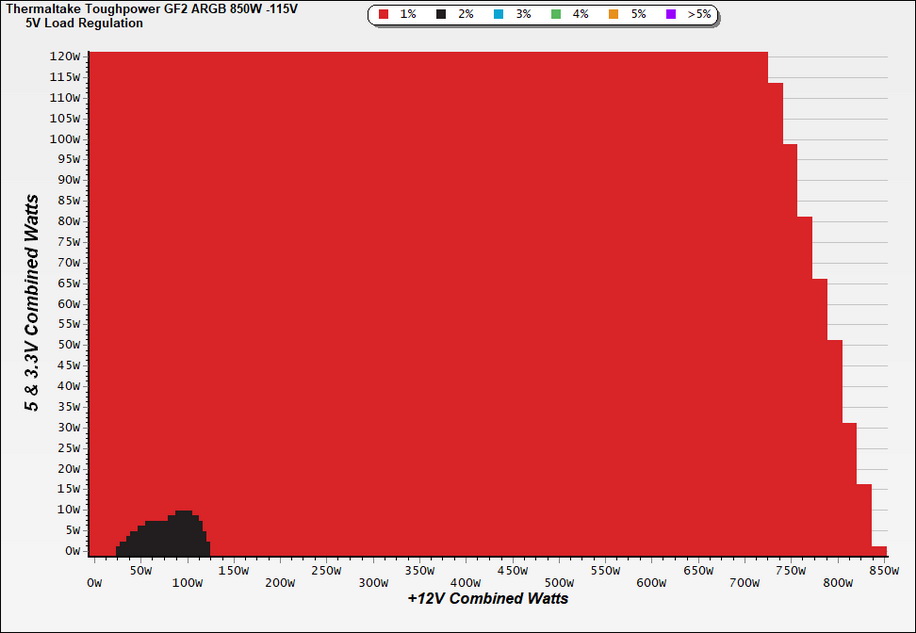
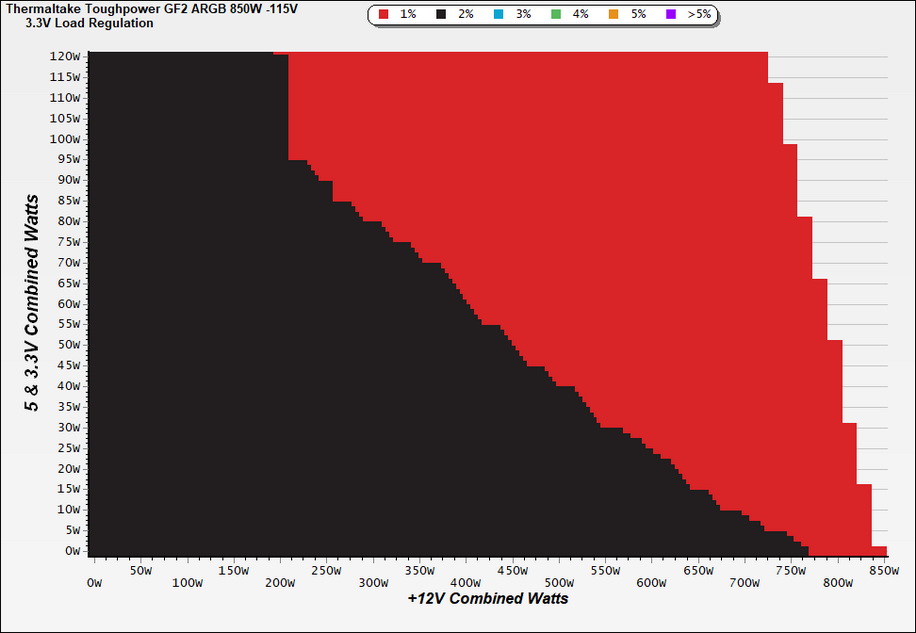
To generate the following charts, we set our loaders to auto mode through custom-made software before trying more than 25,000 possible load combinations with the +12V, 5V, and 3.3V rails. The deviations in each of the charts below are calculated by taking the nominal values of the rails (12V, 5V, and 3.3V) as point zero. The ambient temperature during testing was between 30 to 32 degrees Celsius (86 to 89.6 degrees Fahrenheit).
Load Regulation Charts
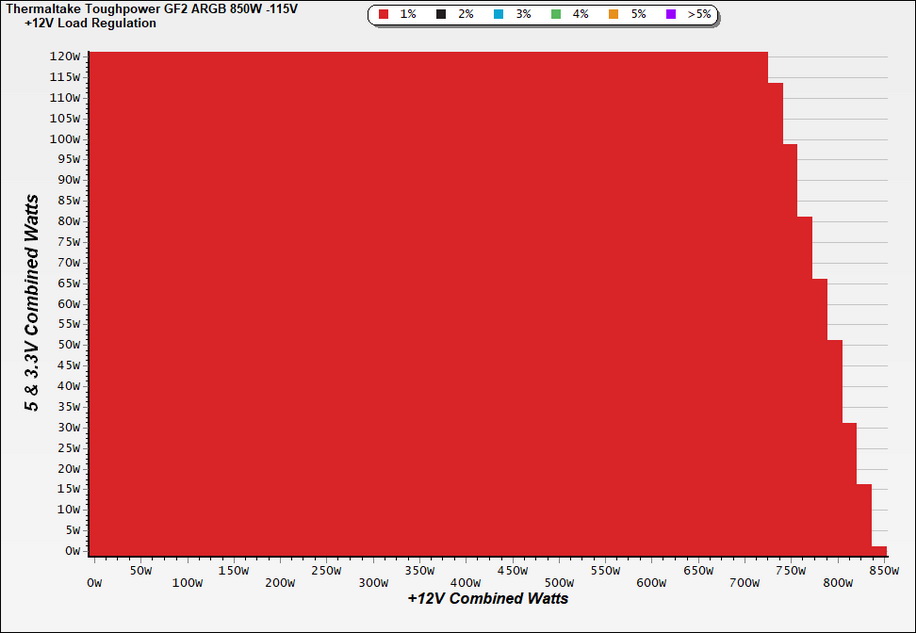
Load Regulation Graphs
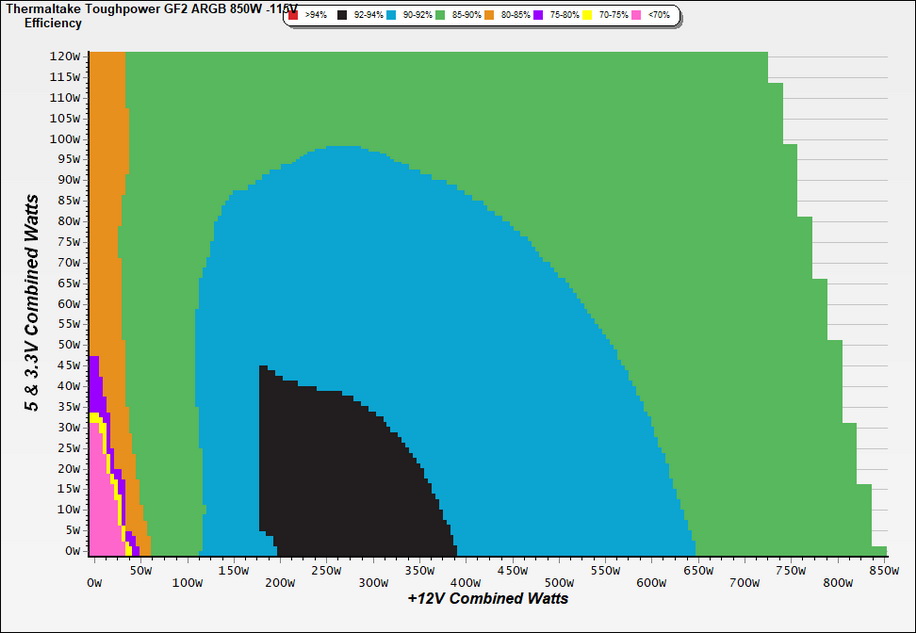
Efficiency Graph
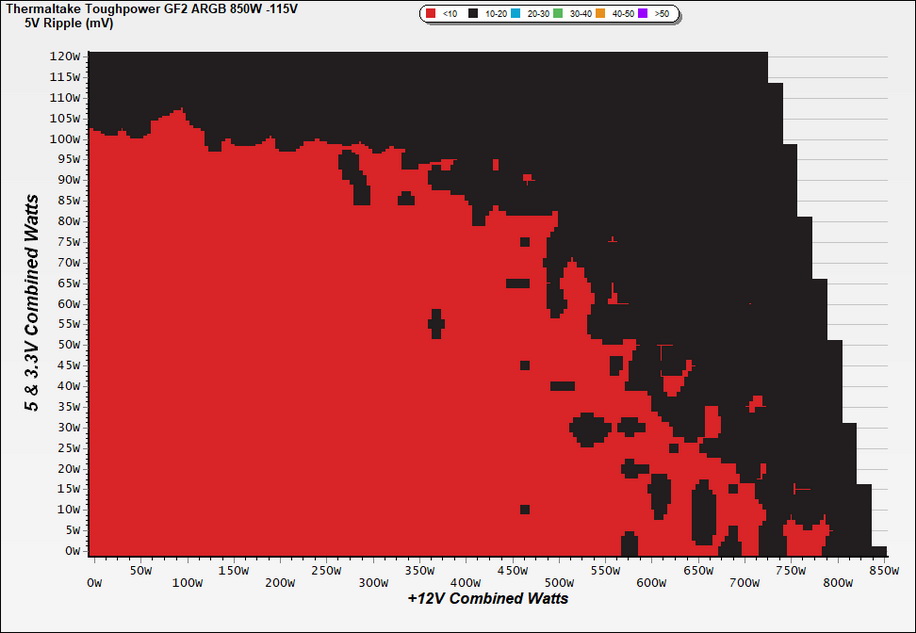
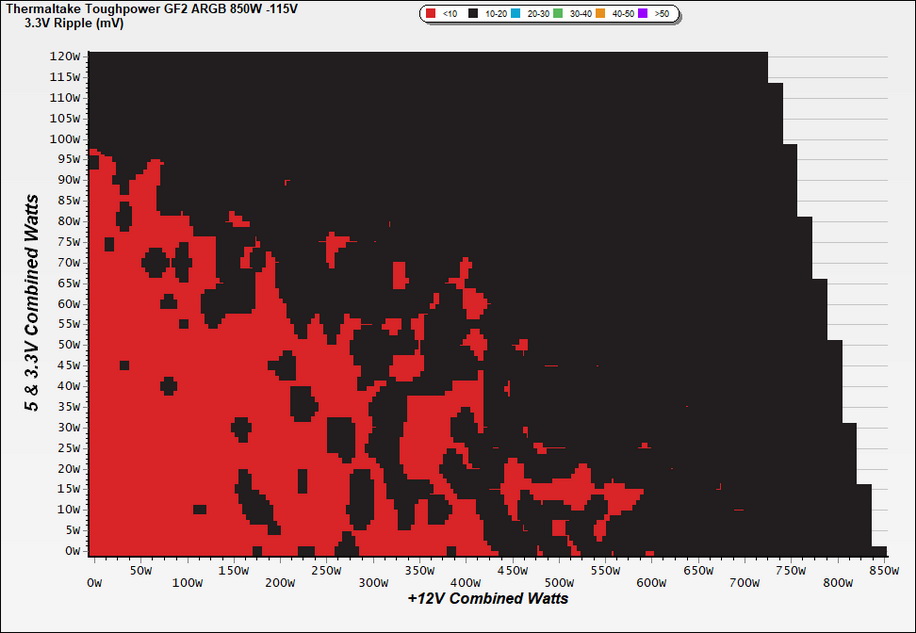
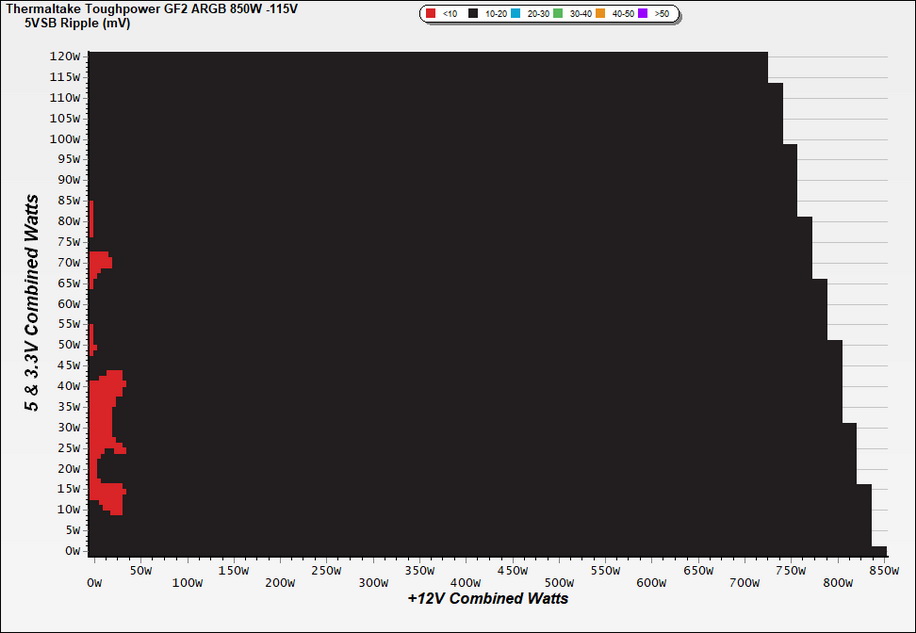
Ripple Graphs
The lower the power supply's ripple, the more stable the system will be and less stress will also be applied to its components.
Get Tom's Hardware's best news and in-depth reviews, straight to your inbox.
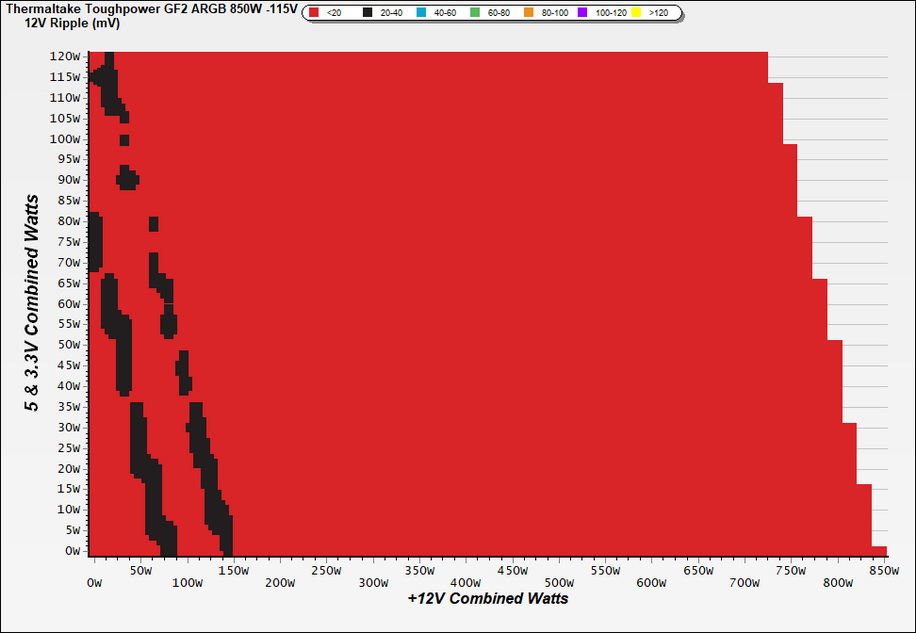
Ripple Suppression Graphs
Infrared Images
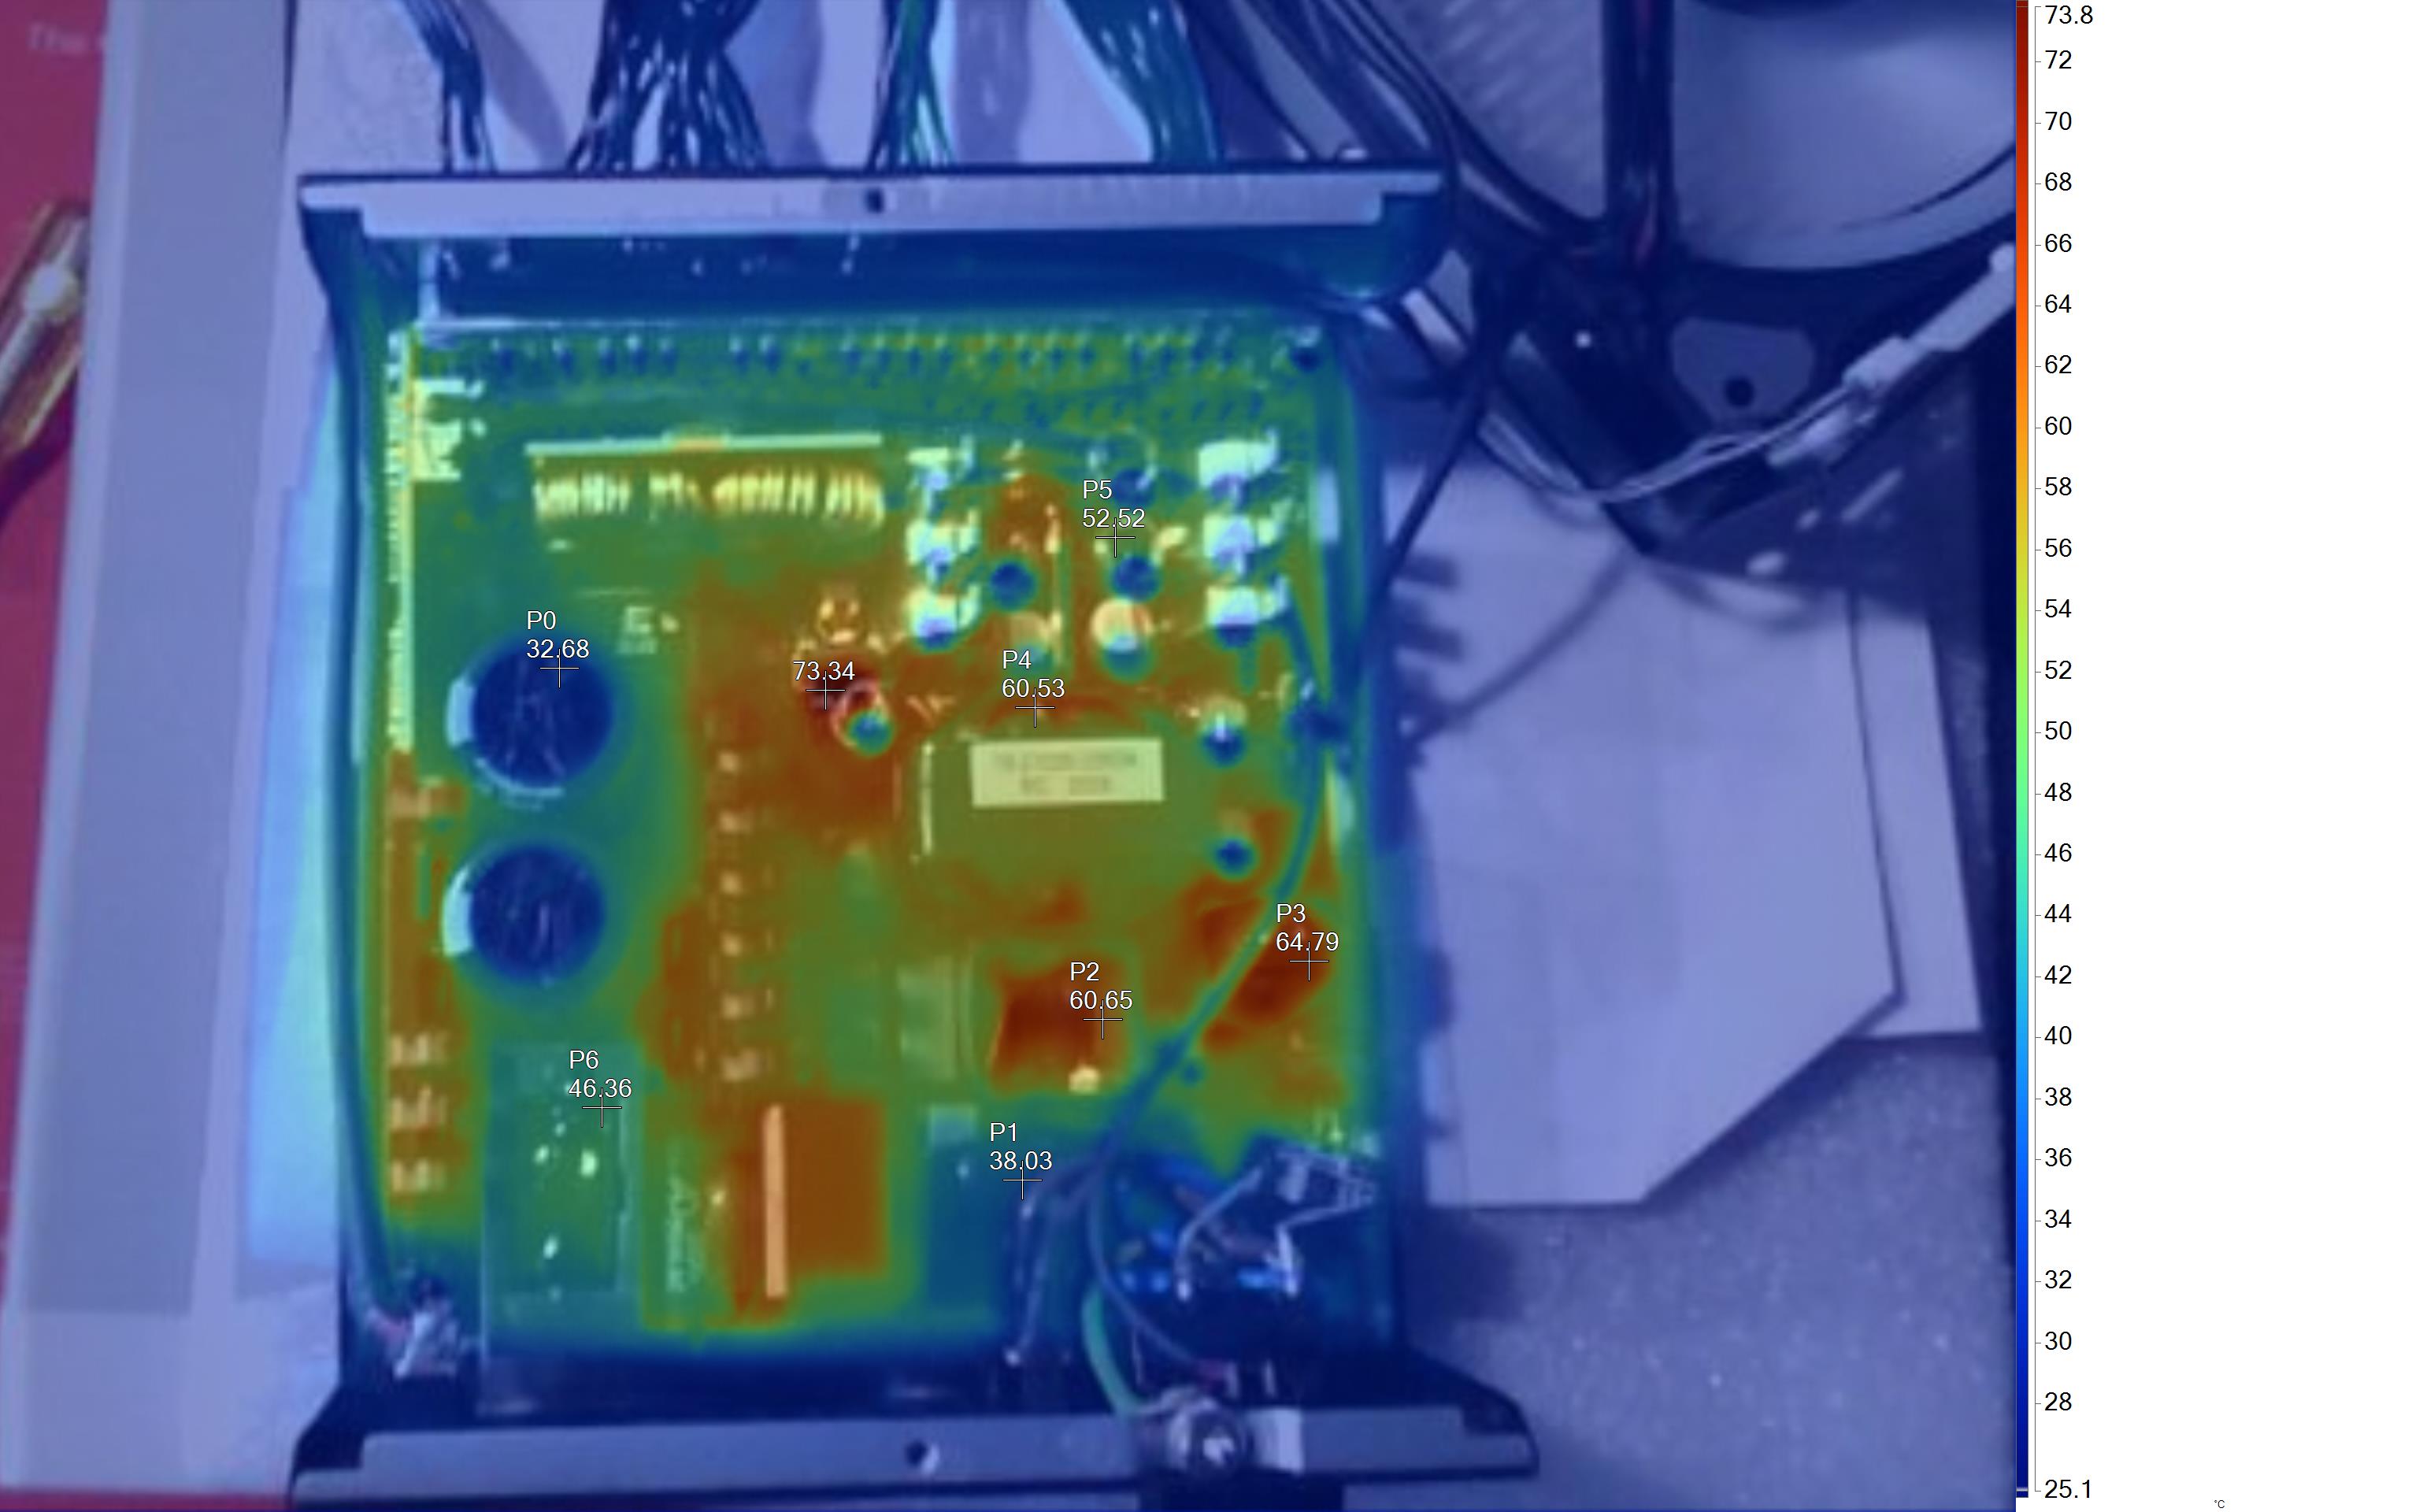
We apply a half-load for 10 minutes with the PSU's top cover and cooling fan removed before taking photos with a modified FLIR E4 camera able to deliver an IR resolution of 320x240 (76,800 pixels).
IR Images
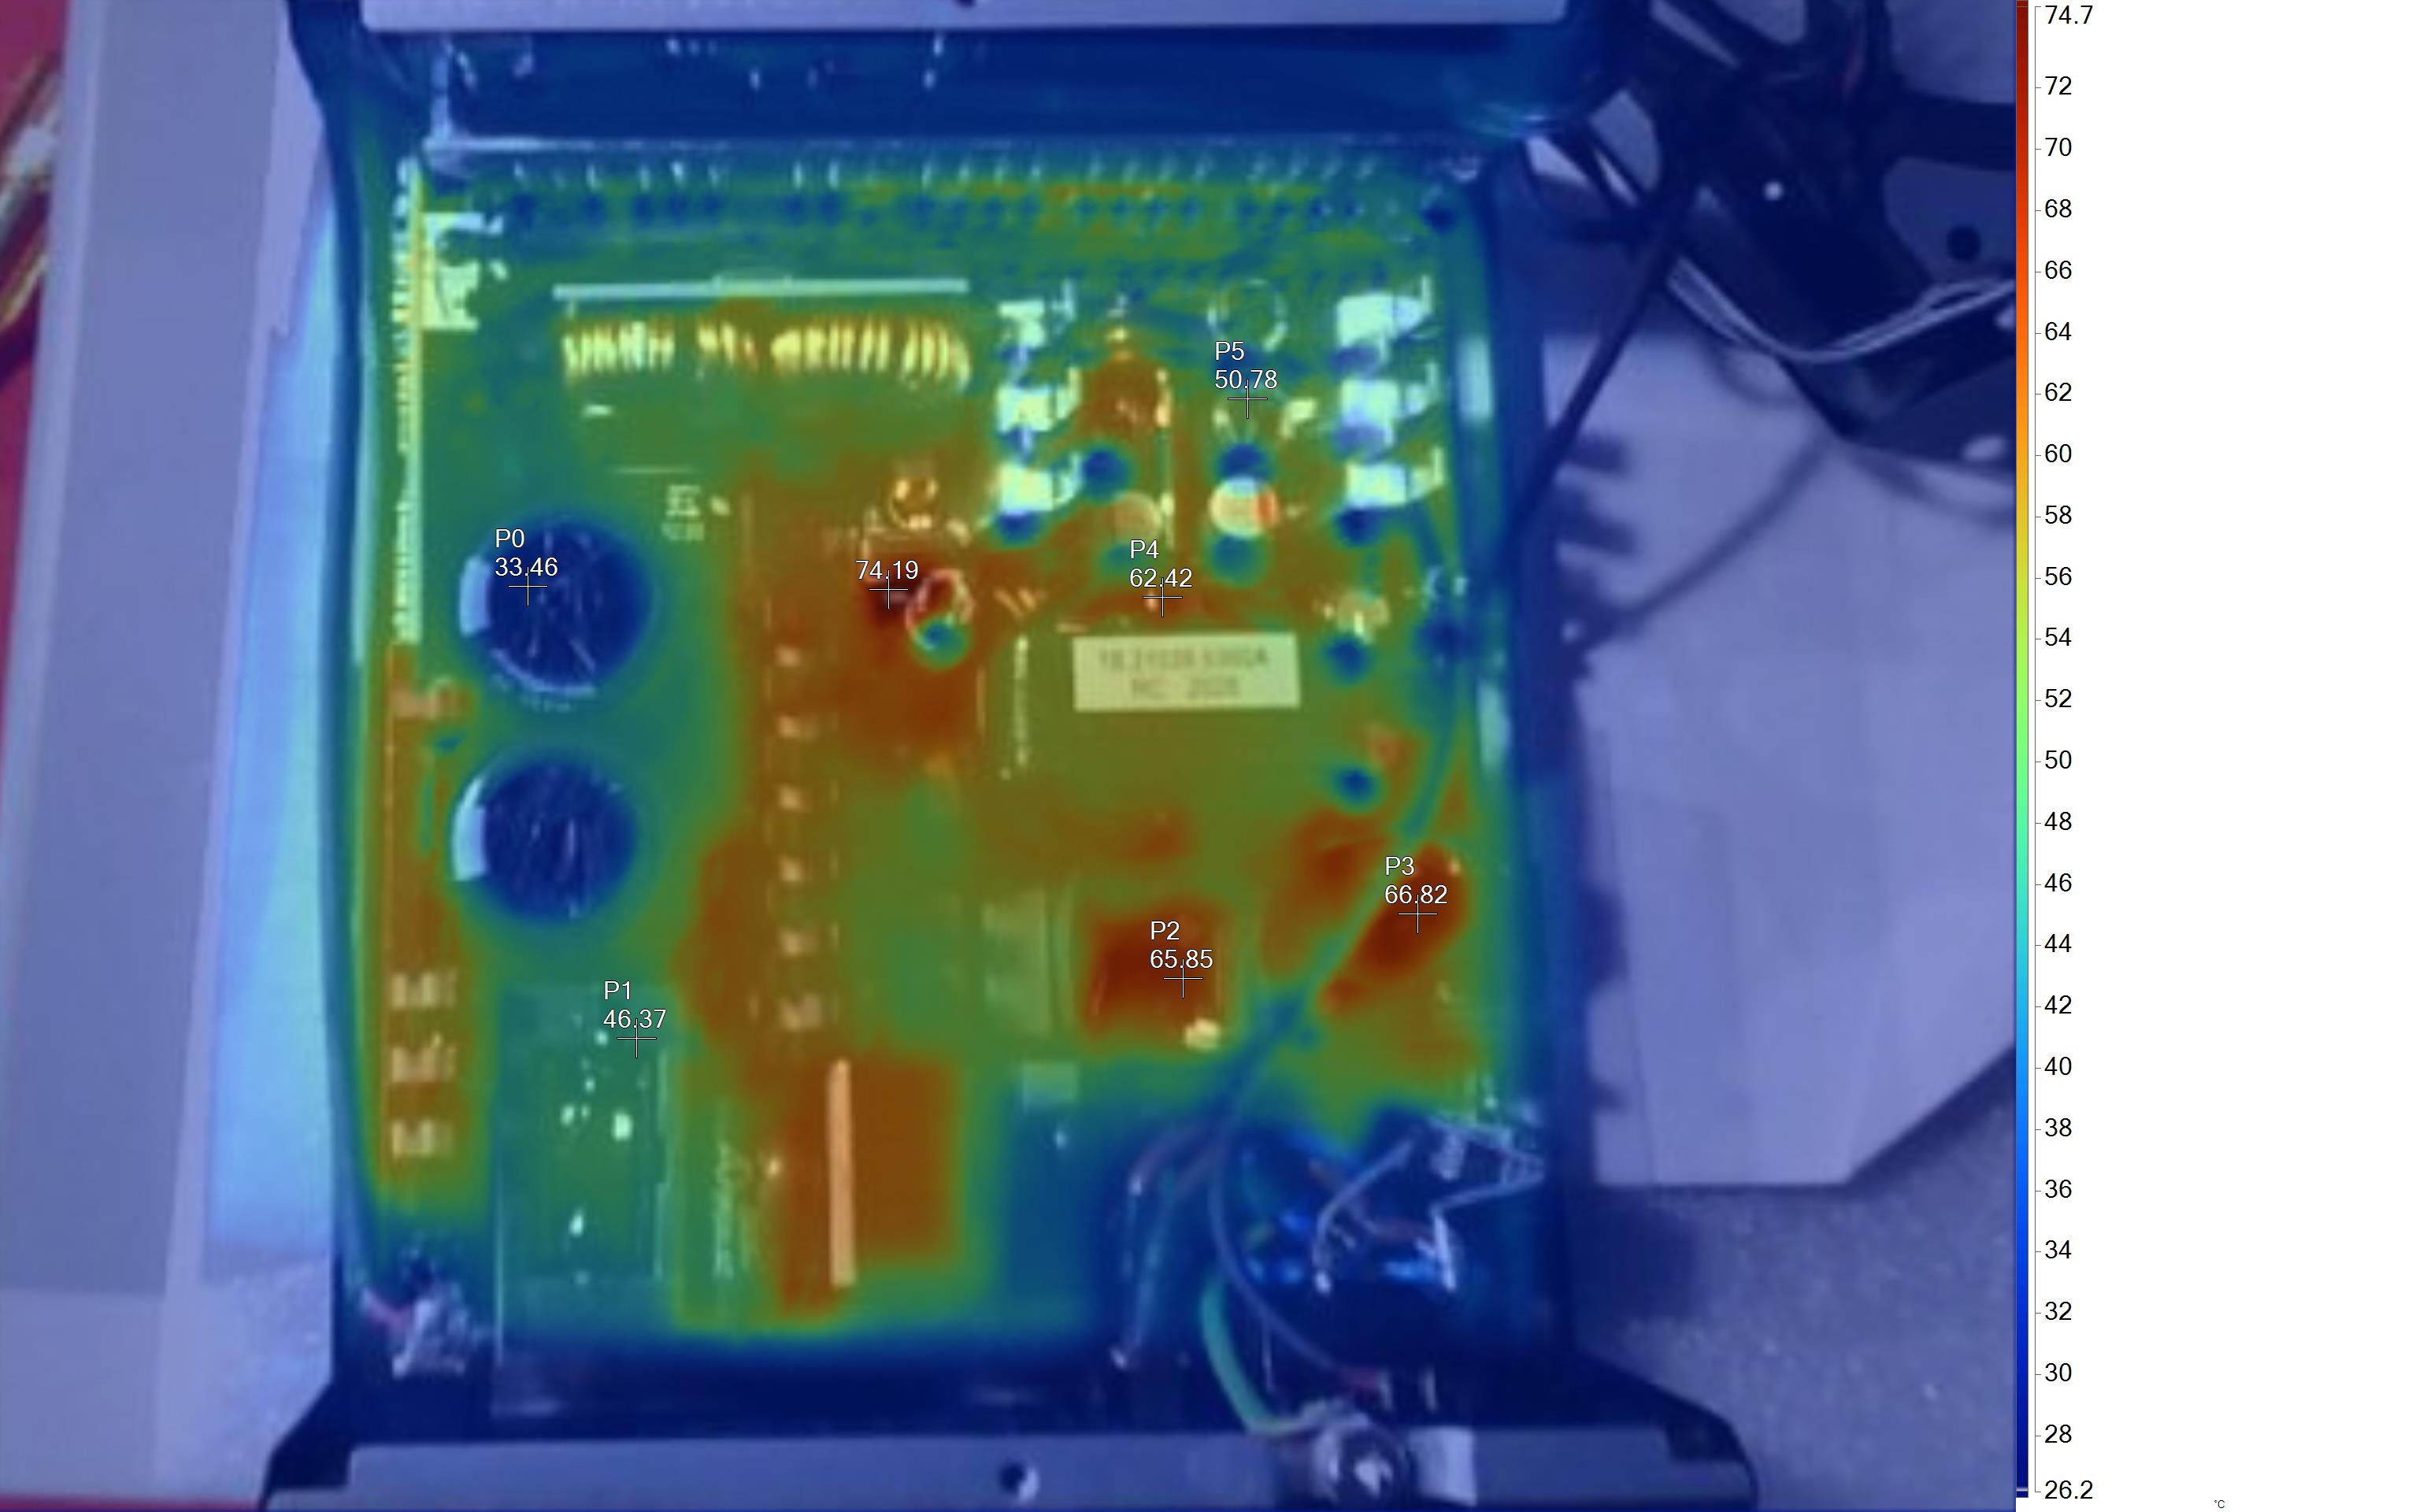
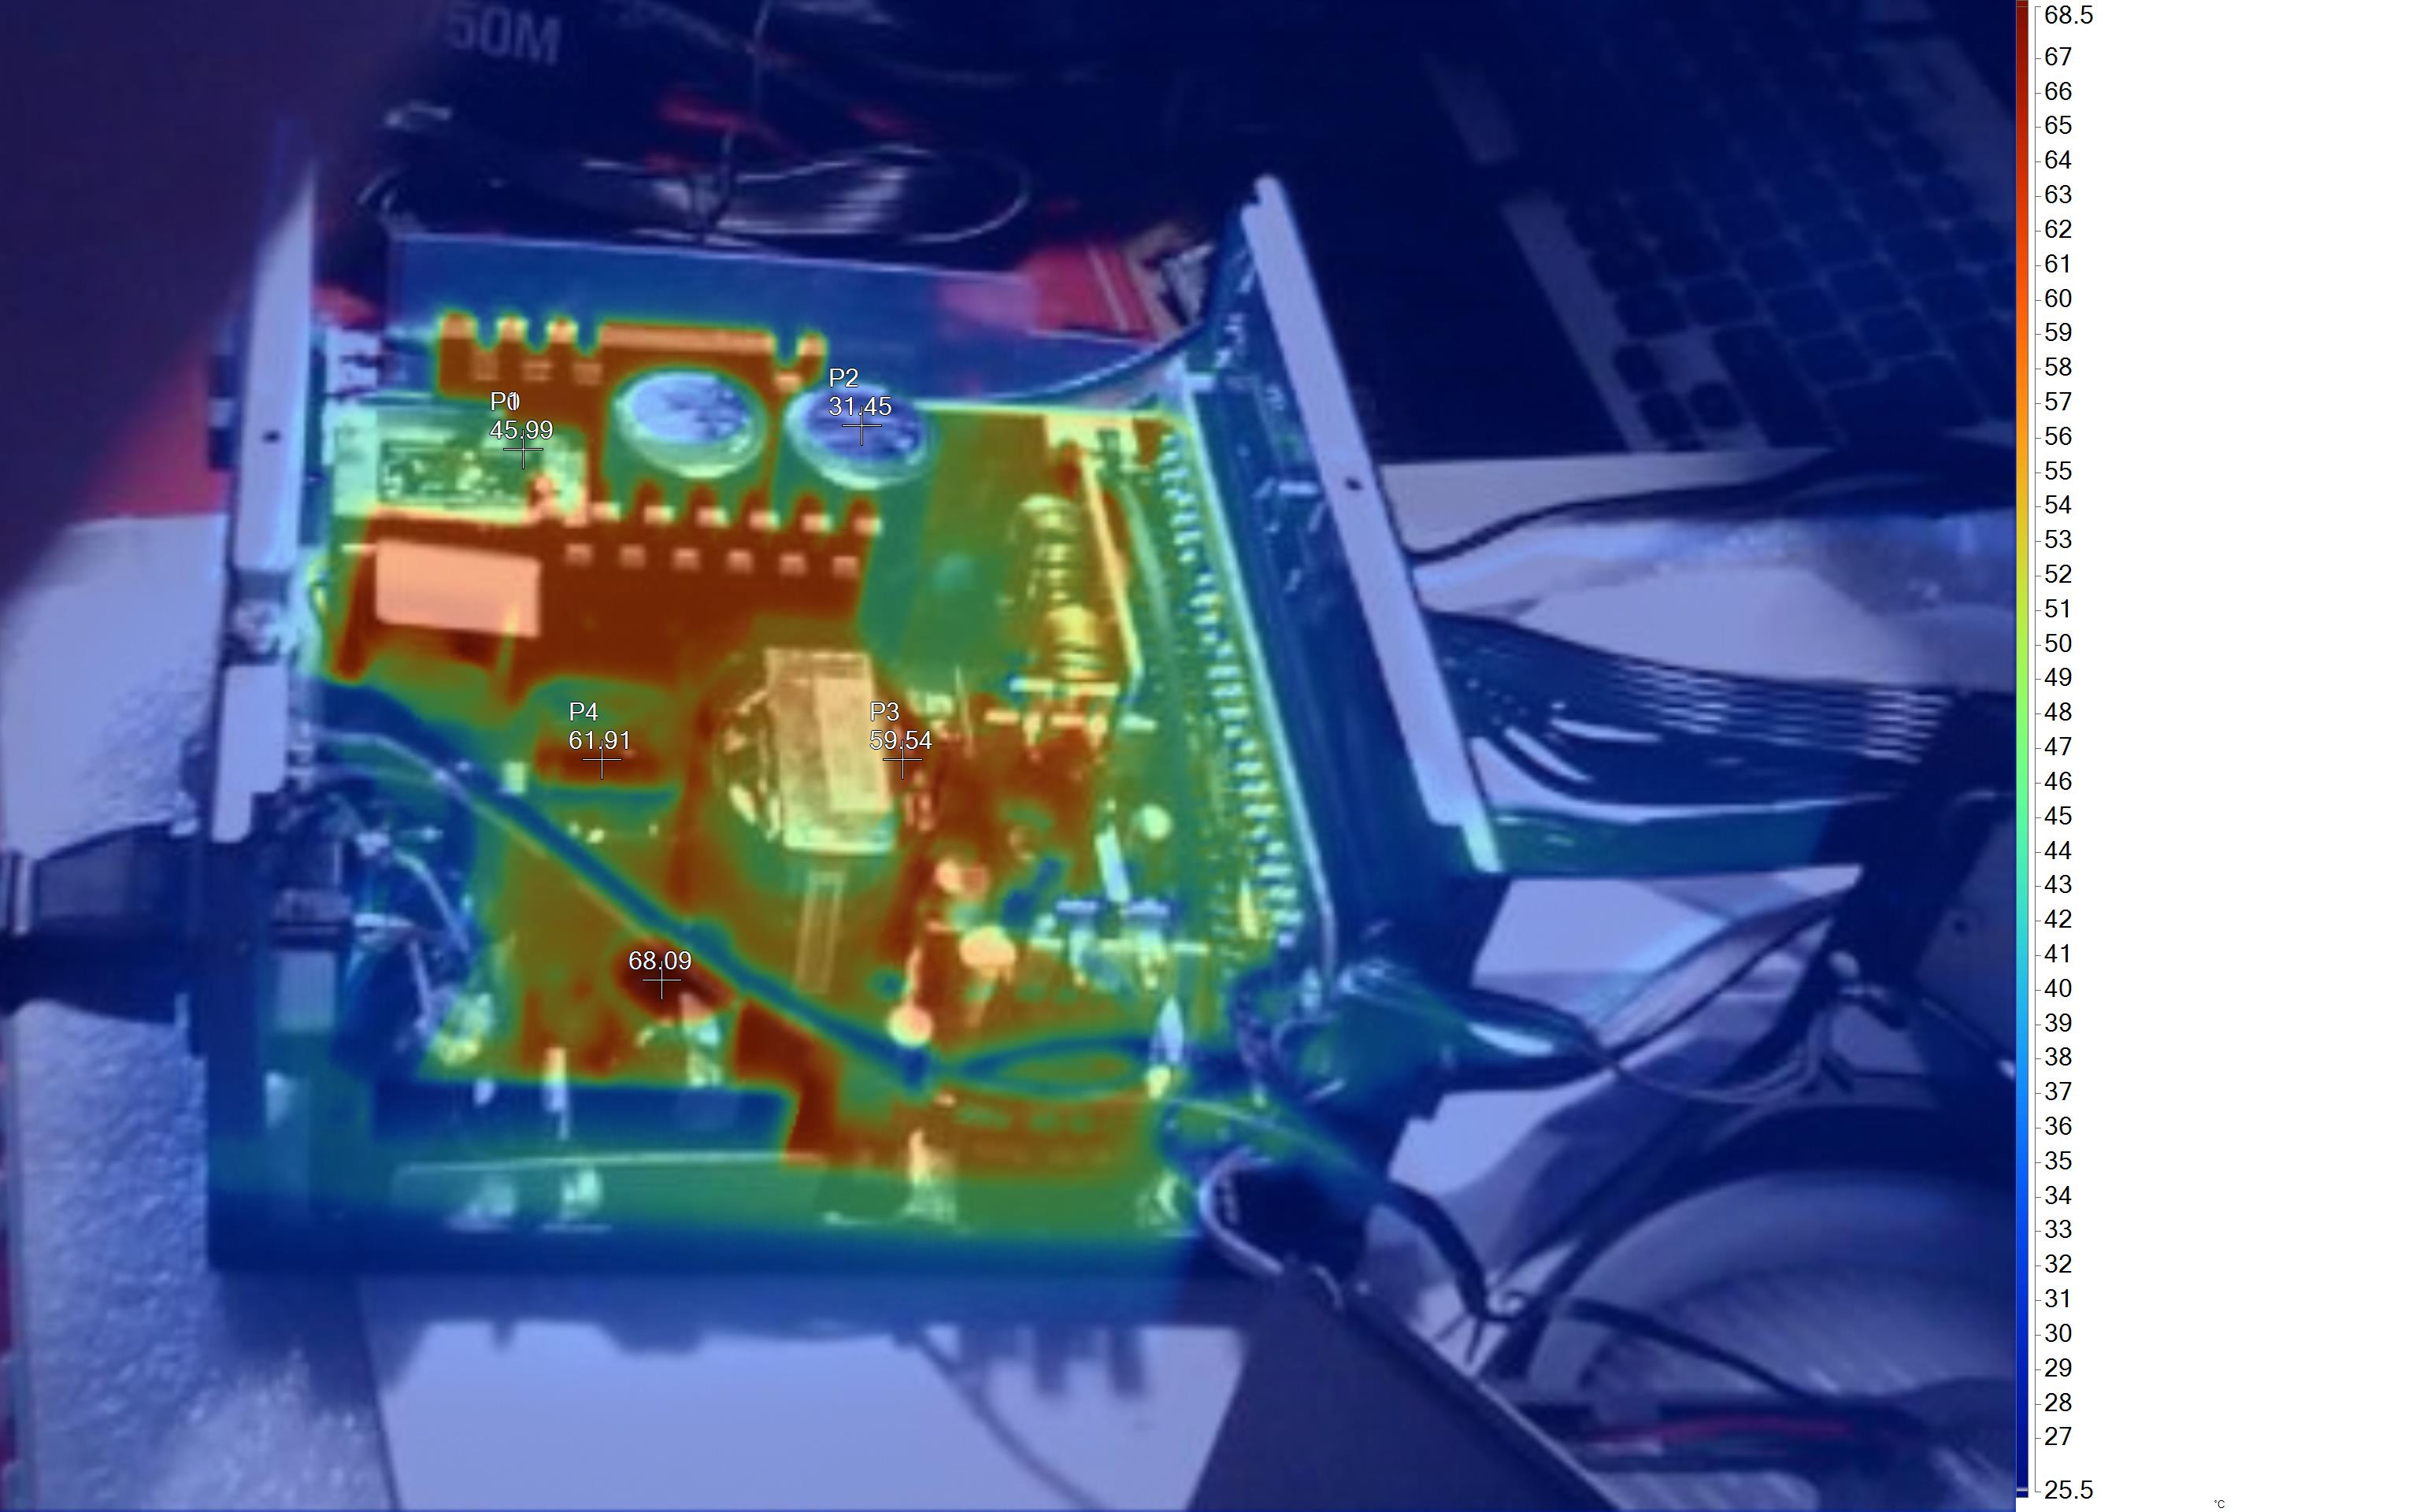
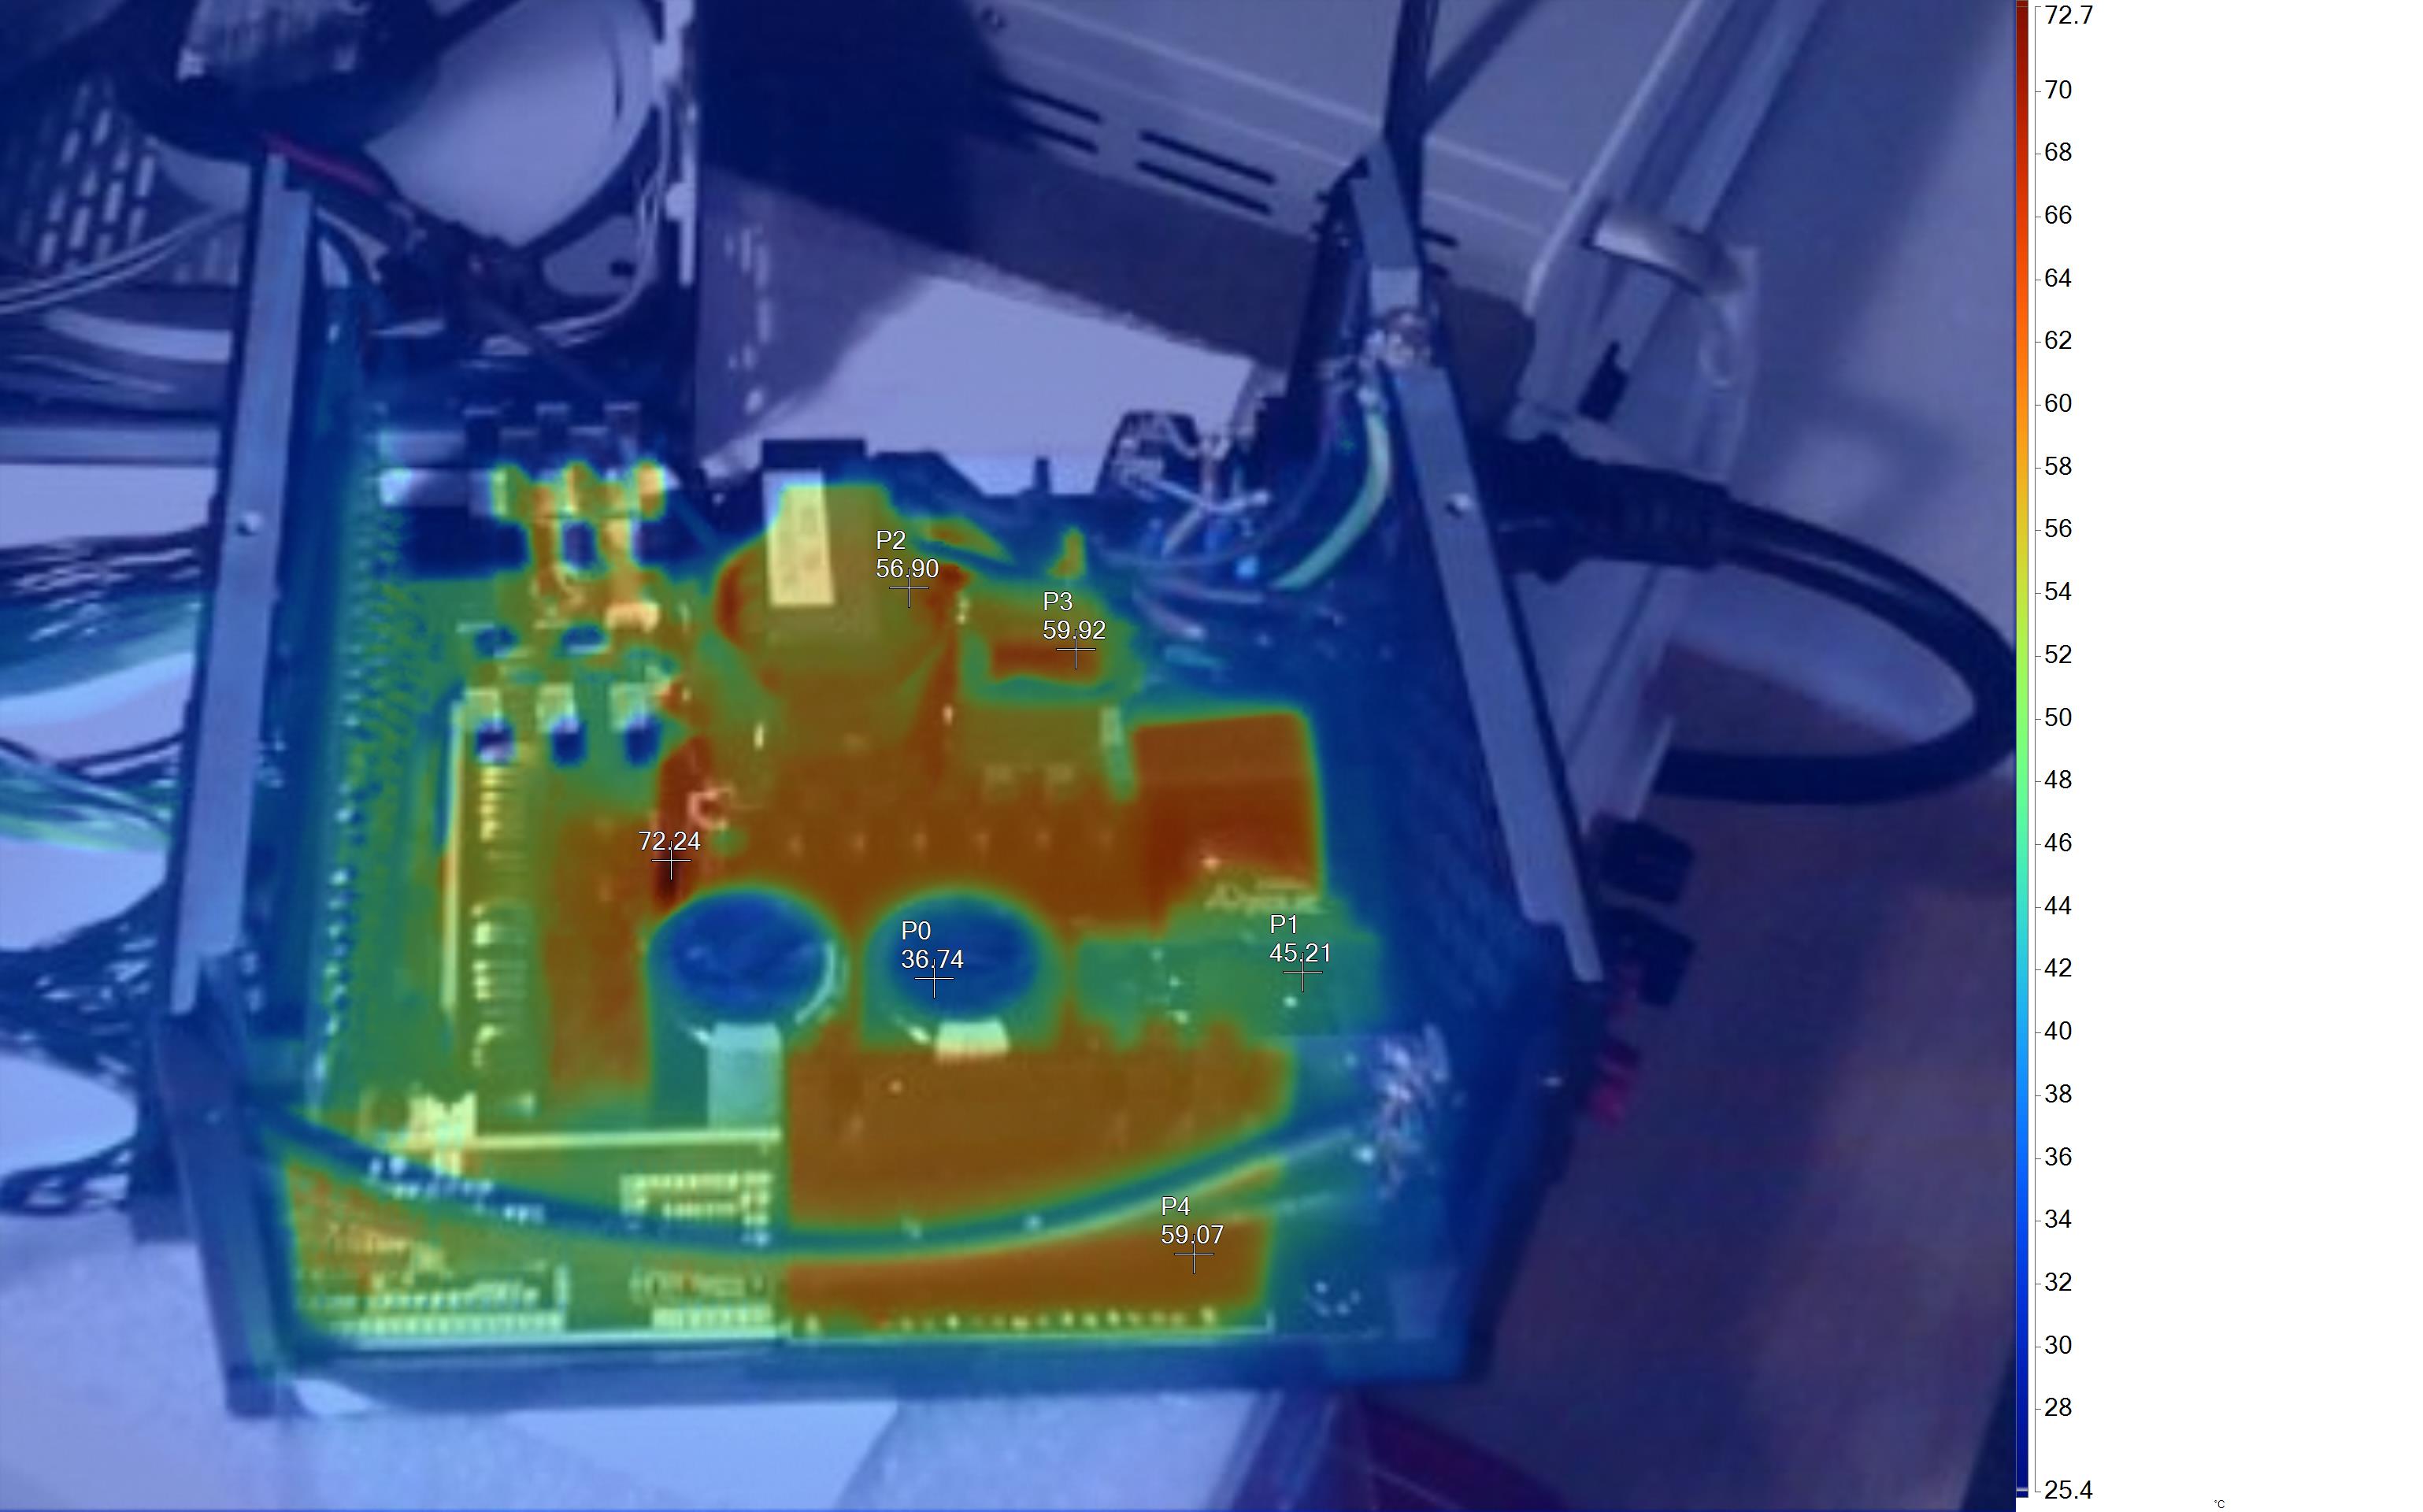
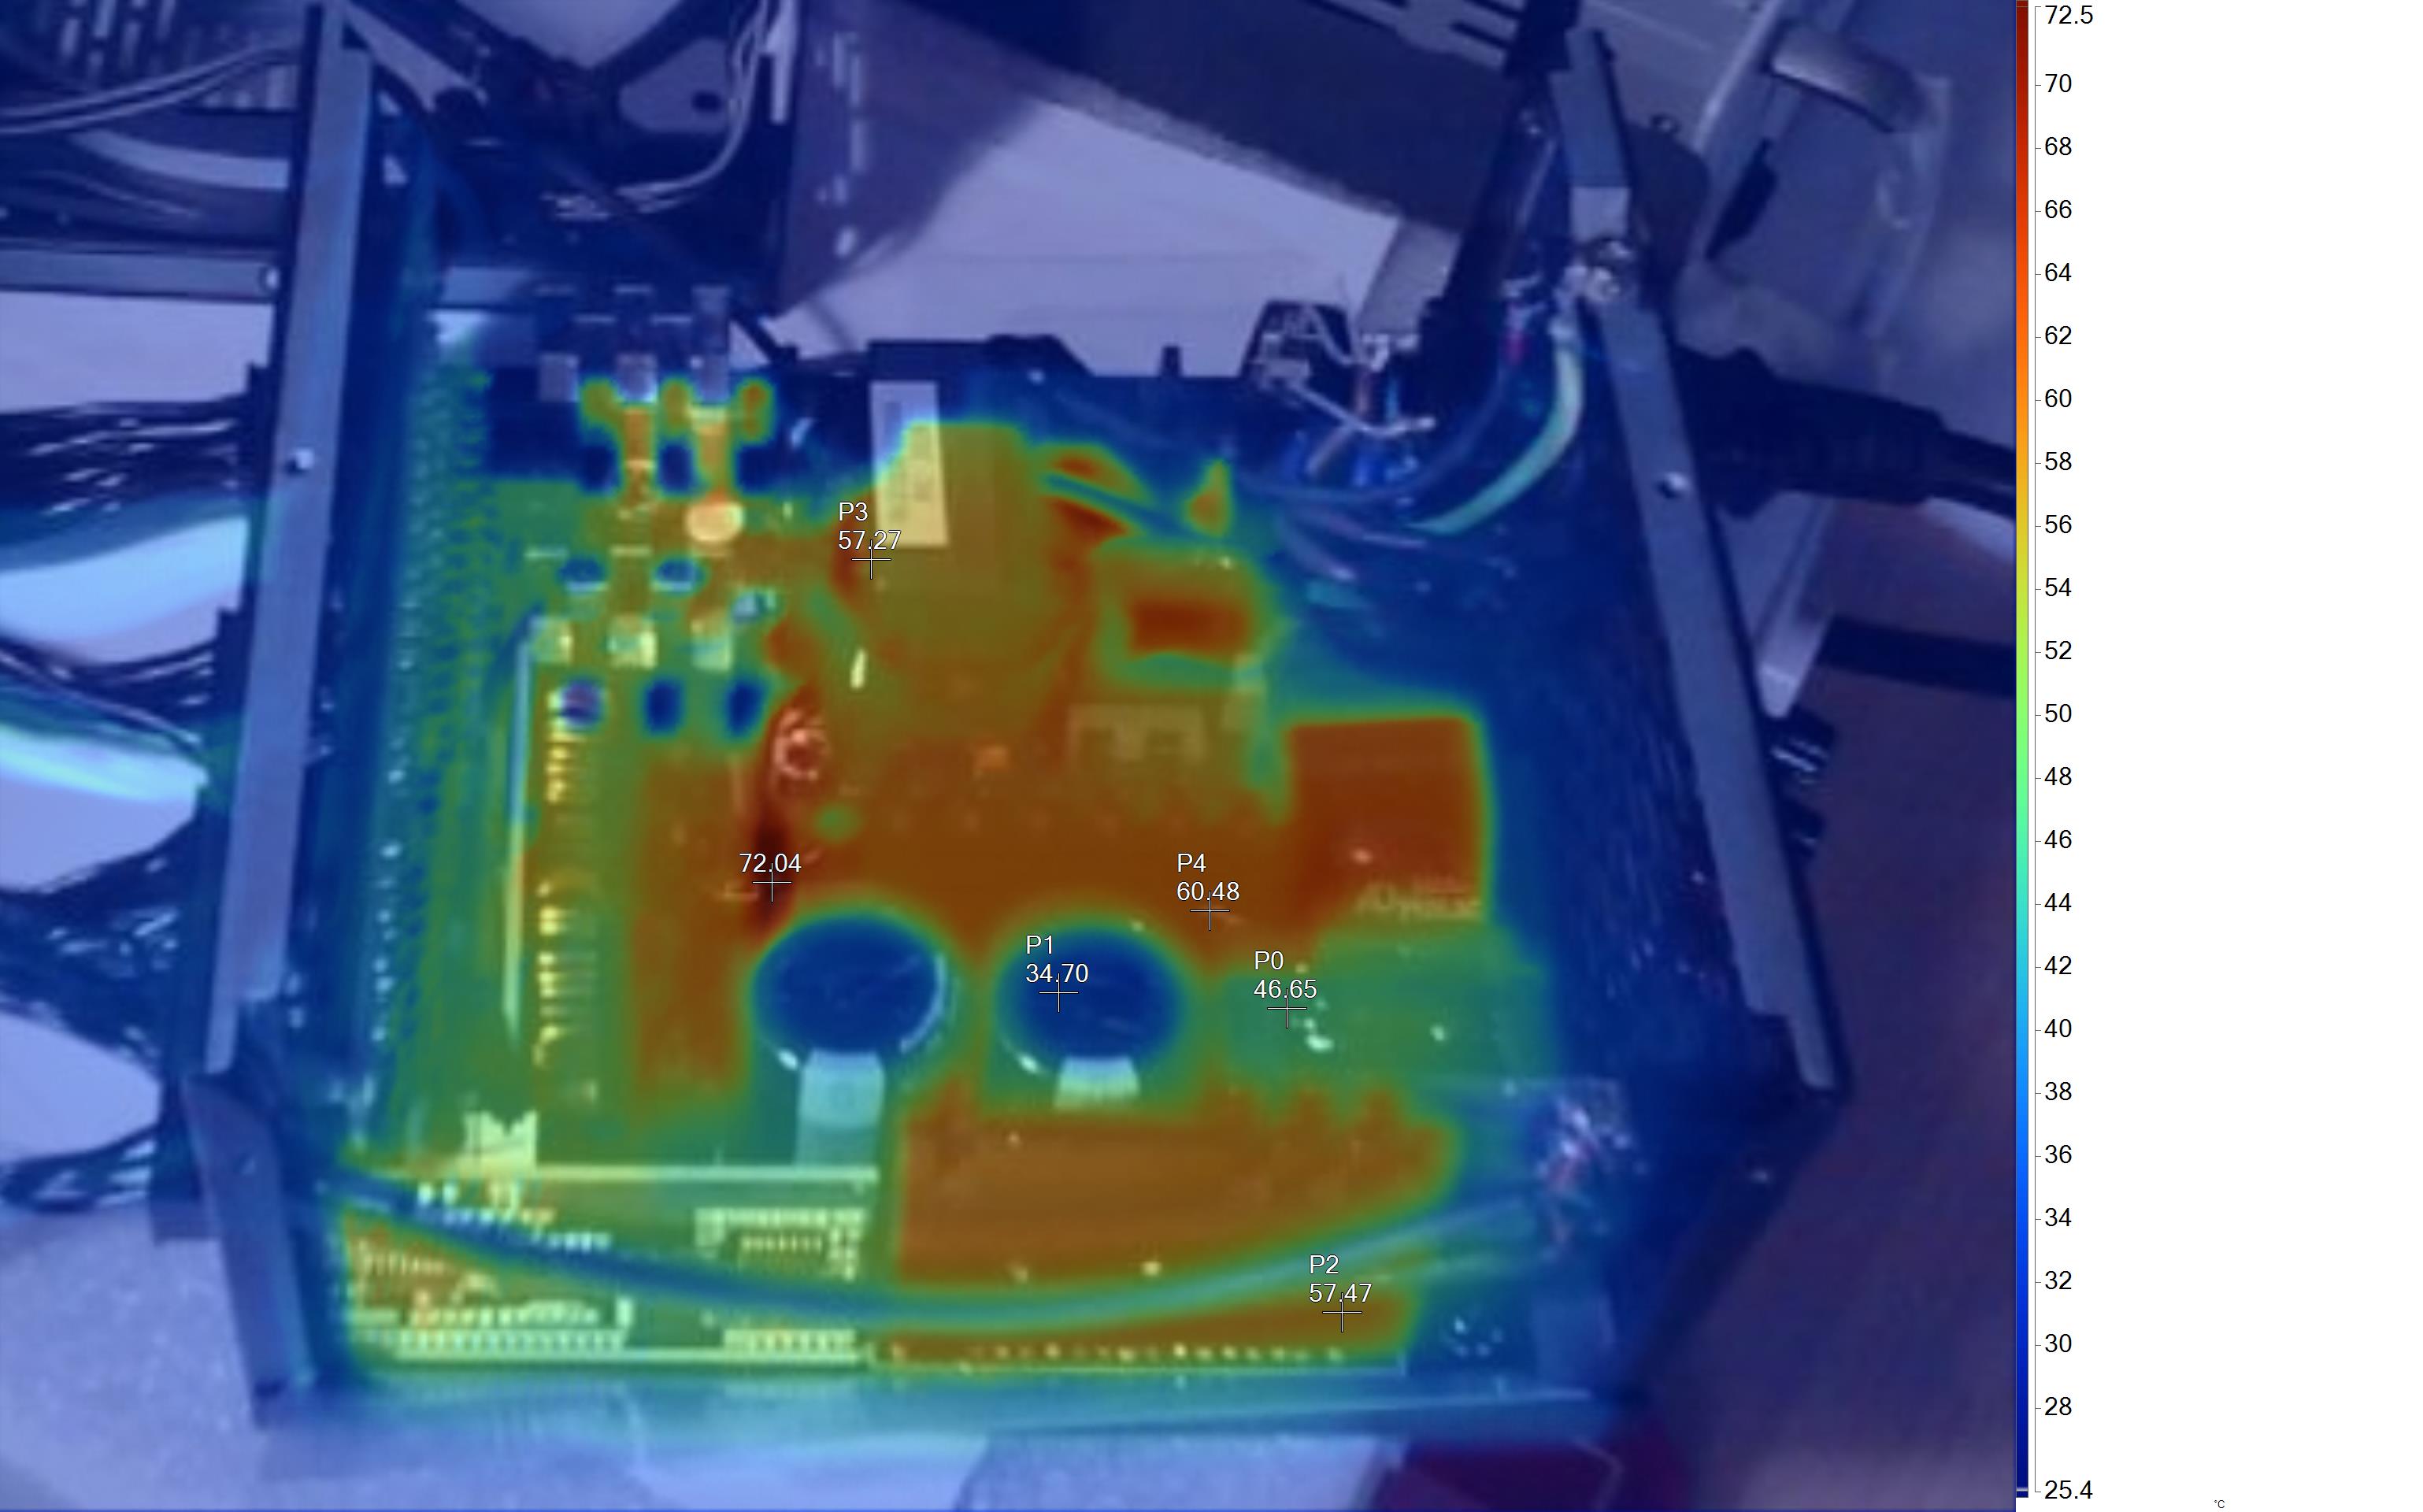
The temperatures at the PSU's internals remain at low levels, despite the operating conditions, so there is no need for an aggressive fan speed profile.
MORE: Best Power Supplies
MORE: How We Test Power Supplies
MORE: All Power Supply Content
Current page: Protection Features, DC Power Sequencing, Cross-Load Tests and Infrared Images
Prev Page Load Regulation, Hold-Up Time, Inrush & Leakage Current, Efficiency and Noise Next Page Transient Response Tests, Timing Tests, Ripple Measurements and EMC Pre-Compliance Testing
Aris Mpitziopoulos is a contributing editor at Tom's Hardware, covering PSUs.
