Tom's Storage Charts 2009: A New Test Environment
Power, Efficiency, Temperature, And Noise Testing
Power Consumption Testing
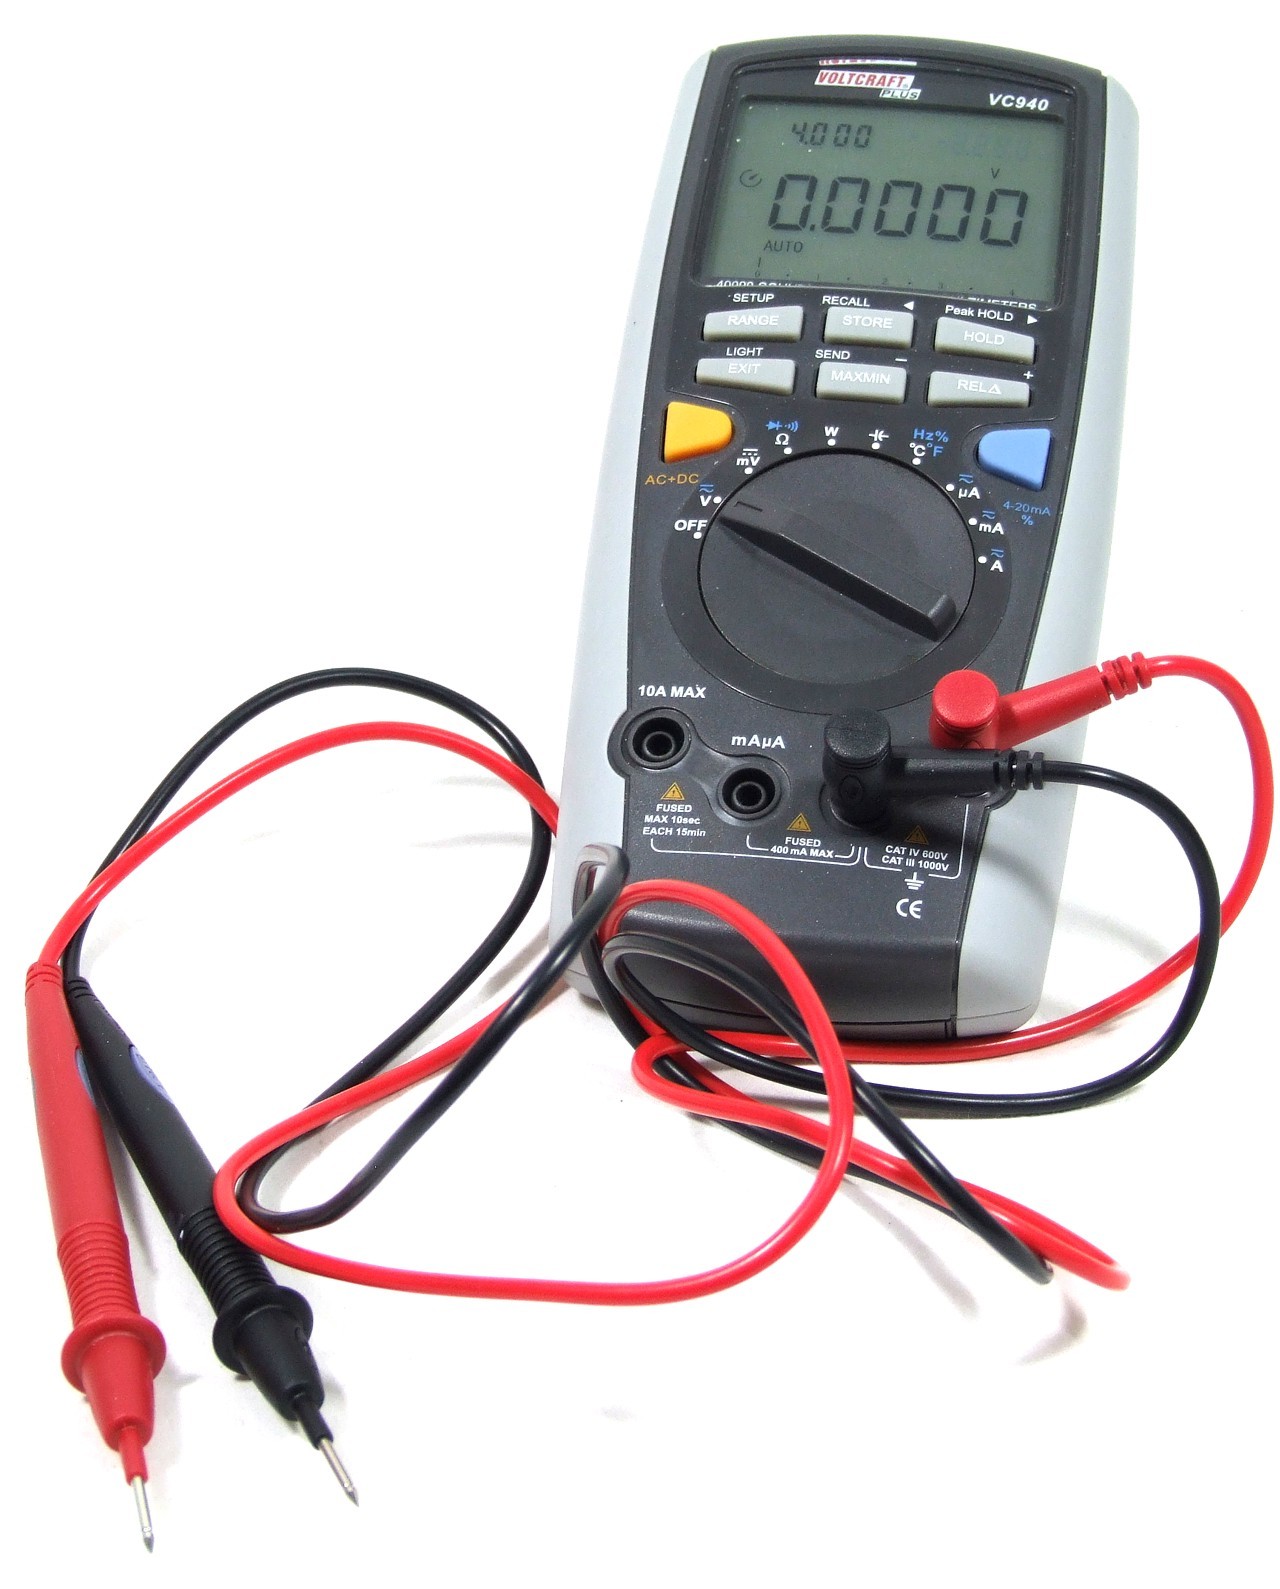
Simply measuring idle and peak power isn’t necessarily enough, as power used during drive activity can vary a lot. Hence we decided to measure power while the drives are working on specific workloads. All power measurements are executed at the drive’s power connector, using a Voltcraft VC940 multimeter, so the results reflect the actual drive power requirement very accurately. The multimeter we selected has a USB port, which allows us to track power at all times. Typically we use 1-second increments. Since we need to track both 5 V and 12 V levels, we use two of these multimeters. Thanks to this feature we can not only look at average power consumption for specific workloads, but can also track the total power used for a workload or after a certain period of time.
The Voltcraft device provides nice bang for the buck—the device isn’t cheap, but it offers sufficient precision for our purposes. There are better solutions, but our results don’t need to be at a scientific level.
| Measurement | Purpose | Action |
|---|---|---|
| Power at idle | Low power idle requirement | Simple measurement after 10 minutes of system inactivity |
| HD Movie Playback | Determine power consumption at defined stream | We use the VLC player version 9.8h and play “The Big Buck Bunny” between 49s and 469s |
| IOmeter Streaming Reads | Determine power requirement at maximum sequential throughput | Execute streaming read benchmark with IOMeter, track peak power |
| IOmeter Workstation I/O | Determine power requirement at maximum random I/O activity | Execute workstation benchmark with IOMeter, track peak power |
Efficiency Testing
Since we are able to track the amount of power for each of the benchmarks, we can easily look at the performance score per watt-hour used, which we do using the IOmeter benchmark profiles. That’s watt-hours, by the way, not watts per hour. An alternative is to use an average benchmark result and divide it by the average power used, to calculate performance per watt.
Temperature Testing
We use a laser-assisted infrared thermometer to measure the surface temperature of hard drives and SSDs. Since we want to look at peak temperature, we execute the IOMeter benchmark runs before measuring surface temperature. We examine all six sides of the SSD and work with the highest temperature reading we get.
Noise Testing
This is a critical aspect of our testing that many of our readers have been requesting, but at the same time we recognize that the testing does not always make sense. We built a sound-proofed box many years ago, which allows us to place a hard drive on a flat and dampened surface within the box, and insert a decibel meter from the top. It is important to maintain exactly the same distance between the noise emitting product and the microphone of the decibel meter, or the results will not be comparable. While we will keep doing this for all new drives, there are several things to keep in mind:
- Measured noise in dB(A) does not always reflect subjective noise. It may happen that a drive is objectively quiet, although some people perceive it as being more noisy.
- Measured noise may include vibrational noise. It may happen that a drive may appear noisier than it actually is, as we cannot fully eliminate noise from drive vibration.
- Is noise really relevant? For all hard drives running at 5,400 RPM and below, we believe that the noise level is only relevant for a very small fraction of all users; 7,200 RPM desktop hard drives are also typically quiet. As a result, any fan—especially one on a graphics card—is going to be noisier than a drive in idle. Drive activity noise, however, is more important.
We measure noise during an IOmeter workstation test run, and when the drive is in active idle mode (spinning), and track the peak values we get. We repeat these tests three times to make sure that results aren’t influenced by external sound sources, as the measuring equipment is highly sensitive.
Current page: Power, Efficiency, Temperature, And Noise Testing
Prev Page Performance: IOMeter 2006.07.27 Next Page Tom’s Storage Charts: New For 2009Get Tom's Hardware's best news and in-depth reviews, straight to your inbox.
