Tom's Storage Charts 2009: A New Test Environment
Performance: IOMeter 2006.07.27
I/O performance depends on a drive’s ability to quickly reposition its heads, as well as utilizing the Native Command Queuing feature. NCQ organizes and executes pending commands in a way that delivers maximum performance by minimizing head repositioning activity. The tool we use was made for Windows, but it can also be executed at the command line, which is beneficial for bulk testing of several drives.
Unlike other benchmarks, which run a pre-set sequence of commands to determine performance, IOMeter is “programmable.” This means that you have to tell the benchmark what to do and in what order. Some years ago, we started to use IOMeter profile files, which simulate certain hard drive workloads, and we’ll keep using these four profiles for database, file server, Web server and workstation workloads. The only two additions are streaming read and write tests, which we introduced a few months ago.
Profiles
| Row 0 - Cell 0 | Read | Random | Block Size | Workers |
| Database | 67% | 100% | 8 KB - 100% | 4 |
| Fileserver | 80% | 100% | 512 Bytes – 10%1 KB – 5%2 KB – 5%4 KB – 60%8 KB – 2%16 KB – 4%32 KB – 4%64 KB – 10% | 4 |
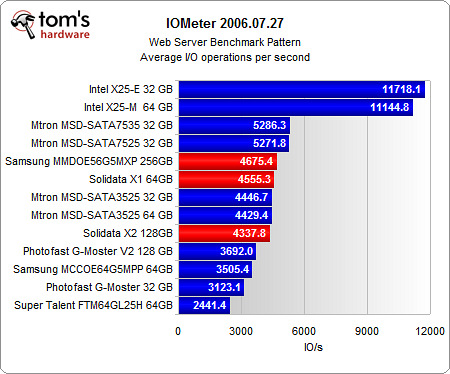
| Web server | 100% | 100% | 512 Bytes – 22%1 KB – 15%2 KB – 8%4 KB – 23%8 KB – 15%16 KB – 2%32 KB - 6%64 KB – 7%128 KB – 1%512 KB – 1% | 4 |
| Workstation | 80% | 80% | 8 KB - 100% | 4 |
| Streaming Reads | 100% | 0% | 64 KB – 34%128 KB – 33%256 KB – 33% | 4 |
| Streaming Writes | 0% | 0% | 64 KB – 34%128 KB – 33%256 KB – 33% | 4 |
The table looks complex, but is actually easy to read. The first column, “Read”, lists the amount of read versus write access. For example, 67% means that we are specifying about 2/3 read activity and 1/3 write access. The second column defines the percentage of random versus sequential access. 100% means that there is only random activity, which is the case for almost all server applications. The other extreme can be seen in the streaming reads and writes tests, where we want data to be read or written sequentially. The “Block Size” column lists the distribution of block sizes, which is used for each of the benchmark runs. Finally, the number of workers equals the number of threads used. Since we have a Core i7 quad core with Hyper Threading disabled, four workers seem to be best.
Example Results
Current page: Performance: IOMeter 2006.07.27
Prev Page Performance: PCMark Vantage Next Page Power, Efficiency, Temperature, And Noise TestingGet Tom's Hardware's best news and in-depth reviews, straight to your inbox.
