Why you can trust Tom's Hardware
Comparison Products
It can be challenging to find drives of this caliber at 2TB, stemming from the limitations of a four-channel controller and models designed to be budget solutions. The SN770’s natural competitors, like the HP FX900 and Silicon Power UD90, either lack 2TB SKUs or are impossible to find at that capacity. However, denser flash has made the 2TB SK hynix Gold P31 a reality, so we will include that PCIe 3.0 drive. Similarly, the older Phison E18 controller is eight-channel and can manage 2TB just fine within the mid-grade PCIe 4.0 segment, so we’ve chosen the Sabrent Rocket NVMe 4.0 to represent that.
The rest of the drives in the mix are high-end PCIe 4.0 drives. These include the proprietary Samsung 980 Pro, Crucial P5 Plus, and WD sibling SN850. We also included the HP FX900 Pro, the faster cousin of the FX900, using a licensed InnoGrit controller that tends to be a bit more budget-oriented. Most of these drives have newer flash than the SN770, but WD is a wizard at getting the most out of its flash.
Trace Testing - 3DMark Storage Benchmark
Built for gamers, 3DMark’s Storage Benchmark focuses on real-world gaming performance. Each round in this benchmark stresses storage based on gaming activities including loading games, saving progress, installing game files, and recording gameplay video streams.
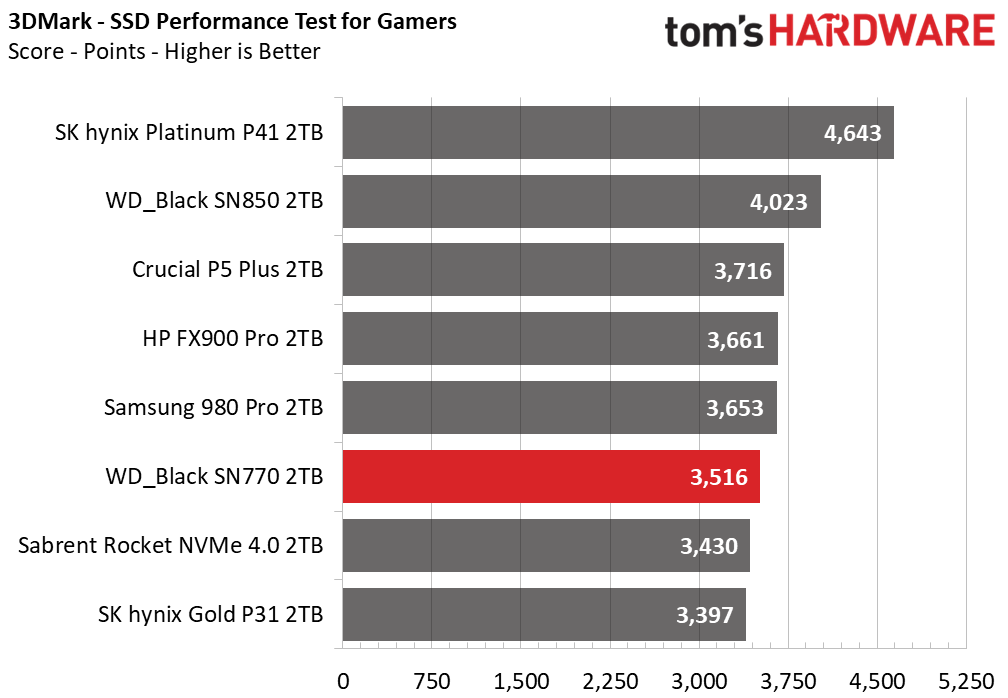
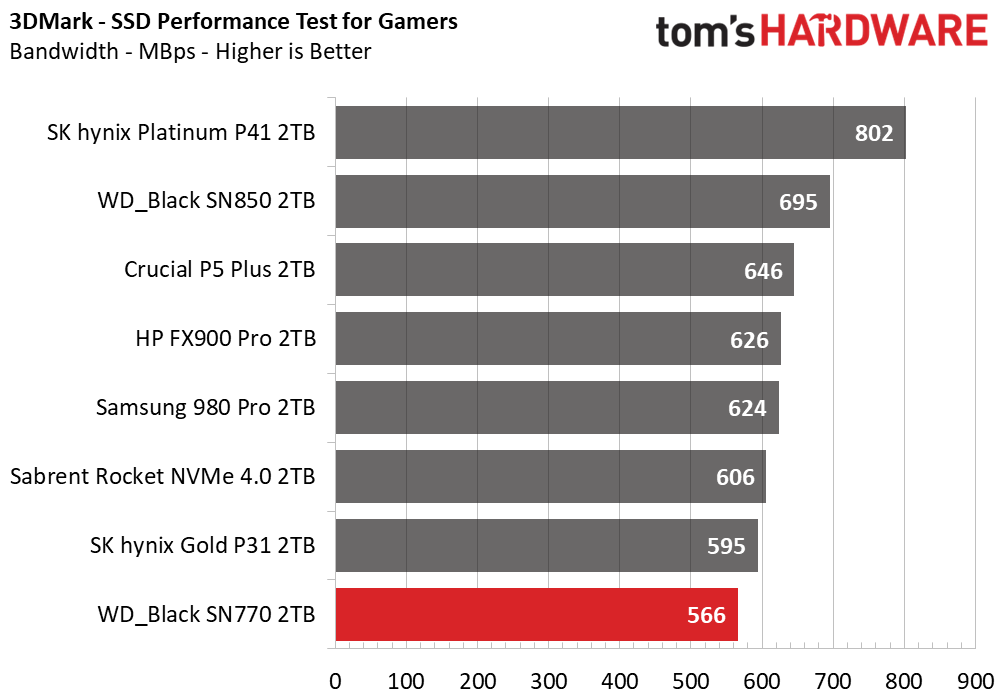
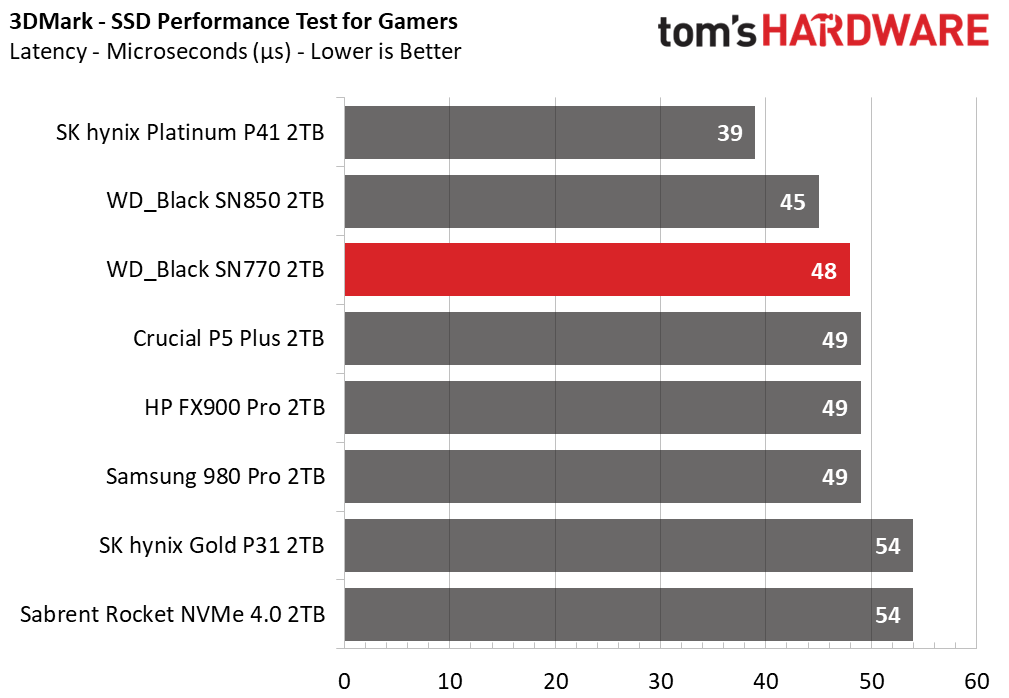
The 2TB SN770 retains its decent latency in the 3DMark benchmark but falls behind in the score and bandwidth measurement. This is true even compared to the 1TB SKU. Not only is 2TB a bit of a hindrance for this drive, possibly due to using denser dies of the same generation, but higher-end eight-channel drives can often make better use of more flash, especially if they have DRAM. We did not see much difference going from 1TB to 2TB on the Gold P31 in its respective review, perhaps owing to SK hynix’s superior flash architecture.
Trace Testing – PCMark 10 Storage Benchmark
PCMark 10 is a trace-based benchmark that uses a wide-ranging set of real-world traces from popular applications and everyday tasks to measure the performance of storage devices.
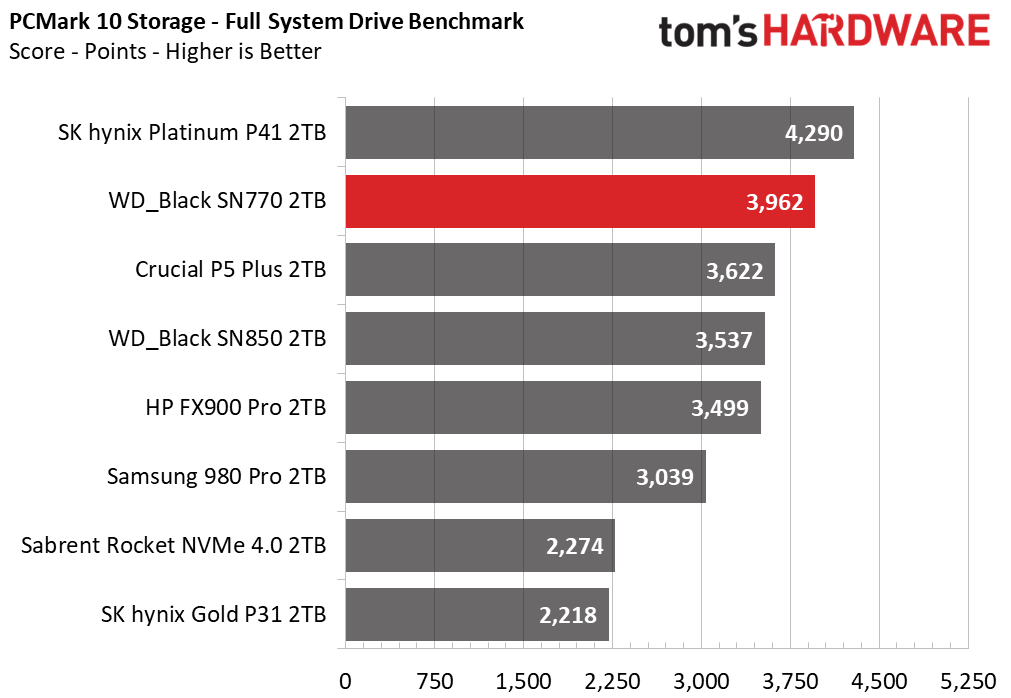
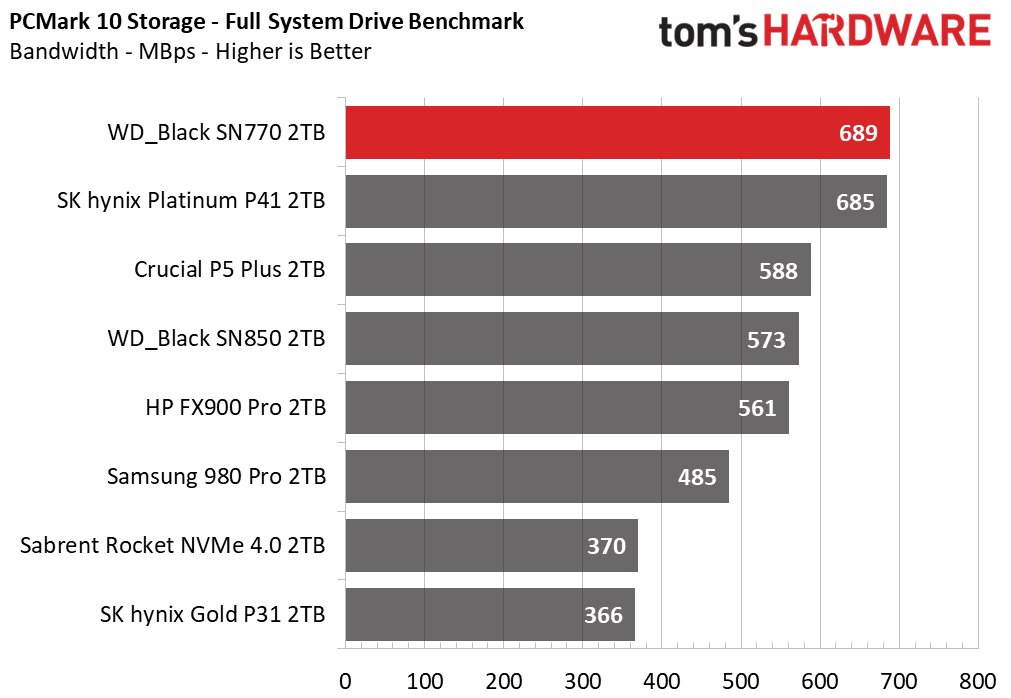
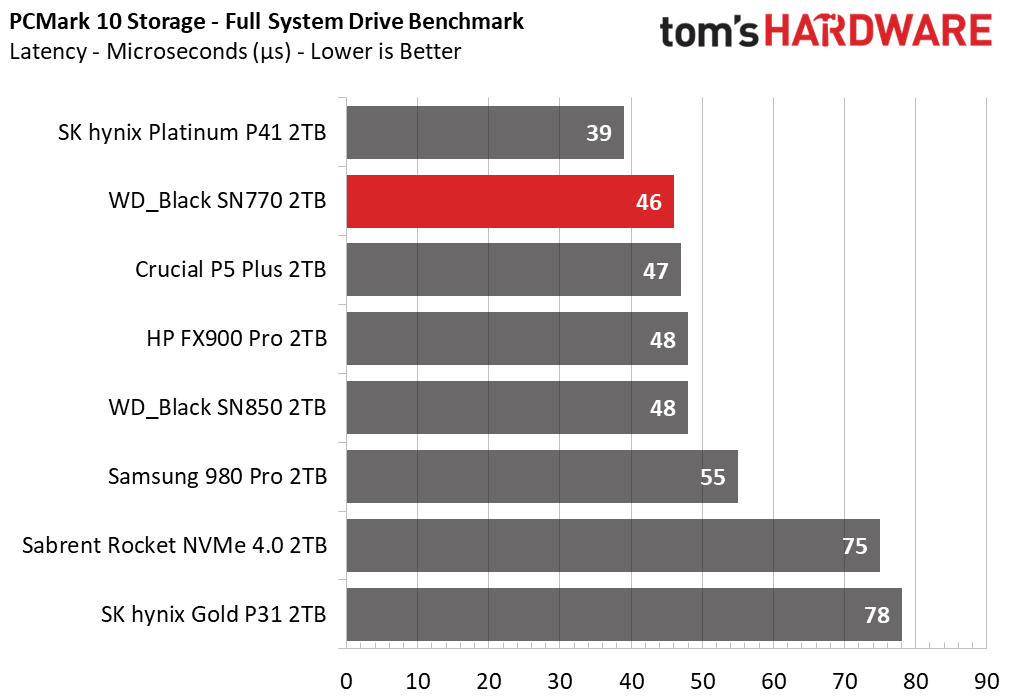
The SN770 still does fantastic in PCMark 10, punching well above its weight. It even starts to rival the excellent Platinum P41. This benchmark tends to be a bit more latency-sensitive and demonstrates that WD’s excellent firmware optimization leads to solid real-world performance.
Transfer Rates – DiskBench
We use the DiskBench storage benchmarking tool to test file transfer performance with a custom, 50GB dataset. We copy 31,227 files of various types, such as pictures, PDFs, and videos to a new folder and then follow-up with a reading test of a newly-written 6.5GB zip file.
Get Tom's Hardware's best news and in-depth reviews, straight to your inbox.
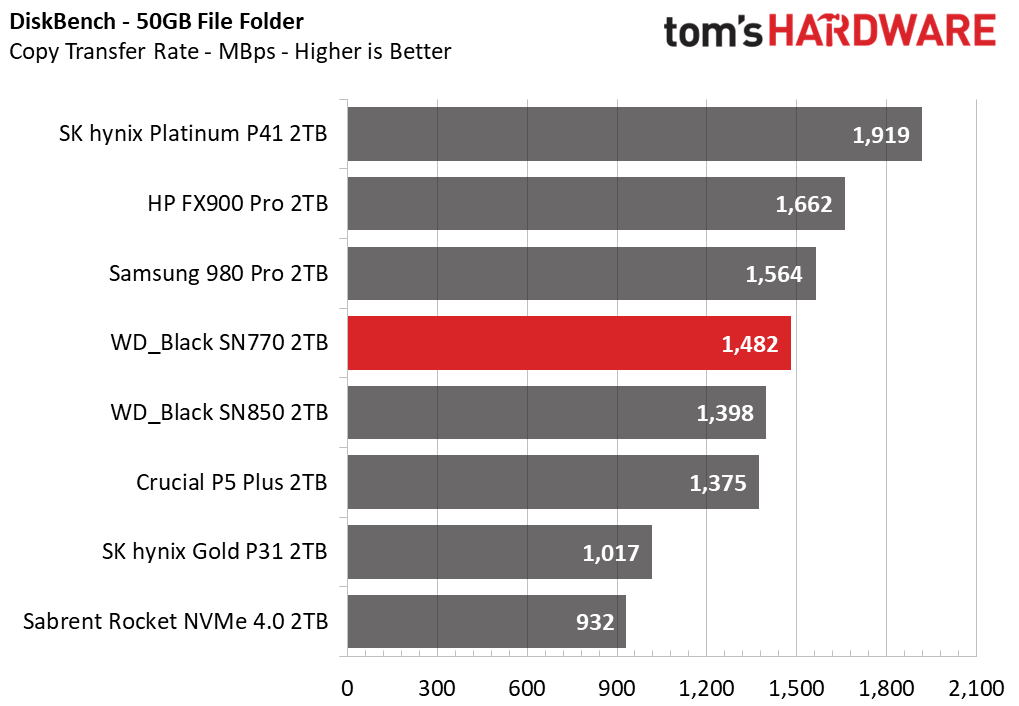
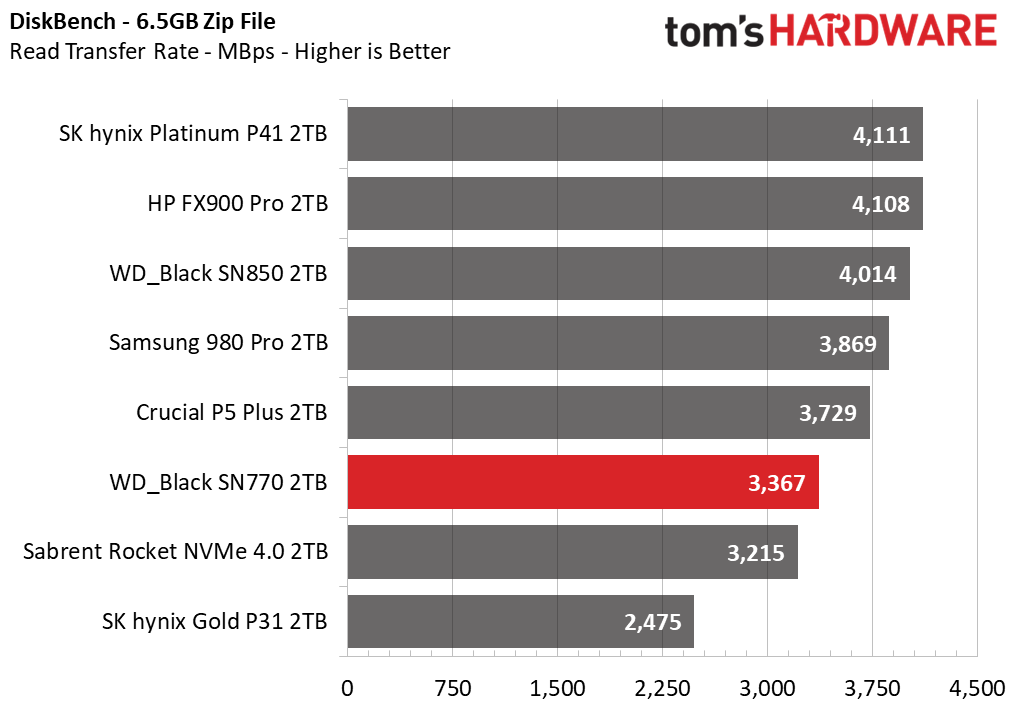
Bandwidth is bandwidth — the SN770 can’t push more than its channels and bus allow. It’s a bit faster than the Rocket NVMe 4.0 with read workloads and is faster all-around than the PCIe 3.0 Gold P31. However, it can’t touch the high-end PCIe 4.0 drives.
Synthetic Testing - ATTO / CrystalDiskMark
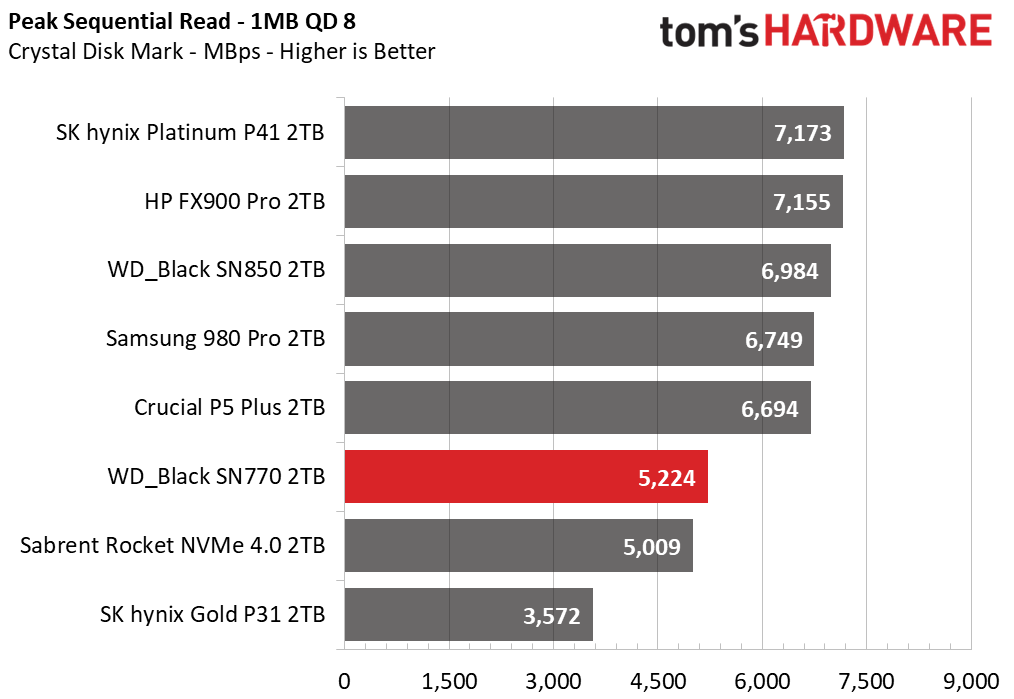
ATTO and CrystalDiskMark (CDM) are free and easy-to-use storage benchmarking tools that SSD vendors commonly use to assign performance specifications to their products. Both of these tools give us insight into how each device handles different file sizes.
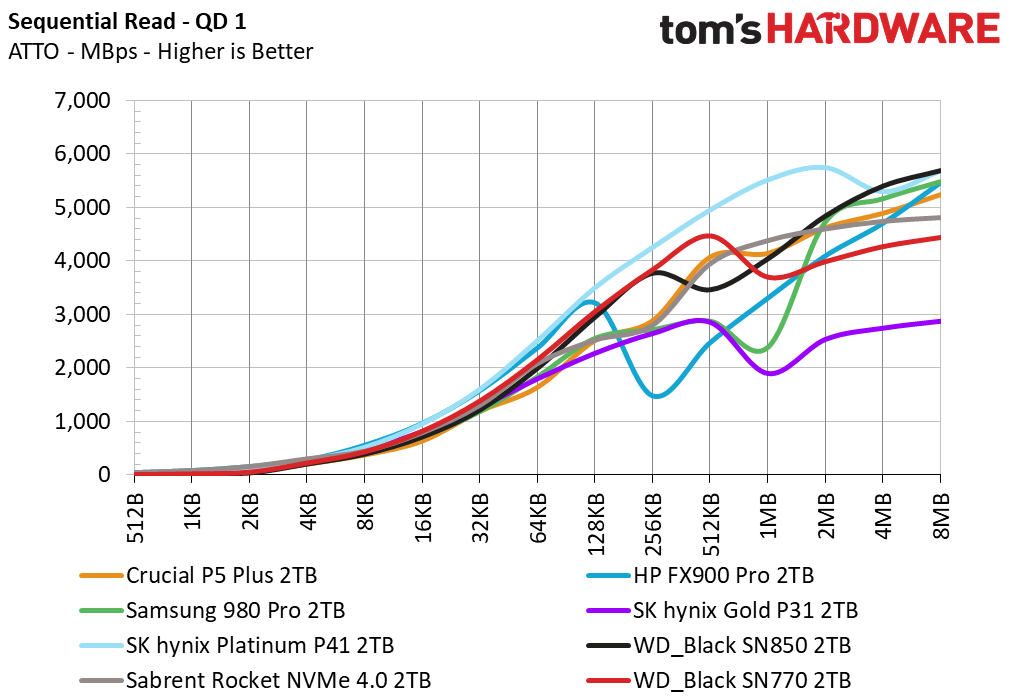
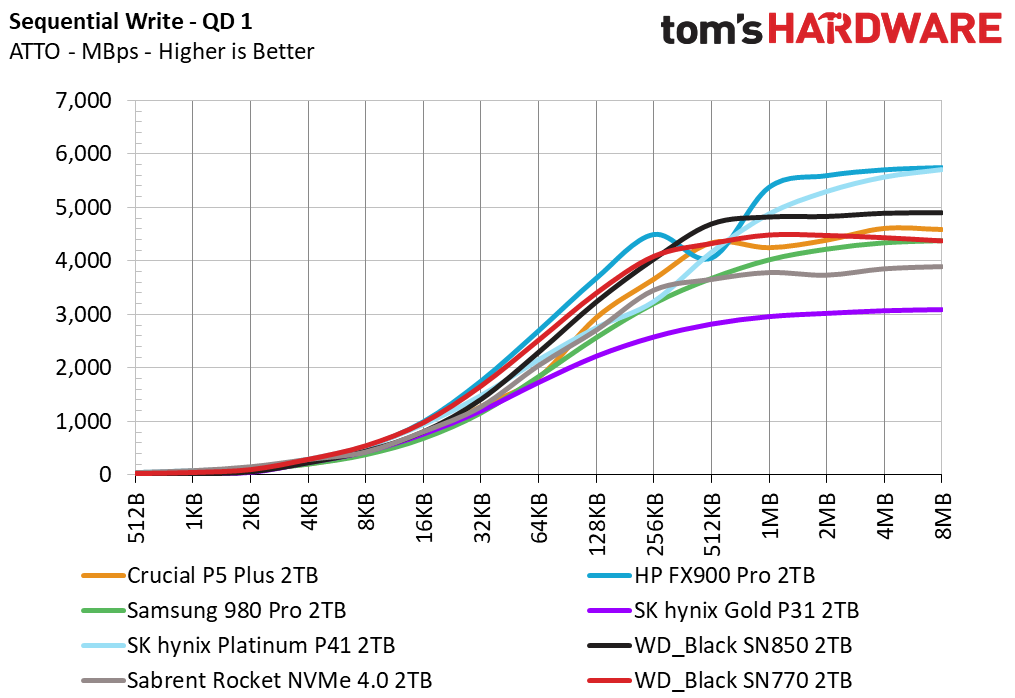
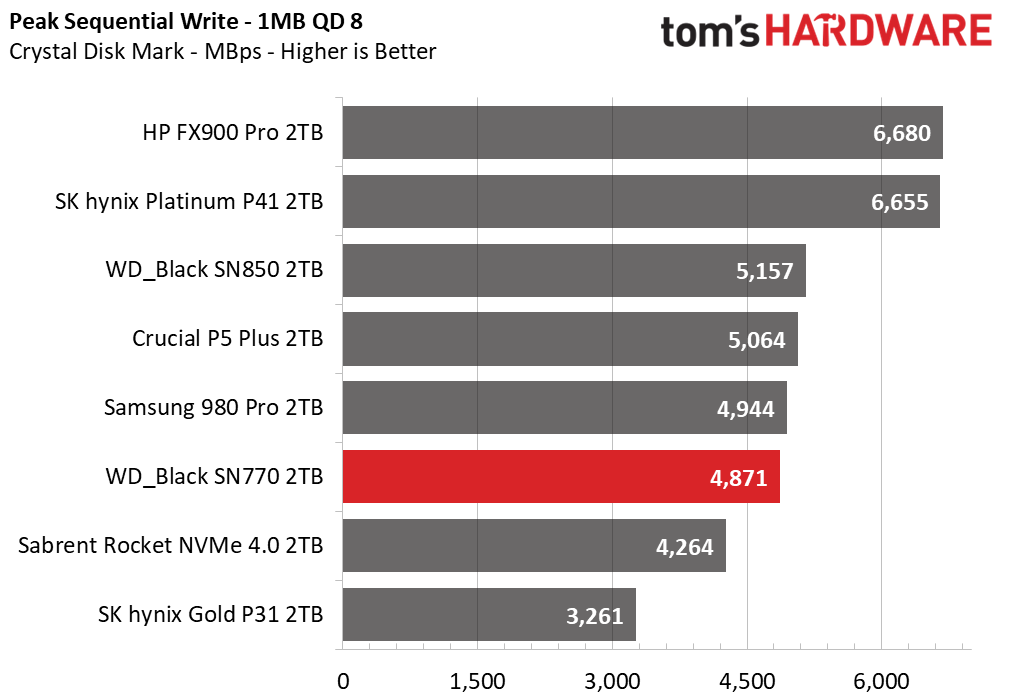
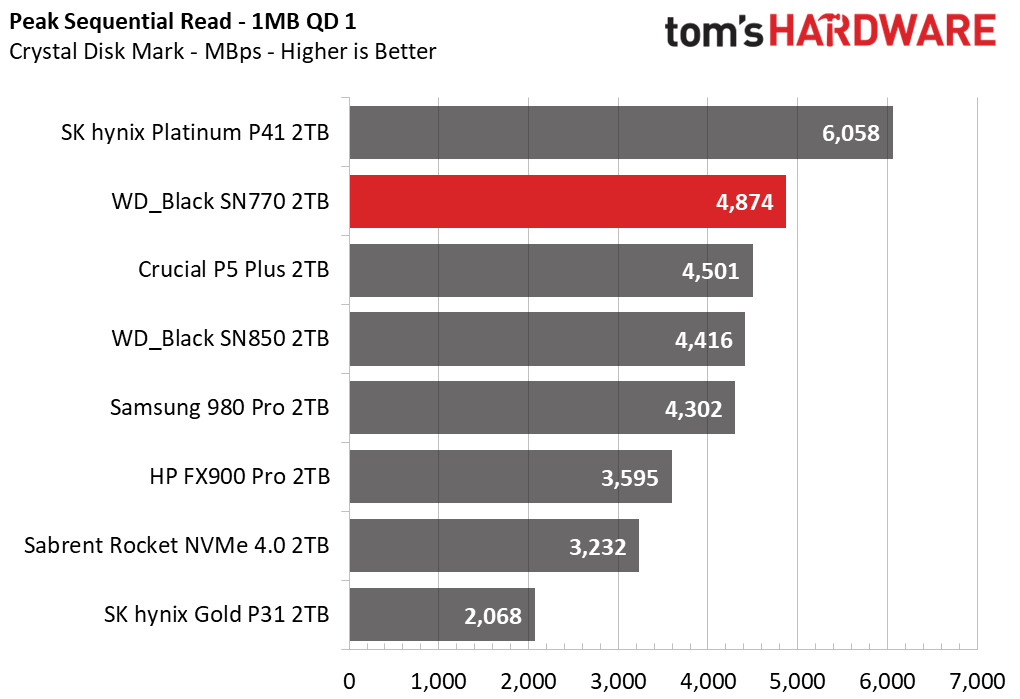
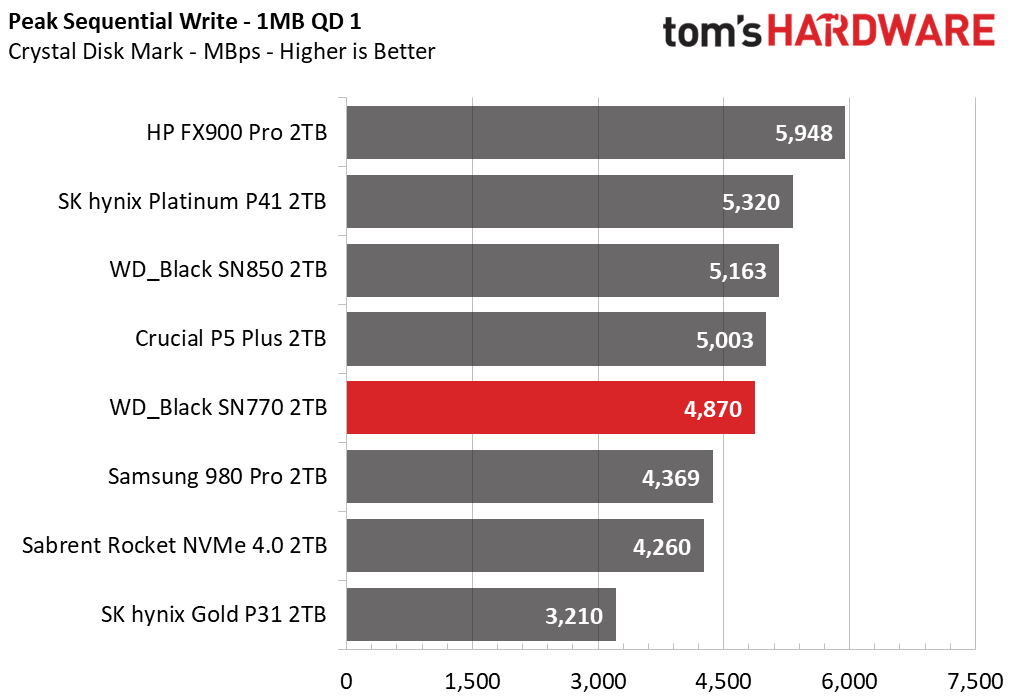
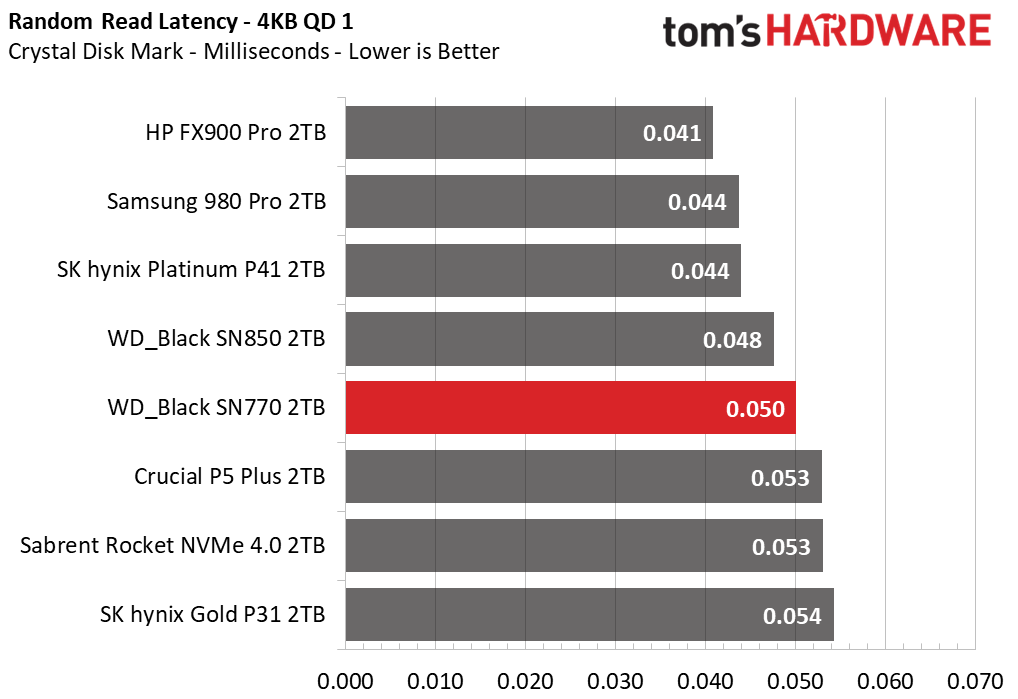
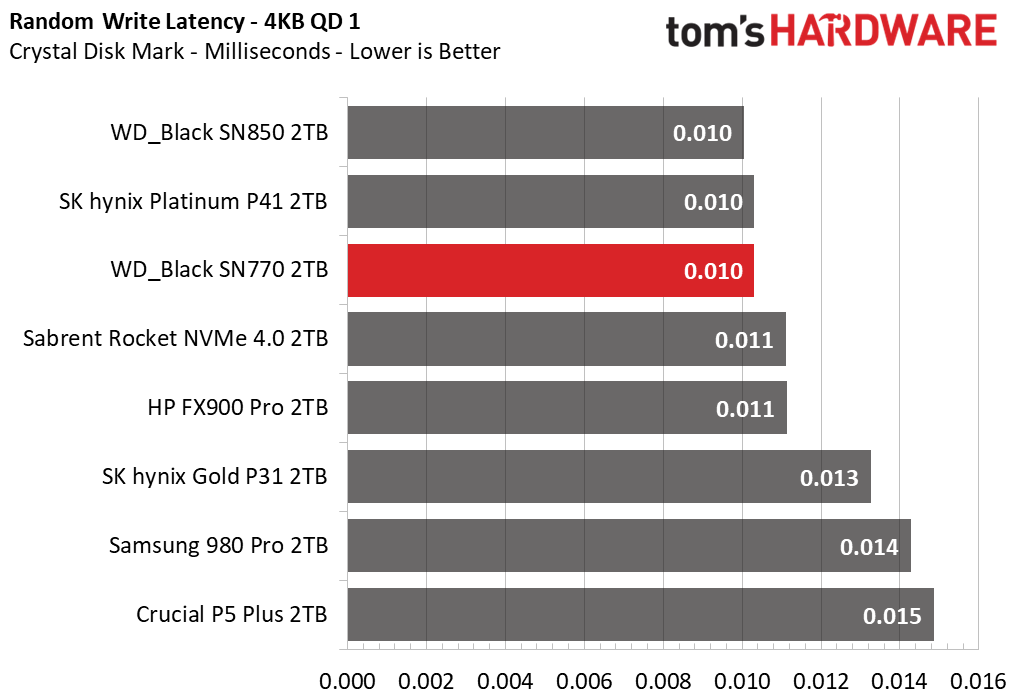
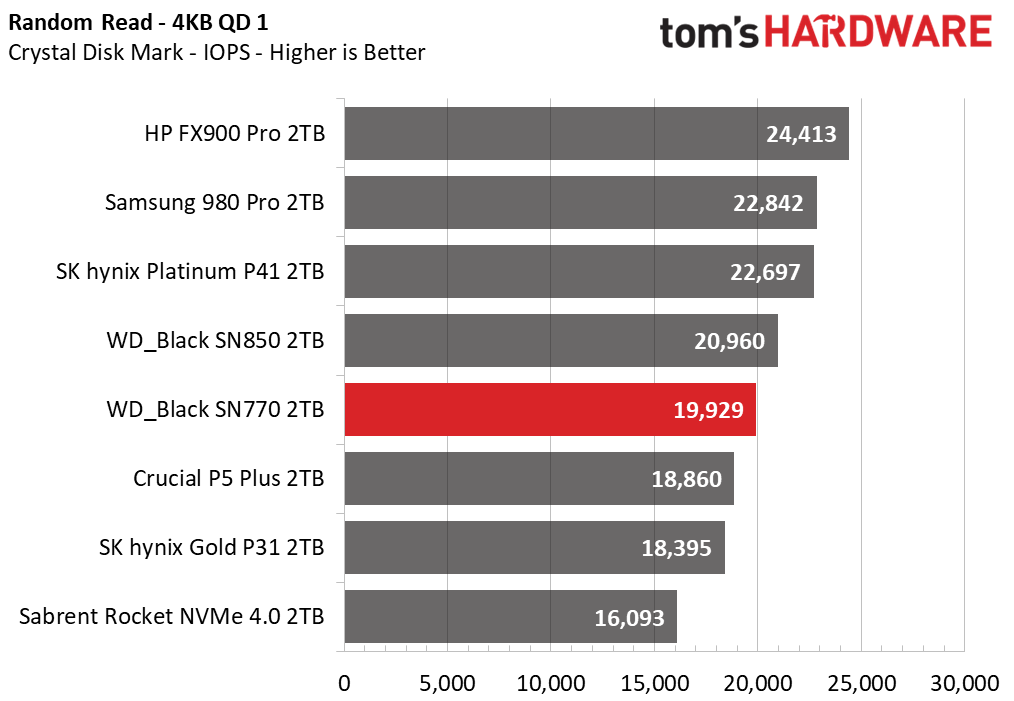
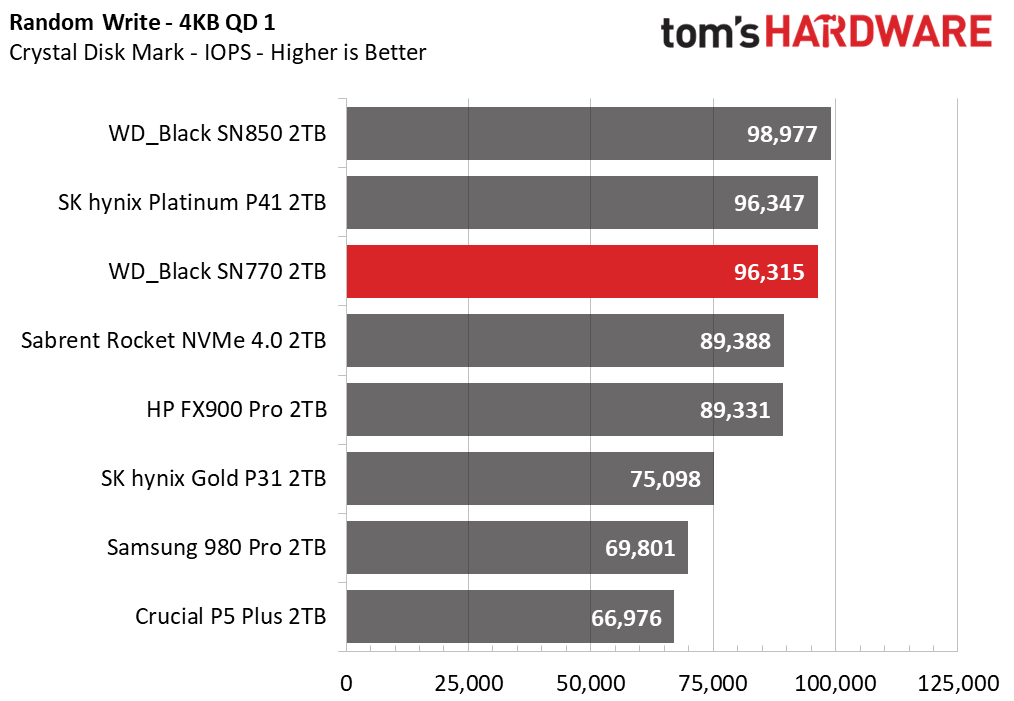
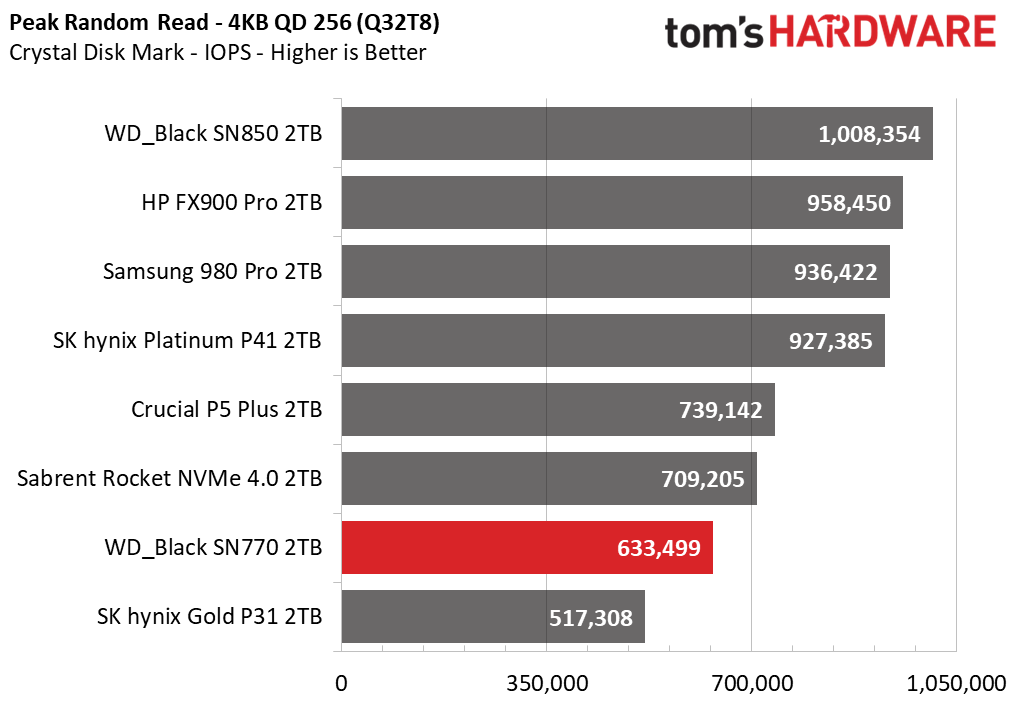
The SN770 does fine with the sequential write workload in ATTO, beating the Rocket NVMe 4.0 and Gold P31 while even matching the 980 Pro. The FX900 Pro and Platinum P41 are in a league of their own. This probably isn’t the most important metric, though. For the read portion of the test, the SN770 falls behind the Rocket NVMe 4.0, demonstrating again that Phison SSD controllers do well in this particular benchmark. The fact is, it can sometimes be difficult for cheaper drives to keep up at 2TB. Many eight-channel drives of the past PCIe 3.0 generation also had dips at 2TB, but newer flash raises the capacity bar.
Adding higher queue depth to the sequential workload in CrystalDiskMark allows the SN770 to maintain an advantage over the NVMe 4.0. It’s becoming difficult to recommend drives built on the older Phison E18 SSD controller when the SN770 and similar drives have newer technology. It comes down to price and availability; again, it can be difficult to find four-channel drives at 2TB, but if they’re as cheap as, or cheaper than, drives like the Rocket NVMe 4.0, they are the way to go. The SN770 even does well here at a queue depth of one, a test that can better represent typical file transfers.
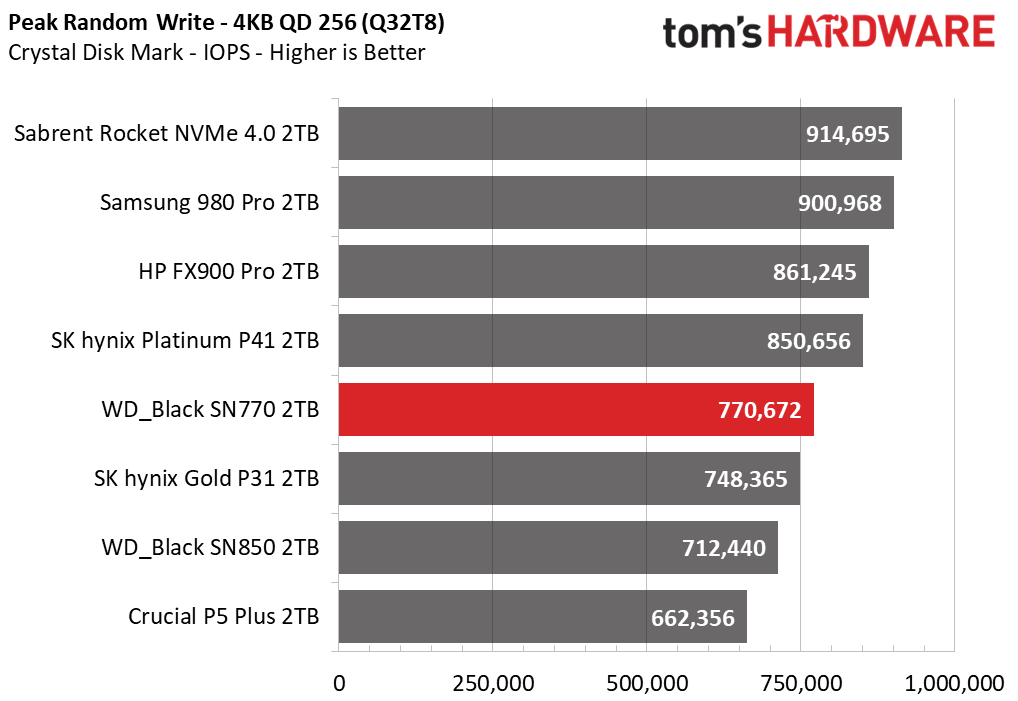
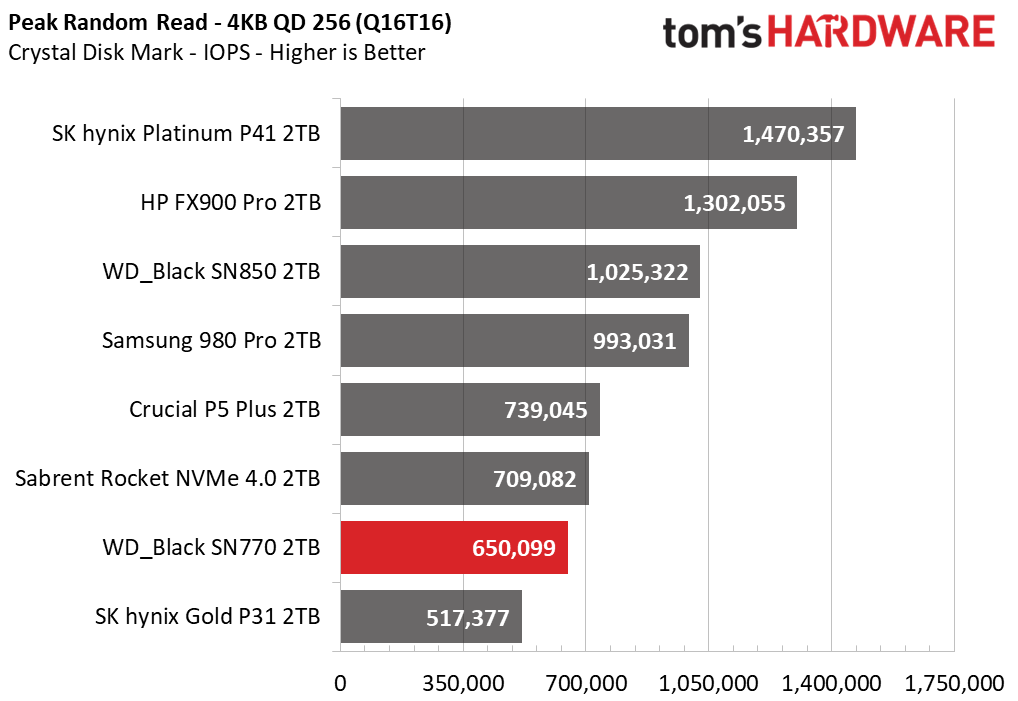
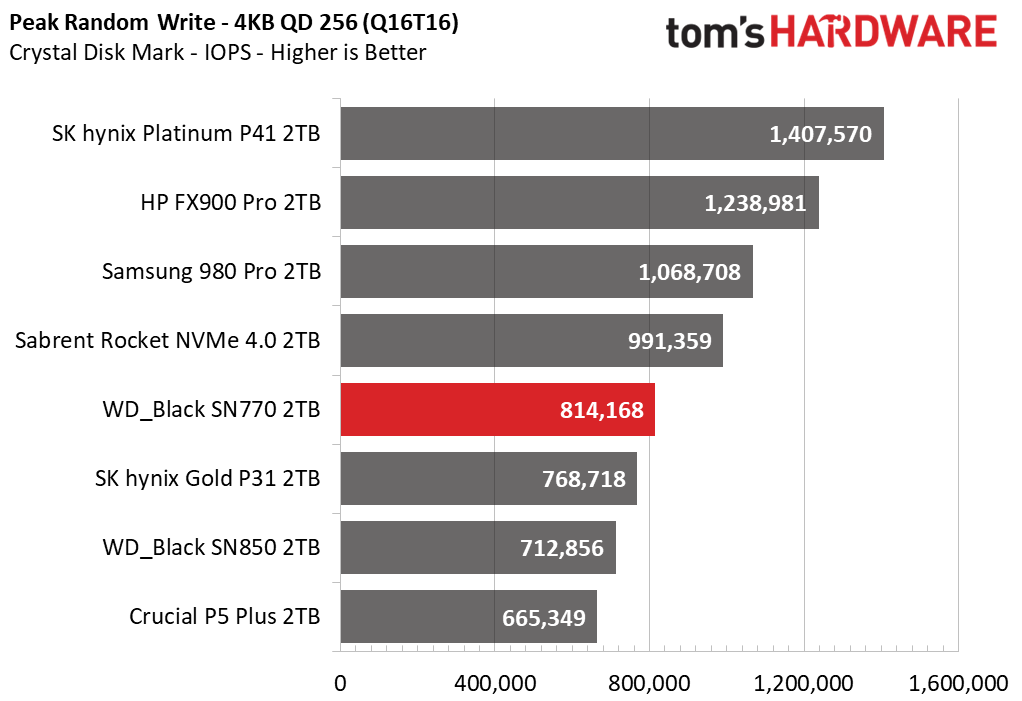
Random performance is mediocre and worse than the 1TB SKU. Nevertheless, this is a respectable showing for a budget drive and “good enough” performance for most users. This is not a powerhouse drive like the high-end PCIe 4.0 drives, but it doesn’t need to be. You can do worse if you need 2TB of capacity on the cheap.
Sustained Write Performance and Cache Recovery
Official write specifications are only part of the performance picture. Most SSDs implement a write cache, which is a fast area of (usually) pseudo-SLC programmed flash that absorbs incoming data. Sustained write speeds can suffer tremendously once the workload spills outside of the cache and into the "native" TLC or QLC flash. We use Iometer to hammer the SSD with sequential writes for 15 minutes to measure both the size of the write cache and performance after the cache is saturated. We also monitor cache recovery via multiple idle rounds.
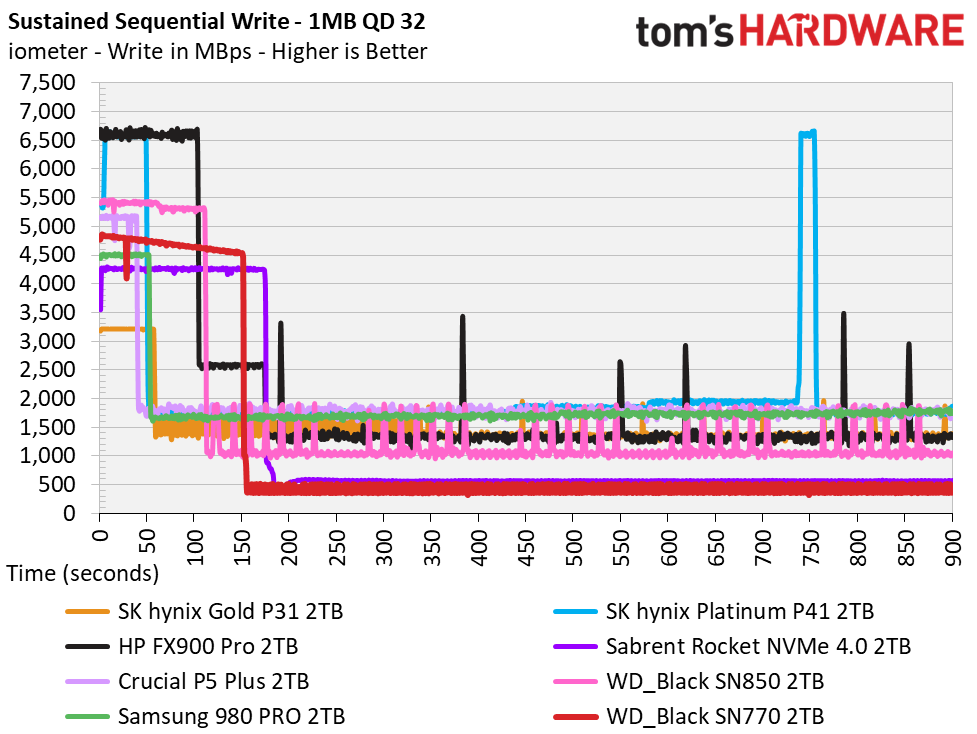
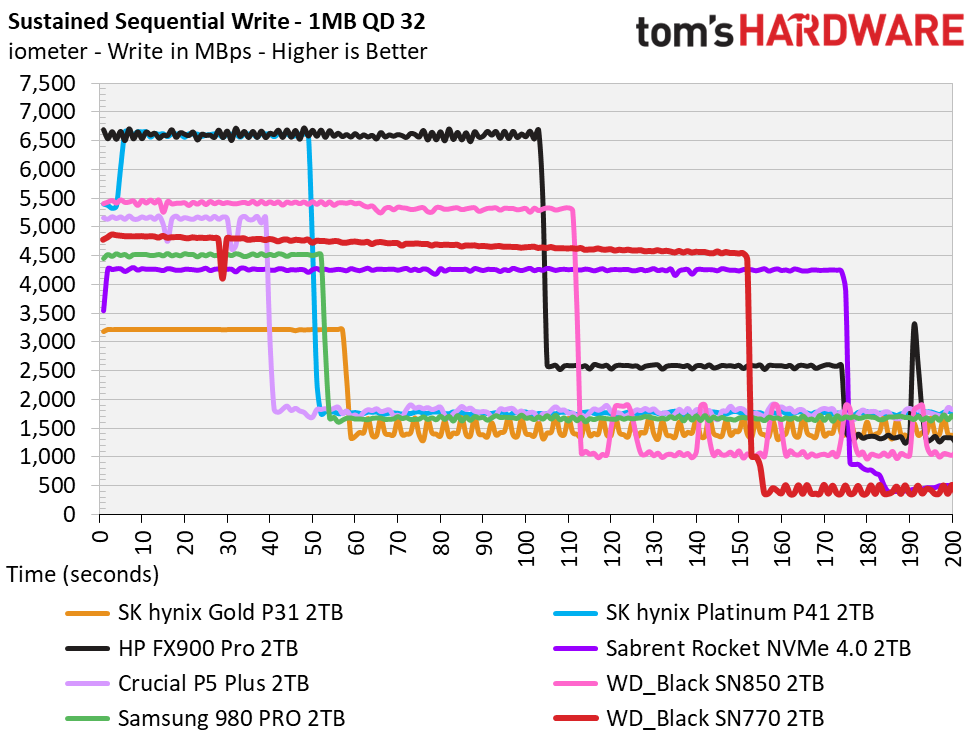
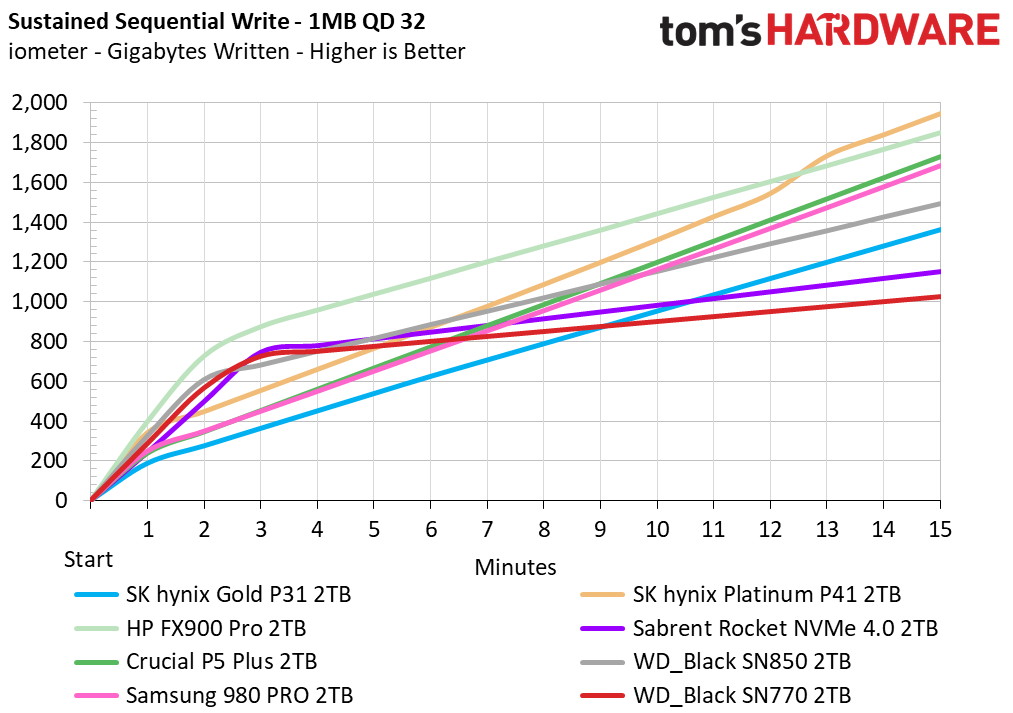
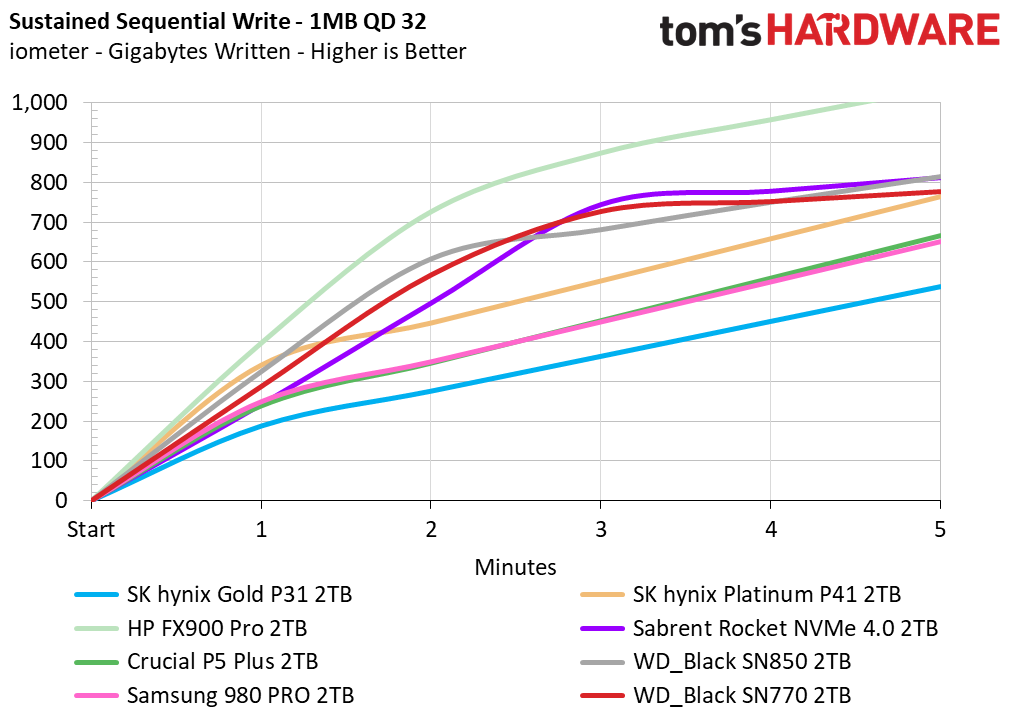
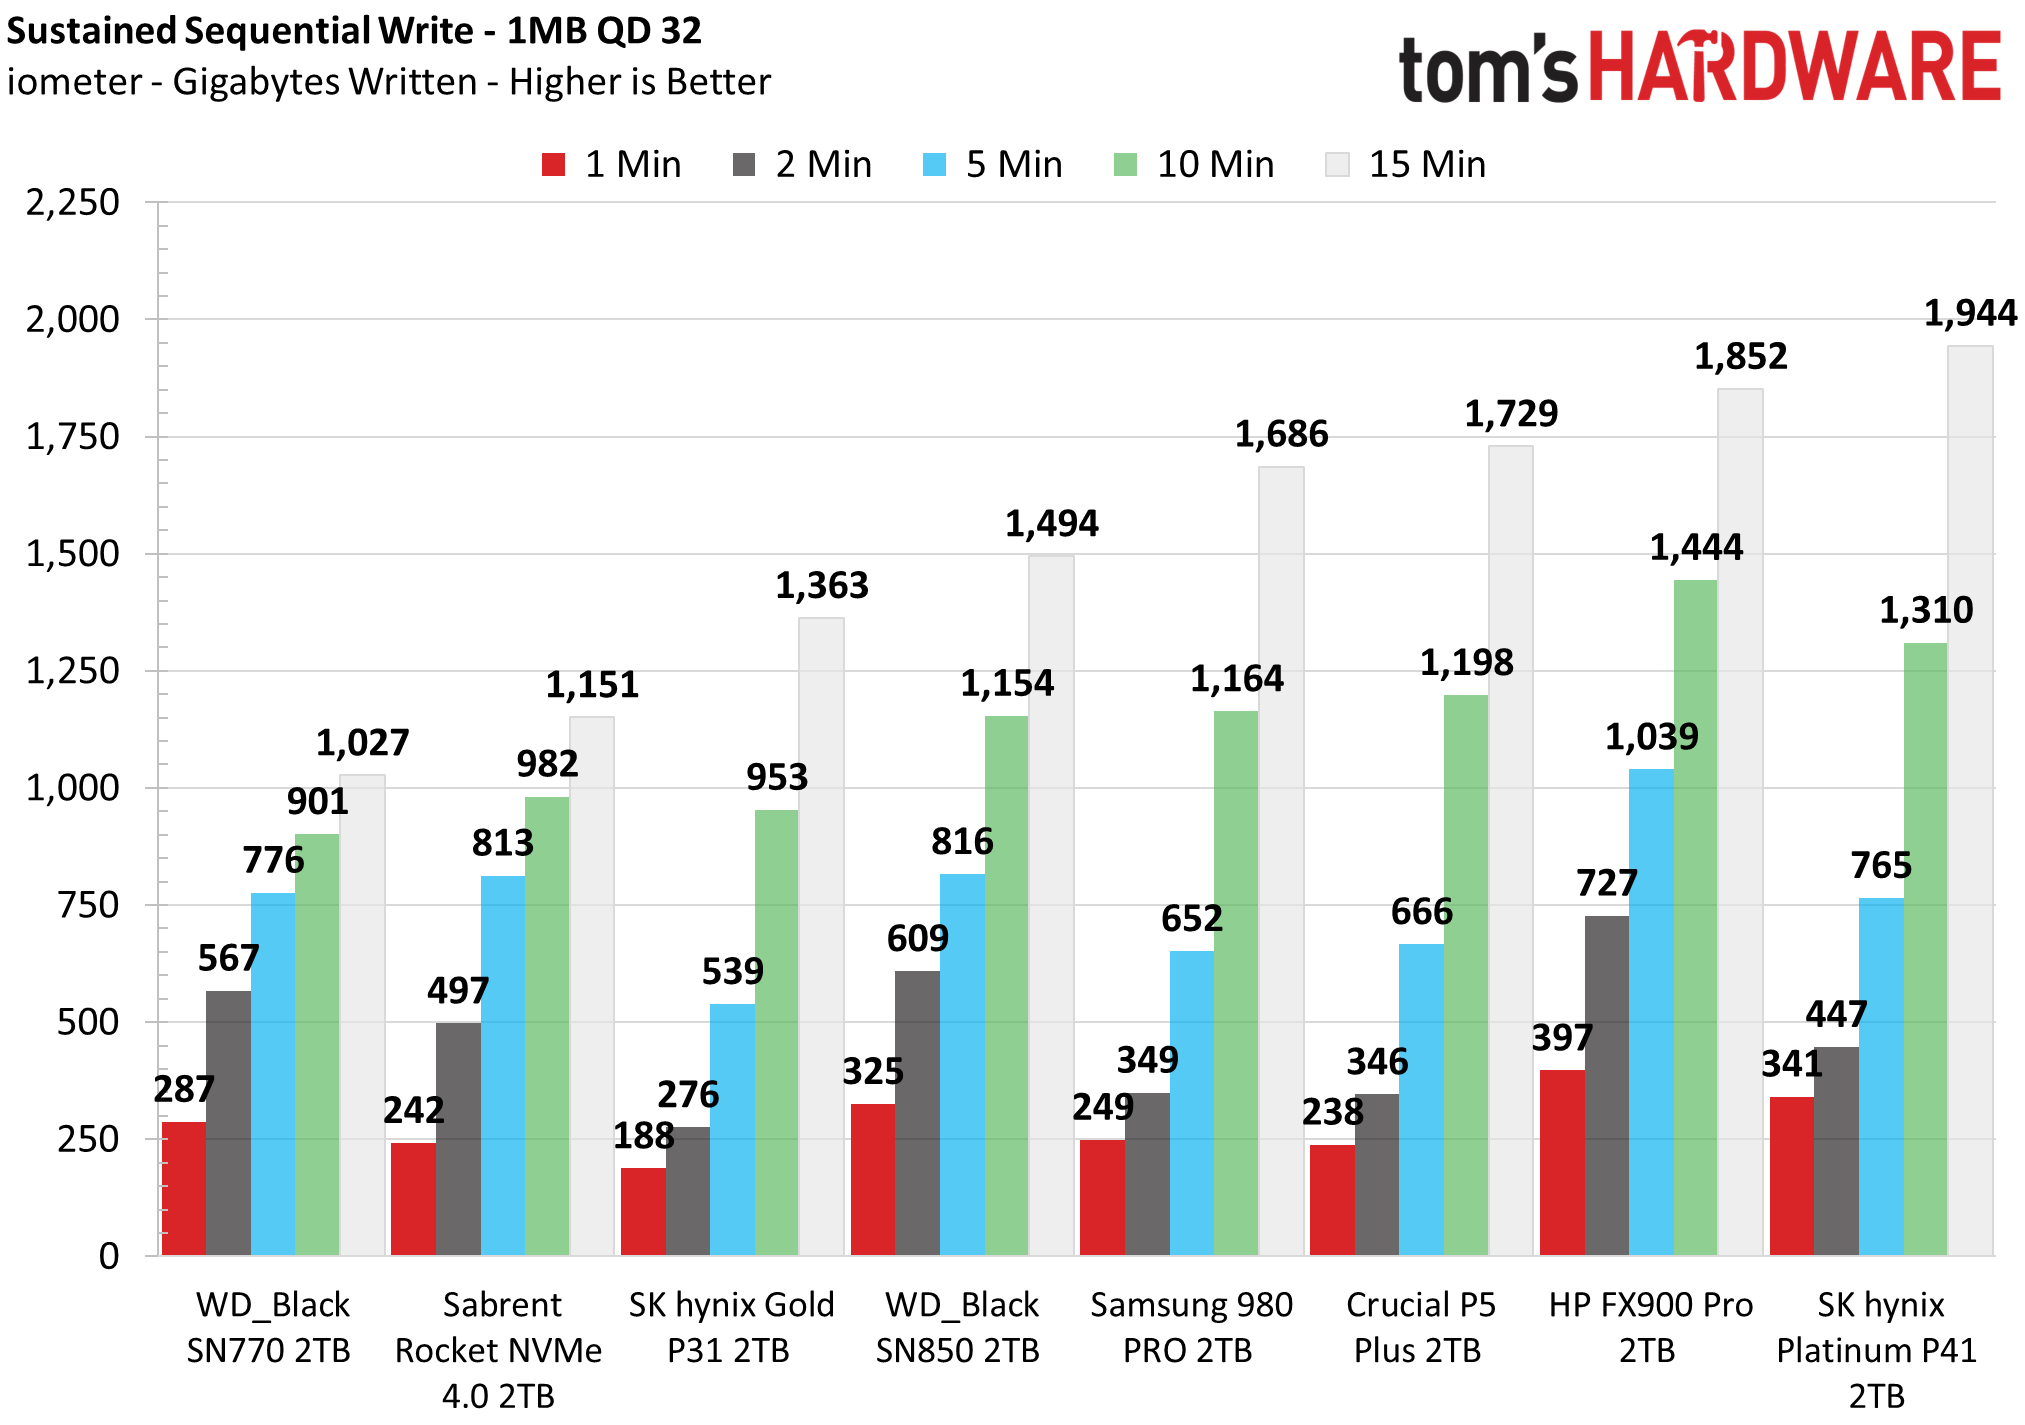
The 2TB SN770’s sequential write graph looks very similar to the 1TB, except that the SLC cache is considerably larger. In both cases, all of the TLC flash can run in SLC mode with a cache size of roughly one-third the capacity of the drive. Such a cache tends to be ideal for the general user who writes in bursts rather than in a prolonged manner. Performance outside of SLC, which is in TLC mode as bottlenecked by the folding of data from SLC to TLC, is quite poor. This drive may not be as consistent in edge cases, such as with a fuller drive and large writes.
The 2TB SN770 is also slower in both modes than the 1TB model, reflecting again that this much capacity comes at a bit of a performance cost. However, the larger cache can absorb more write data, which might make it faster in practice. As with the 1TB model, the SLC cache recovered rapidly, which is nice as it helps compensate for the performance outside the cache.
Power Consumption and Temperature
We use the Quarch HD Programmable Power Module to gain a deeper understanding of power characteristics. Idle power consumption is an important aspect to consider, especially if you're looking for a laptop upgrade as even the best ultrabooks can have mediocre storage.
Some SSDs can consume watts of power at idle while better-suited ones sip just milliwatts. Average workload power consumption and max consumption are two other aspects of power consumption, but performance-per-watt is more important. A drive might consume more power during any given workload, but accomplishing a task faster allows the drive to drop into an idle state more quickly, ultimately saving energy.
We also monitor the drive’s temperature via the S.M.A.R.T. data and an IR thermometer to see when (or if) thermal throttling kicks in and how it impacts performance. Remember that results will vary based on the workload and ambient air temperature.
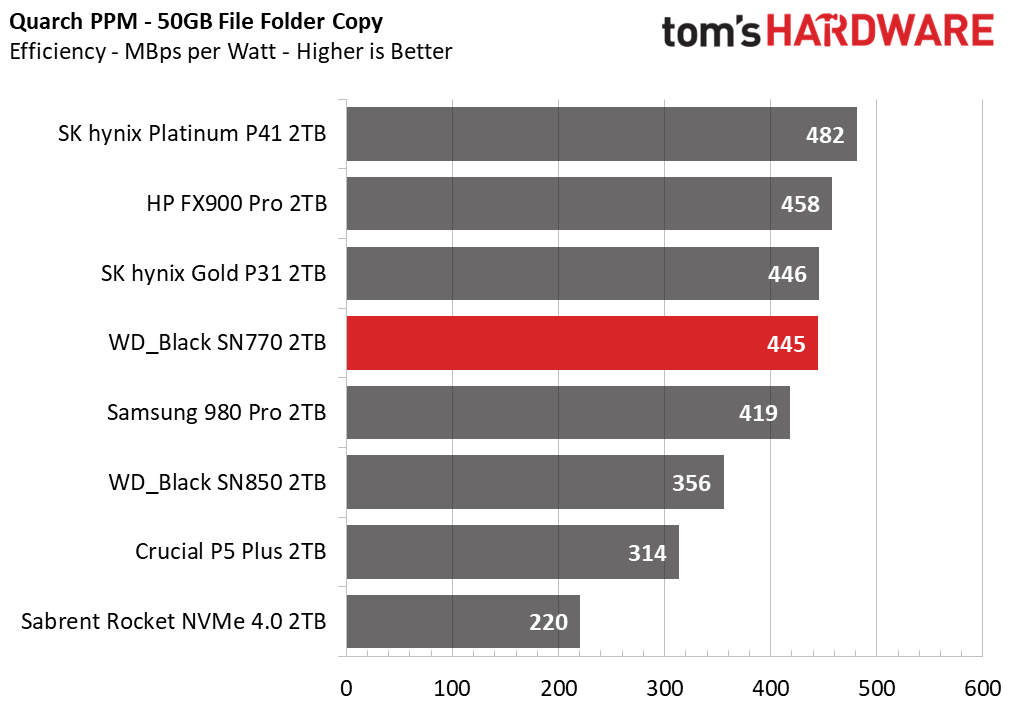
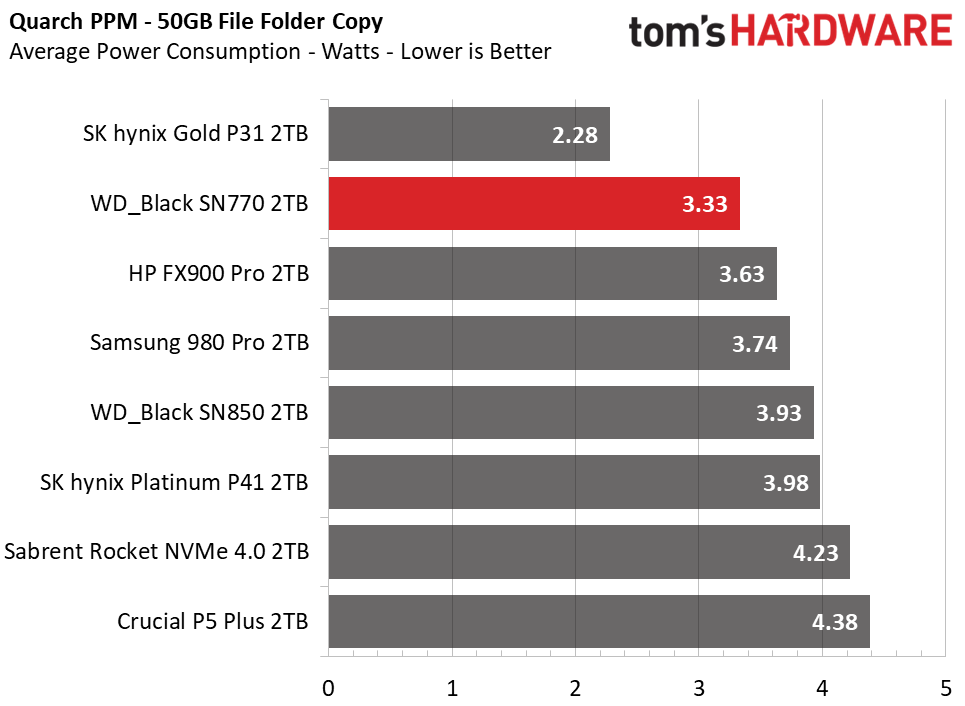
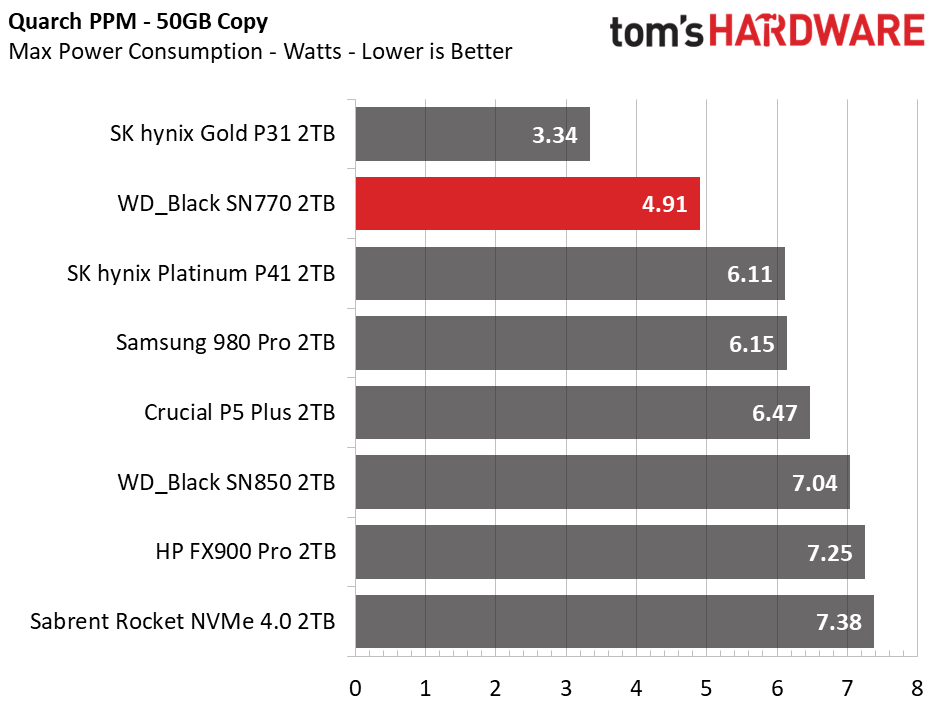
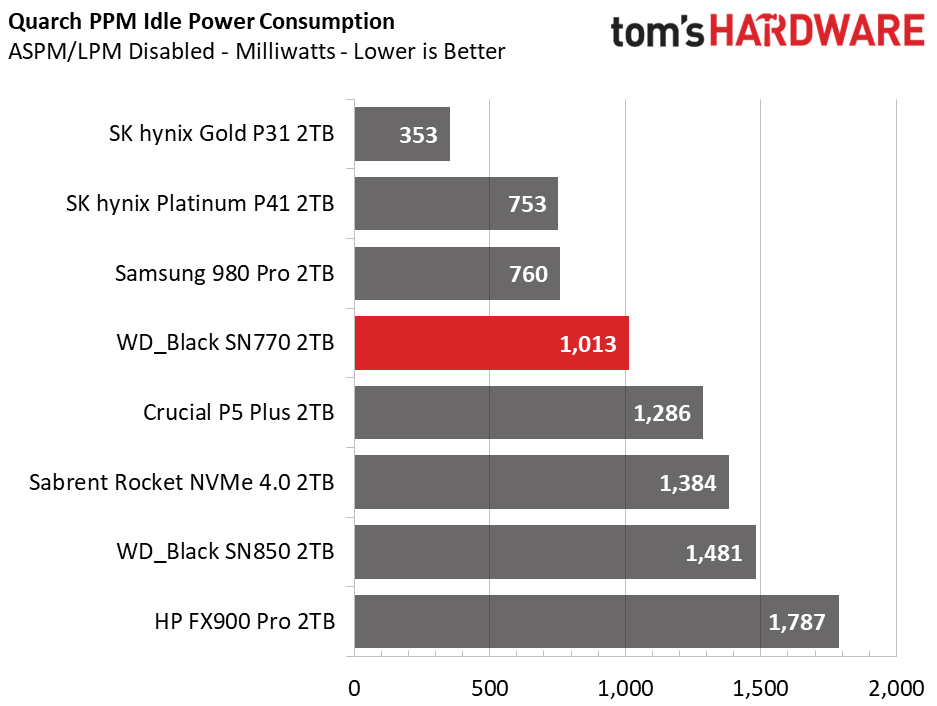
The SN770 has excellent power efficiency, within the range of some of the better drives. It’s far more efficient than the older Rocket NVMe 4.0 and drives of that type. This makes it a compelling choice for laptop users especially, and desktop users, of course, can utilize the Gaming Mode for better responsiveness. It’s also suitable for the PlayStation 5, and the 2TB capacity is a nice amount for that usage.
As for temperature, the drive idled around 52C but hit 80C after sustained writes roughly equal to the size of the SLC cache. These temperatures are similar to the 1TB results. These temperatures should not be a big issue even in the PlayStation 5, as sustained writes with a substantial cache are uncommon.
Test Bench and Testing Notes
CPU | Intel Core i9-11900K |
Motherboard | ASRock Z590 Taichi |
Memory | 2x8GB Kingston HyperX Predator DDR4 5333 |
Graphics | Intel UHD Graphics 750 |
CPU Cooling | Alphacool Eissturm Hurricane Copper 45 3x140mm |
Case | Streacom BC1 Open Benchtable |
Power Supply | Corsair SF750 Platinum |
OS Storage | WD_Black SN850 2TB |
Operating System | Windows 10 Pro 64-bit 20H2 |
We use a Rocket Lake platform with most background applications such as indexing, windows updates, and anti-virus disabled in the OS to reduce run-to-run variability. Each SSD is prefilled to 50% capacity and tested as a secondary device. Unless noted, we use active cooling for all SSDs.
MORE: Best SSDs
MORE: How We Test HDDs And SSDs
MORE: All SSD Content
Current page: 2TB Performance Results
Prev Page Features and Specifications Next Page 1TB Performance Results
Shane Downing is a Freelance Reviewer for Tom’s Hardware US, covering consumer storage hardware.
- Sean WebsterStorage Reviewer
-
Alvar "Miles" Udell If it's supposed to be a gaming SSD...why are there no tests involving games?Reply -
g-unit1111 Western Digital makes good M2 drives. Both of my WD SN750s I've been impressed with.Reply -
Lord_Moonub Please review the ADATA S70 Blade. It is priced lower than this SN770, and delivers higher bandwidth. It is editors choice on several other hardware sites, but remains in the dark here.Reply -
throwapetso I noticed you stopped publishing idle power measurements with ASPM/LPM enabled sometime in 2021 - the SN750 and SN850 still included them, whereas SN750 SE, SN570 and SN770 don't have them anymore. And unfortunately Billy Tallis has stopped writing for Anandtech, so Tom's Hardware is apparently the only outlet that even still cares to measure power consumption for SSDs. (Thank you!)Reply
I find the SN770 extremely compelling in terms of performance and R/W efficiency. But if like its predecessors it sucks a constant Watt of power on idle, when most competitor drives manage to properly sleep to <100 mW even on desktop motherboards, then I'd rather wait until a similar drive from another manufacturer comes around.
Is the SN770 still as bad with ASPM idle power? Also, can you bring the measurements back to future reviews? Pretty please? -
JWNoctis Interesting anecdote: WD SN570 2TB and SN770 2TB had (visually) the exact same board layout and what's presumably the controller. The only visible differences are board colour, the sticker, and one-digit parts number difference on (presumably) the flash module and the PMIC.Reply
Makes you wonder if the real difference is really all in the firmware. -
rumcajs997 Replythrowapetso said:I noticed you stopped publishing idle power measurements with ASPM/LPM enabled sometime in 2021 - the SN750 and SN850 still included them, whereas SN750 SE, SN570 and SN770 don't have them anymore. And unfortunately Billy Tallis has stopped writing for Anandtech, so Tom's Hardware is apparently the only outlet that even still cares to measure power consumption for SSDs. (Thank you!)
I find the SN770 extremely compelling in terms of performance and R/W efficiency. But if like its predecessors it sucks a constant Watt of power on idle, when most competitor drives manage to properly sleep to <100 mW even on desktop motherboards, then I'd rather wait until a similar drive from another manufacturer comes around.
Is the SN770 still as bad with ASPM idle power? Also, can you bring the measurements back to future reviews? Pretty please?
I wonder too what the ASPM power consumption would be. Without that measurement, we don` really know how that drive would behave installed in a laptop. -
NinjAsylum Reply
Because drive speed makes little to zero difference for 99% of gamesAlvar Miles Udell said:If it's supposed to be a gaming SSD...why are there no tests involving games? -
Alvar "Miles" Udell ReplyNinjAsylum said:Because drive speed makes little to zero difference for 99% of games
the subtitle is "Stellar performance, especially for gamers", so there should be some gaming tests involved. There are games which require loading of many files, such as MMOs, and games which require a SSD in their requirements, so those could be used to show the difference, or lack of one, between an SATA, NVMe 3, 4, and 5 drive, if gaming prowess is stated. -
computerdave911 Reply
i have a sn750 and sn770 and looks good on paper but i keep going back to the sn750 as it is much faster booting and loading due to having DRAM cacheAdmin said:The WD Black SN770 uses a DRAM-less design and fast 3D TLC flash to create a responsive and cost-efficient gaming SSD.
WD Black SN770 SSD Review: A Wolf in Sheep's Clothing : Read more
