Cooler Master MasterWatt Maker 1200 PSU Review
Cooler Master finally released its MasterWatt Maker PSU, which was designed for true enthusiasts. Sporting Titanium-class efficiency, a digital interface, and other exotic features, we didn't expect an affordable price. But $450 looks insane!
Why you can trust Tom's Hardware
Cross-Load Tests And Infrared Images
Our cross-load tests are described in detail here.
To generate the following charts, we set our loaders to auto mode through our custom-made software before trying more than 25,000 possible load combinations with the +12V, 5V and 3.3V rails. The load regulation deviations in each of the charts below were calculated by taking the nominal values of the rails (12V, 5V and 3.3V) as point zero.
Load Regulation Charts


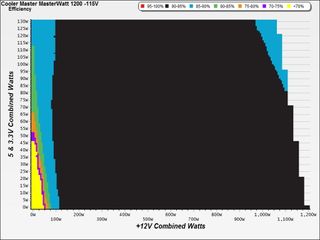
Efficiency Chart

At higher than 120W load, the PSU easily exceeds 90% efficiency (reaching close to 94% in many cases). However, with less than 70W-80W of load, efficiency tanks, especially for a Titanium-class power supply.
Ripple Charts


Infrared Images
Toward the end of the cross-load tests, we took some photos of the PSU with our modified FLIR E4 camera that delivers 320x240 IR resolution (76,800 pixels).


Thanks to its impressive efficiency levels, the temperatures inside of Cooler Master's MasterWatt Maker 1200 are low. High efficiency means less energy losses, which translate to lower thermal loads.
Current page: Cross-Load Tests And Infrared Images
Prev Page Protection Features, Evaluated Next Page Transient Response TestsStay on the Cutting Edge
Join the experts who read Tom's Hardware for the inside track on enthusiast PC tech news — and have for over 25 years. We'll send breaking news and in-depth reviews of CPUs, GPUs, AI, maker hardware and more straight to your inbox.
Aris Mpitziopoulos is a Contributing Editor at Tom's Hardware US, covering PSUs.
-
Onus Shades of the GX line; Coolermaster swings for the fences, but a competitor (pick one) in the outfield snags it and throws this one out trying to stretch a single to second base.Reply -
MasterMace CM doesn't get to put a $450 price tag on something that isn't in the same park. That voltage regulation is disappointing.Reply -
turkey3_scratch A lot of hype and little delivery for that price tag of course. Lower that price down to $200 and then we may be talking. The efficiency under low loads was quite poor. I'd like to bash the 5VSB regulation, though that's going to be unimportant and unrealistic with the majority of consumers, having load changes on that rail. Though if you are charging multiple devices I'd rather have it at 5V than 4.75V.Reply
At least the transient response performance was really good. The PWR_OK signal, eh. Aris, do you think that transient filter is really enough? I have a feeling it would fail EMI testing, only 4 y caps, 4 x caps, and 2 cm chokes on the unit.
Overall, Cooler Master paired with the wrong OEM. -
Aris_Mp the transient filtering stage looks complete since it has more than the required X caps, however you can never know unless you actually test it. I have the equipment and knowledge but I lack the time to do it :)Reply -
turkey3_scratch What are the exact requirements? I know what the ATX spec says but you have units like the FSP Hydro G 750 that failed by a good margin with 4 y caps, 2 x caps, and 2 cm chokes. So when talking about a 1200W unit with 4 y caps, 4 x caps, and 2 cm chokes, those 2 extra x caps are enough to do the trick?Reply -
Nuckles_56 The performance per dollar chart was great, it showed how badly overpriced this unit is and that there is a lot which could be improved on for the money spent on the unitReply -
Andi lim It's seem like the solid polymer caps on front side modular PCB's not from Nichicon, I think it belongs to Unicon taiwan ( UPT series ).Reply -
jimmysmitty Reply18352433 said:CM doesn't get to put a $450 price tag on something that isn't in the same park. That voltage regulation is disappointing.
Sadly it is more than the AX1500i, lower efficiency and specs overall and a lower warranty (7 year vs 10 year).
If someone is going to spend that much on a PSU It would be better to go for the Corsair.