Why you can trust Tom's Hardware
This round of testing comes with a lot of caveats: We aren't entirely sure that the clock frequencies and temperatures we've collected are accurate. In fact, common utilities like AIDA and HWinfo didn't expose much useful information when we first received the system. As seen in one of the screenshots below, AIDA initially identified the system as the AMD "K17.4 PS5/XBox Scarlett APU."
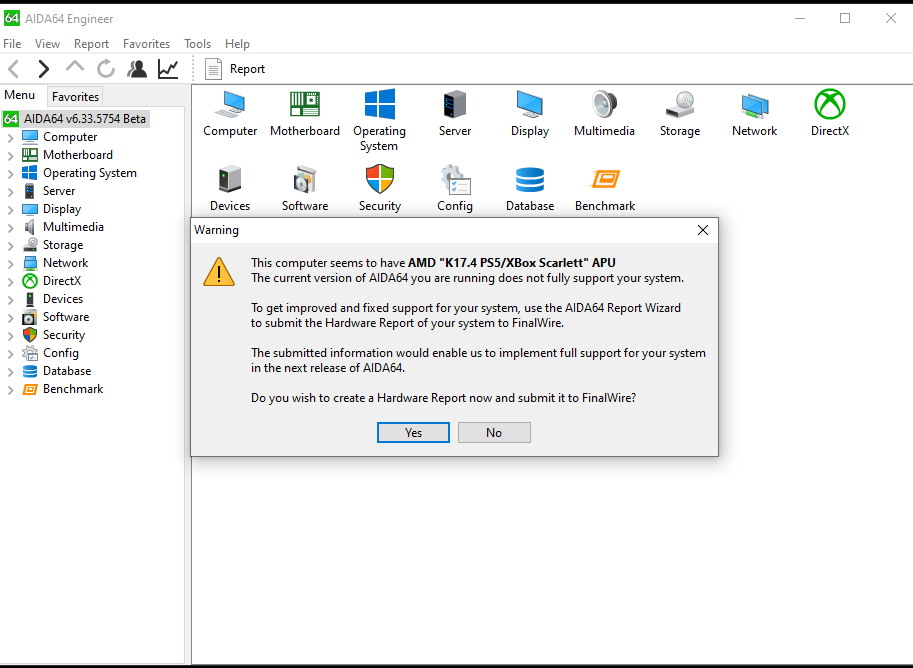
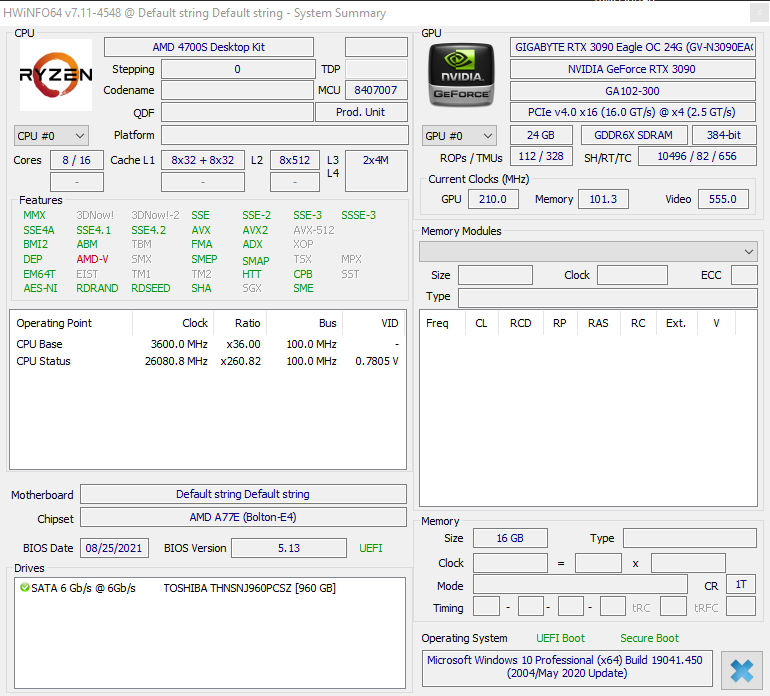
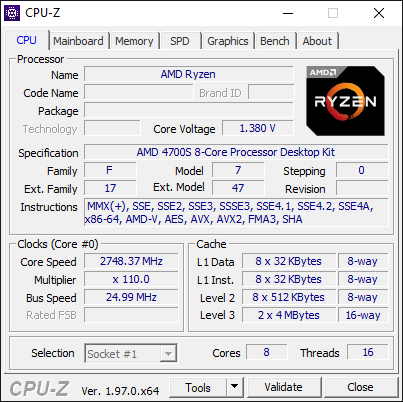
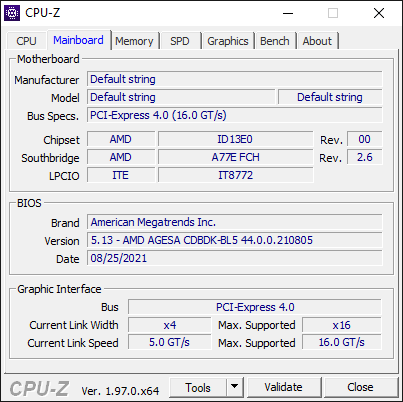
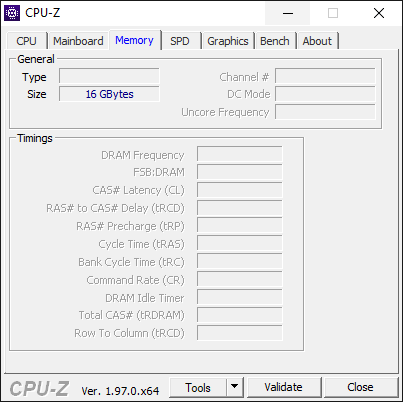
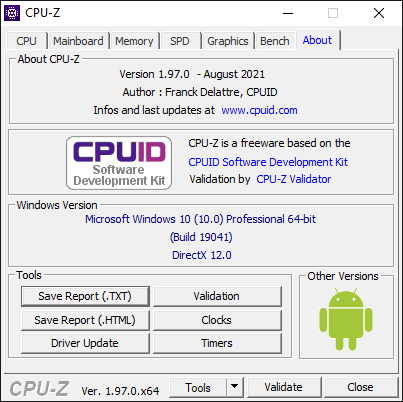
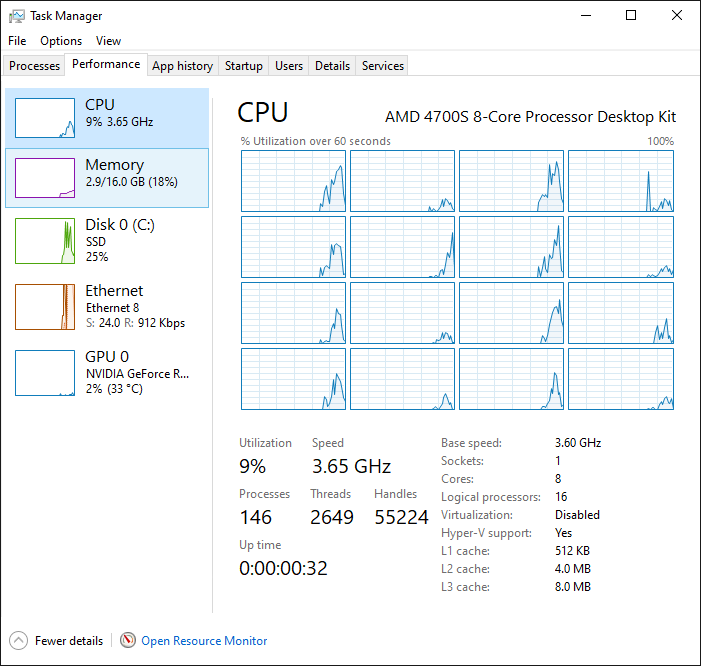
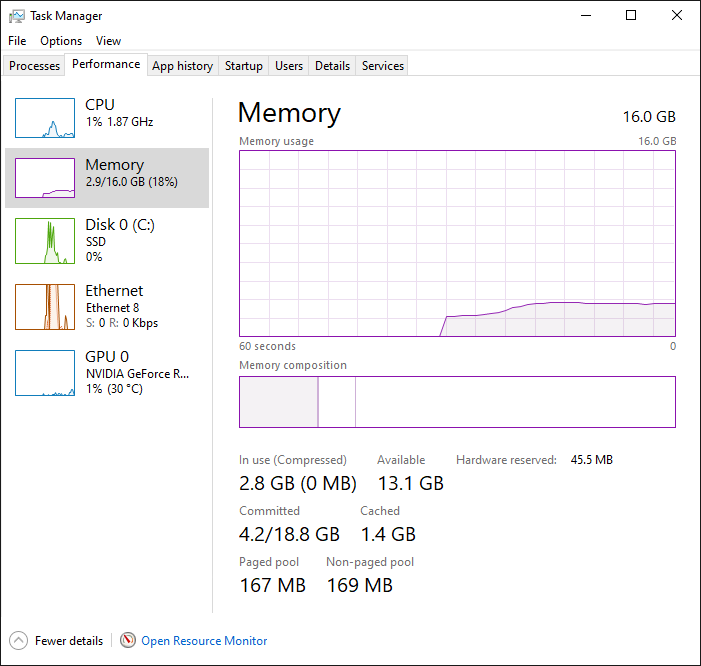
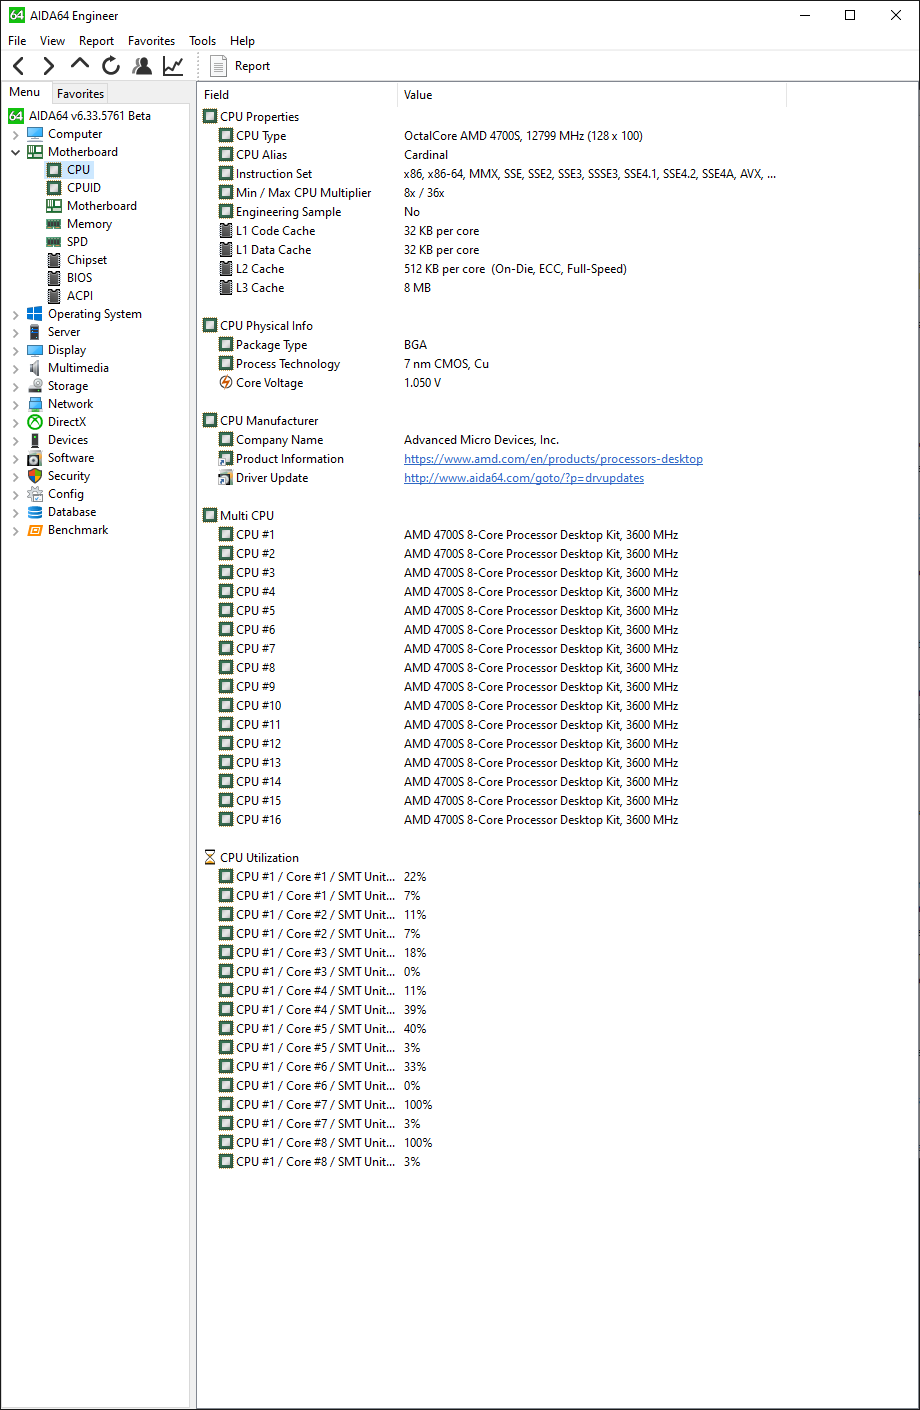
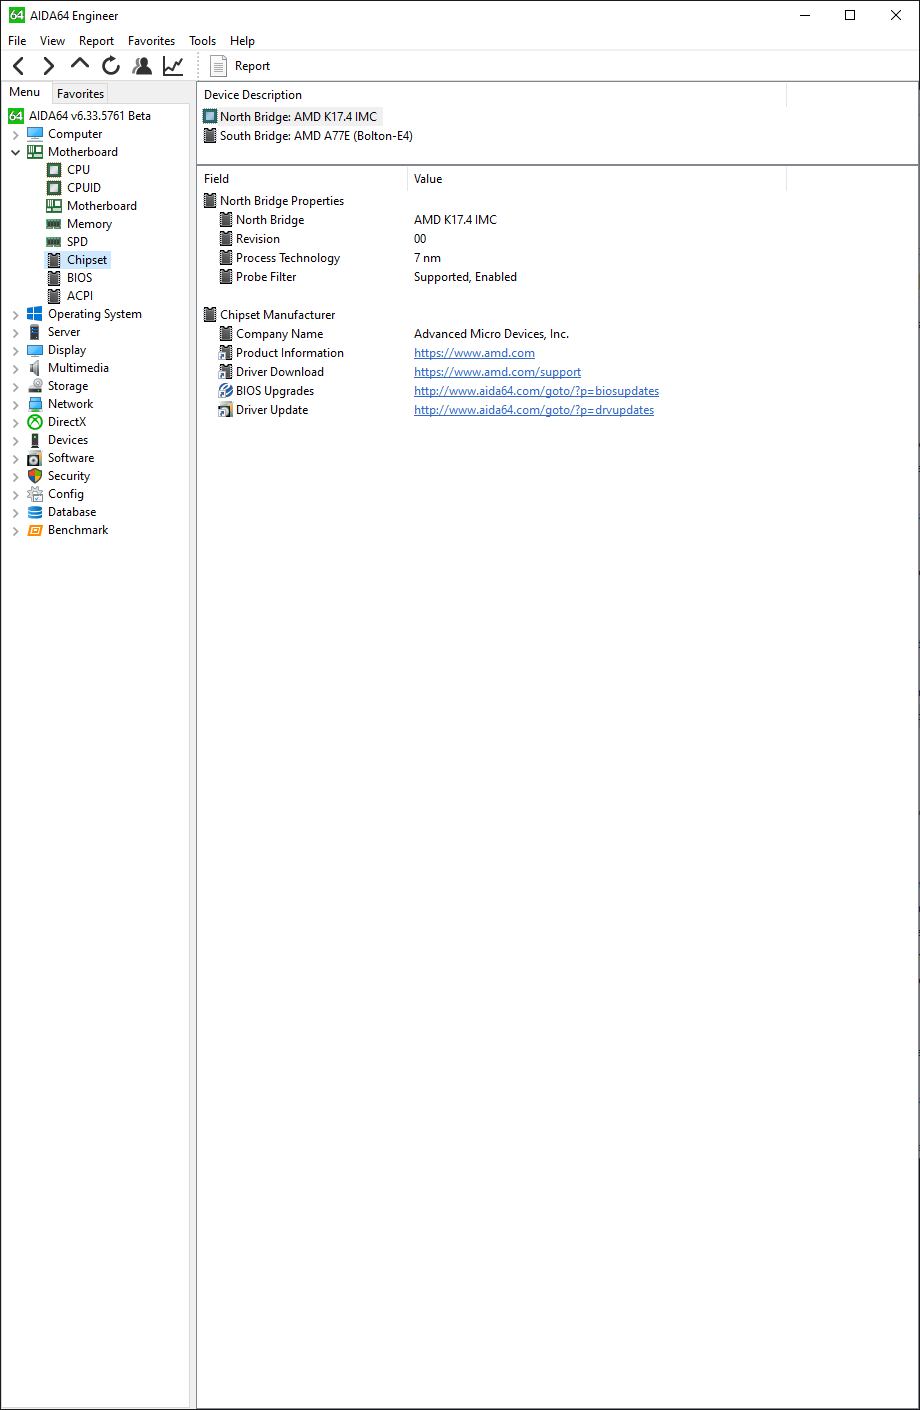
We followed up with FinalWire (Aida) and REALiX (HWinfo) and submitted debug reports to help them correctly enumerate the various sensors and telemetry data, but with only limited success. Both vendors released updates that improved the situation, but some of the parameters still can't be logged, and some logged variables could be subject to inaccuracies. We followed up with multiple other ISVs, and it doesn't appear that AMD has shared the technical information that enables monitoring that it normally does, despite these chips being on the market for several months.
AMD has confirmed to Tom's Hardware that third-party monitoring tools, and its own Ryzen Master, won't work correctly with the system. We're not sure when, or if, that will be resolved.
As a result, the clock frequencies reported by the chip are still inaccurate (we often see spikes to 12 GHz), so we're forced to resort to plotting the effective clock rates instead of the values reported by the chip. Our numbers should be close to the correct clock speeds, but there is room for some inaccuracy.
AMD says that it is possible for the 4700S to exceed 100C for brief periods, but only as the chip throttles to return to sub-100C operation. However, we've recorded extended periods (several minutes) of 103C+, with peaks at 104.5C. AMD also says the sensors don't use an offset. The extended 100C+ periods do raise some questions about either the accuracy of the temperature output or the efficacy of the chip's internal throttling mechanisms. Considering the frequency throttling we'll show in the tests below, it could be a bit of both.
As such, take the frequency and temperature measurements with some salt. The system also doesn't report accurate power consumption telemetry, so we've turned to our in-line PSU tester to measure power consumption at the 8-pin EPS12V and the 24-pin motherboard connectors.
Typically the EPS12V connector supplies the lion's share of power to a desktop PC processor, while a small amount (a few watts) will feed through the 24-pin connector. That means we can simply intercept power at the EPS12V input for measurements.
However, our 4700S measurements reveal that less power comes across the 8-pin than 'normal,' suggesting that the power is distributed in a non-standard way. That makes accurate physical power measurements for just the chip impossible (at least with our equipment). As such, we include the full board power (8-pin + 24-pin), including the chipset and GDDR6 power draw, in the measurements below.
Physical power measurements can involve a bit of fuzzy math, as VRM inefficiencies can create deltas between the power delivered to the VRMs and the power fed to the processor. These deltas vary based on the components in each motherboard's power delivery subsystem (typically ~10% to ~15%). Unfortunately, that means that we can't compare our 4700S power measurements to the other processors in our library of results, as the latter is for chip power only and isn't influenced by VRM inefficiencies.
The 4700S BIOS is spartan with only one configurable parameter that can impact performance — you can only enable/disable Cool and Quiet (we disabled the feature for maximum performance). The BIOS also doesn't allow clock rate adjustments, making it impossible to test IPC with a locked frequency. Combined with the fact that we can't log accurate clock rates, it's hard to generate precise IPC measurements at this time. Testing from @aschilling suggests that IPC is largely identical to other Zen 2 chips, with a notable distinction that, as a result of customizations, the chip has two FPU ports instead of four. That impacts performance in floating point and vectorized operations, some of which could be offset through the increased throughput from GDDR6. We'll see the impact of that design decision in our application test suite.
Well, that's a lot of caveats. Here's what we came up with.
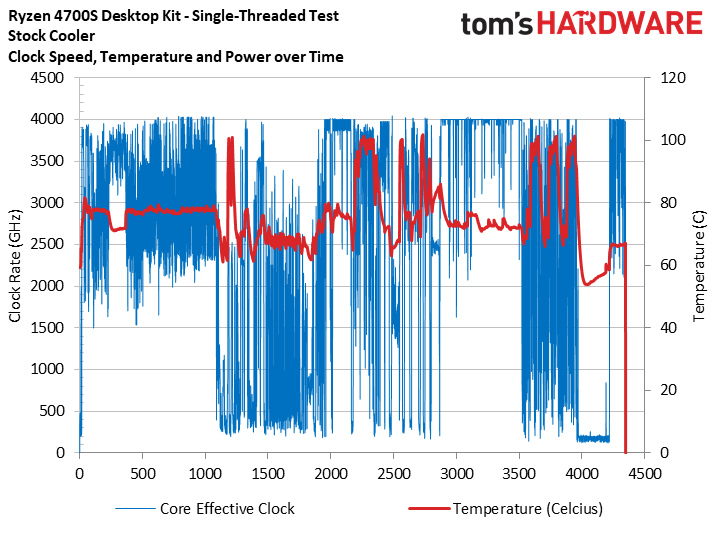
As per our normal routine, we put AMD's boost clocks to the test in both single- and multi-threaded workloads (methodology here). The lightly-threaded test regimen is designed to extract the highest boost clock rates possible as we step through ten iterations of the LAME encoder, then single-threaded POV-Ray and Cinebench runs, PCMark 10, and GeekBench.
To keep the charts 'clean,' we only plot the maximum frequency recorded on any one core during the test to determine the peak clock rates. Here we can see that the chip boosts to 4.0 GHz during lightly-threaded work.
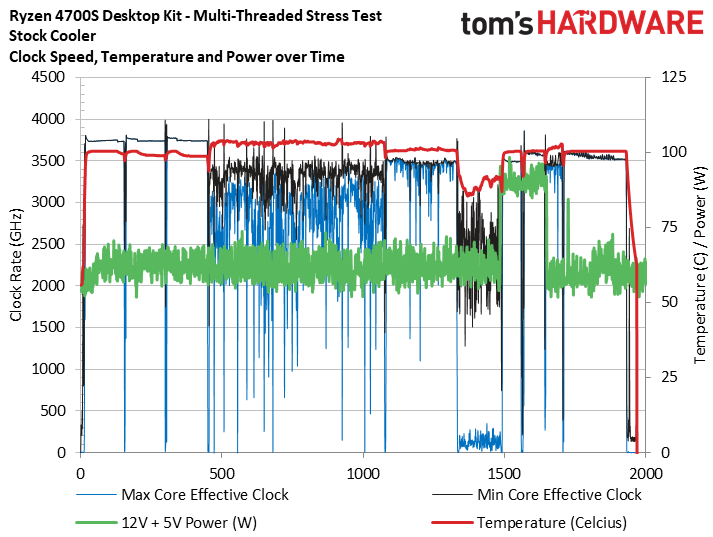
We also ran our standard thermal and power testing with intense multi-threaded applications, like AVX-powered Blender and HandBrake distributions, and plotted both minimum and maximum frequencies.
This series of tests runs the Corona ray-tracing benchmark, several HandBrake runs, POV-Ray, Cinebench R20, and four different Blender renders. All of these tests make an appearance in our standard test suite and represent real-world usages.
Get Tom's Hardware's best news and in-depth reviews, straight to your inbox.
We recorded a peak of 104.5C during the tests, with extended periods of 103C that resulted in clock rates of ~3.4 GHz and lower. Notably, these regressions and periods of overheating occurred during AVX-heavy workloads, with the multi-threaded y-cruncher test resulting in sub-2.5 GHz clock rates.
The overheating and throttling persisted even after we applied our own thermal paste (MX-4) and remounted the cooler. Power consumption peaked at 98W, but we recorded an average of 64W during the extended tests. Remember, we measured the total board power and VRM inefficiencies also have an impact on these readings.
| AMD Socket AM4 | AMD 47000S Desktop Kit |
| Row 1 - Cell 0 | AMD Ryzen 47000S Desktop Kit |
| Row 2 - Cell 0 | 8 x2GB Sk Hynix GDDR6, 256-bit (16x16) |
| AMD Socket AM4 | Ryzen 7 5700G, Ryzen 5 5600G, Ryzen 3 5300G, 4750G, 3400G |
| Row 4 - Cell 0 | ASUS ROG Strix B550-E |
| Row 5 - Cell 0 | 2x 8GB Trident Z Royal DDR4-3600 @ 3200, Kingston DDR4-3200 |
| Intel Socket 1200 (Z590) | Core i5-11400, Core i3-10100 |
| Row 7 - Cell 0 | ASUS Maximus XIII Hero |
| Row 8 - Cell 0 | 2x 8GB Trident Z Royal DDR4-3600 - 10th-Gen: Stock: DDR4-2933, OC: DDR4-4000, 11th-Gen varies, outlined above (Gear 1) |
| AMD Socket AM4 (X570) | AMD Ryzen 7 5800X, Ryzen 5 5600X, Ryzen 7 3800X |
| MSI MEG X570 Godlike | |
| Row 11 - Cell 0 | 2x 8GB Trident Z Royal DDR4-3600 - Stock: DDR4-3200, OC: DDR4-4000, DDR4-3600 |
| All Systems | Gigabyte GeForce RTX 3090 Eagle - Gaming and ProViz applications |
| Row 13 - Cell 0 | Nvidia GeForce RTX 2080 Ti FE - Application tests |
| 2TB Intel DC4510 SSD | |
| EVGA Supernova 1600 T2, 1600W | |
| Row 16 - Cell 0 | Open Benchtable |
| Windows 10 Pro version 2004 (build 19041.450) | |
| Cooling | Corsair H115i, Custom loop |
- MORE: Best CPUs for Gaming
- MORE: CPU Benchmark Hierarchy
- MORE: AMD vs Intel
- MORE: All CPUs Content
Current page: AMD 4700S Desktop Kit Test Setup, Boost Clocks, Thermals, Power
Prev Page Inside the AMD Ryzen 4700S Desktop Kit System Next Page AMD 4700S Cache and Memory Latency Benchmarks
Paul Alcorn is the Editor-in-Chief for Tom's Hardware US. He also writes news and reviews on CPUs, storage, and enterprise hardware.