Why you can trust Tom's Hardware
Ryzen 7 5800X Gaming Performance — The TLDR
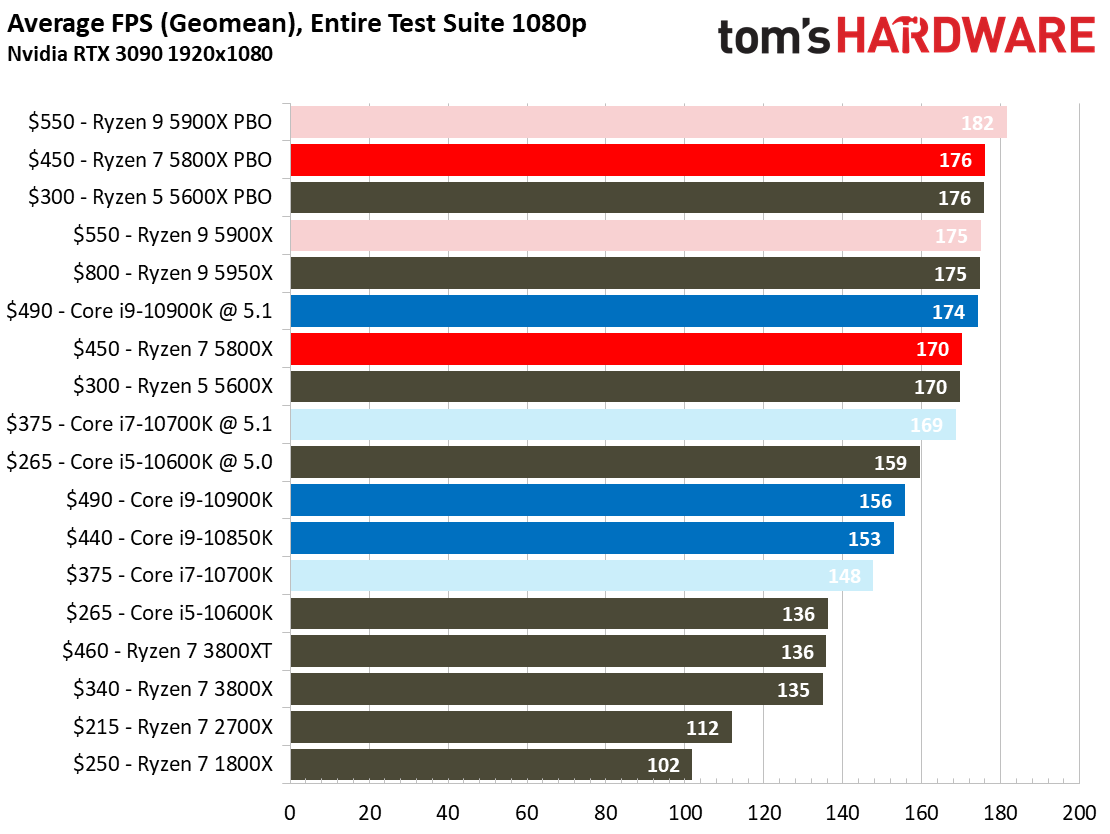
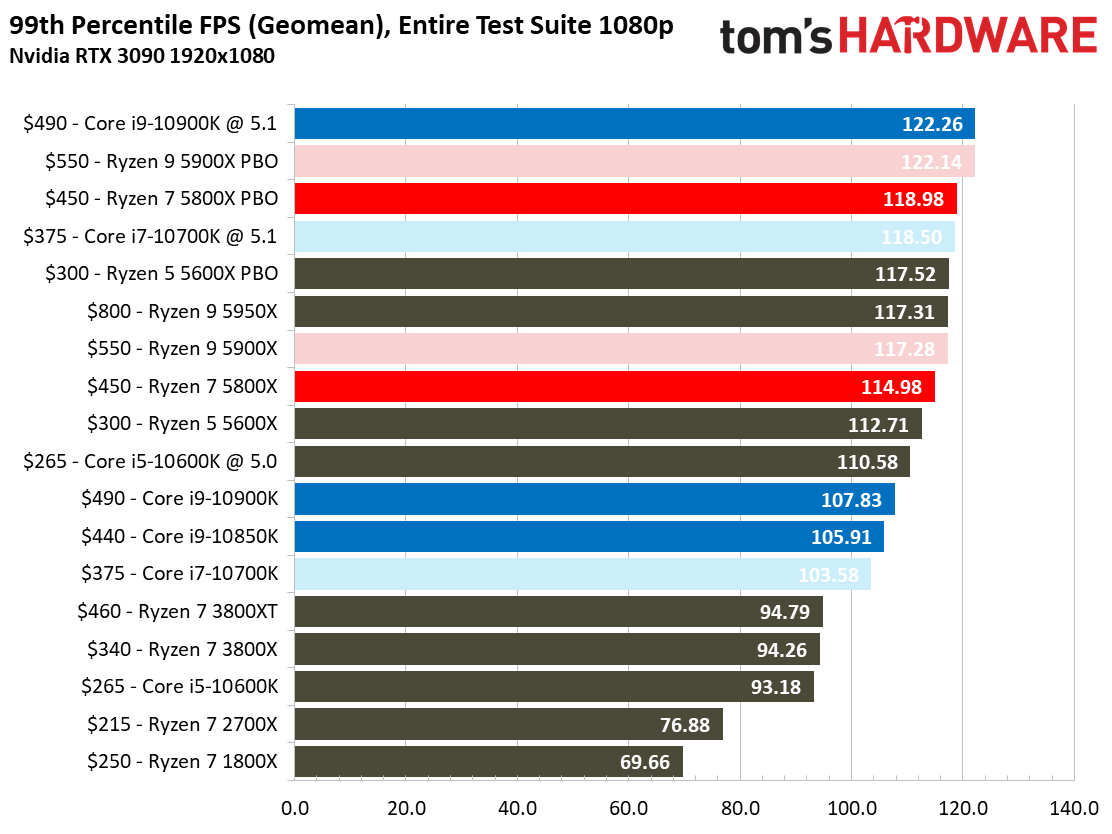
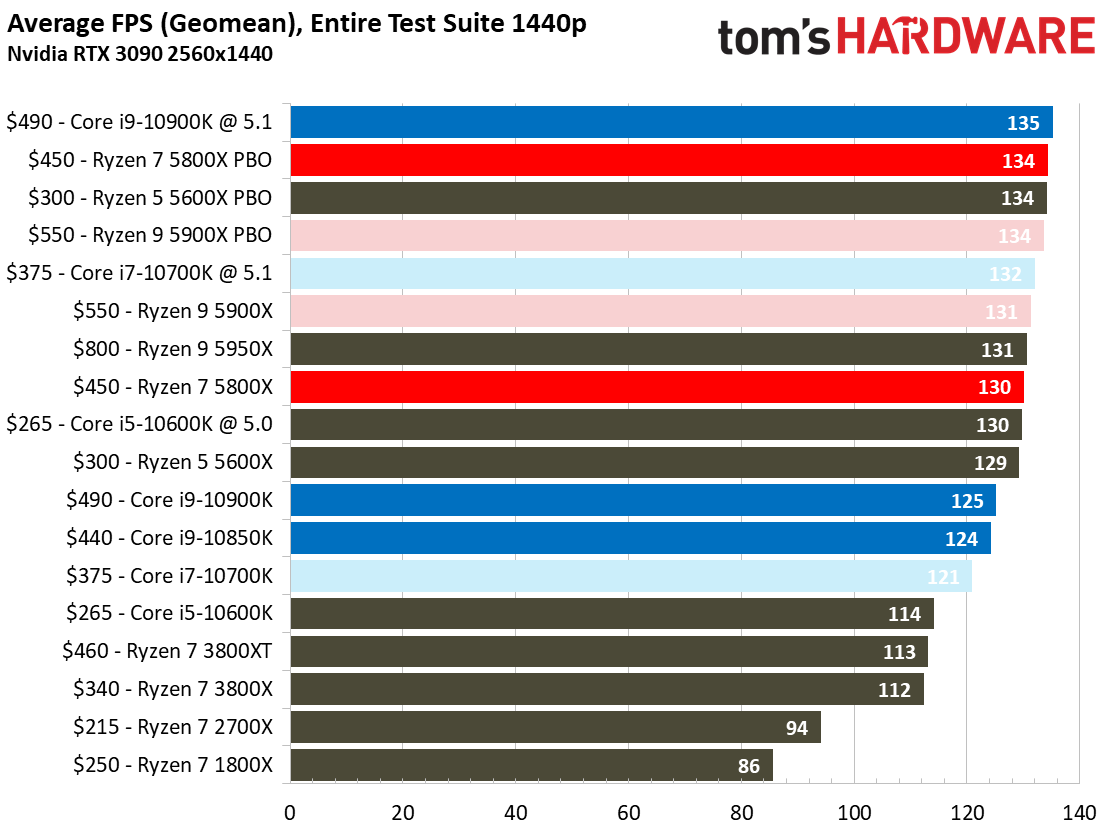
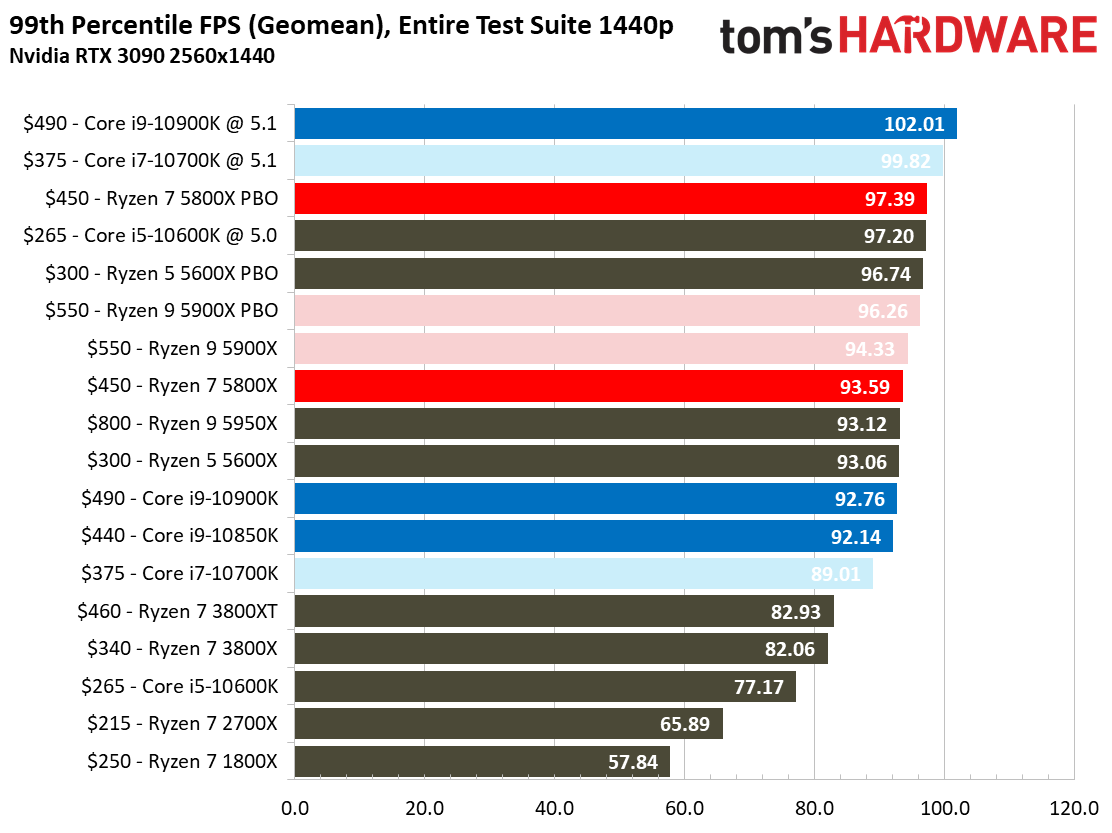
Here you can see the geometric mean of our gaming tests at 1080p and 1440p, with each resolution split into its own chart. We tested with an Nvidia GeForce RTX 3090 to reduce the impact of graphics-imposed bottlenecks. Be aware that these deltas will shrink with either higher resolutions or lesser GPUs.
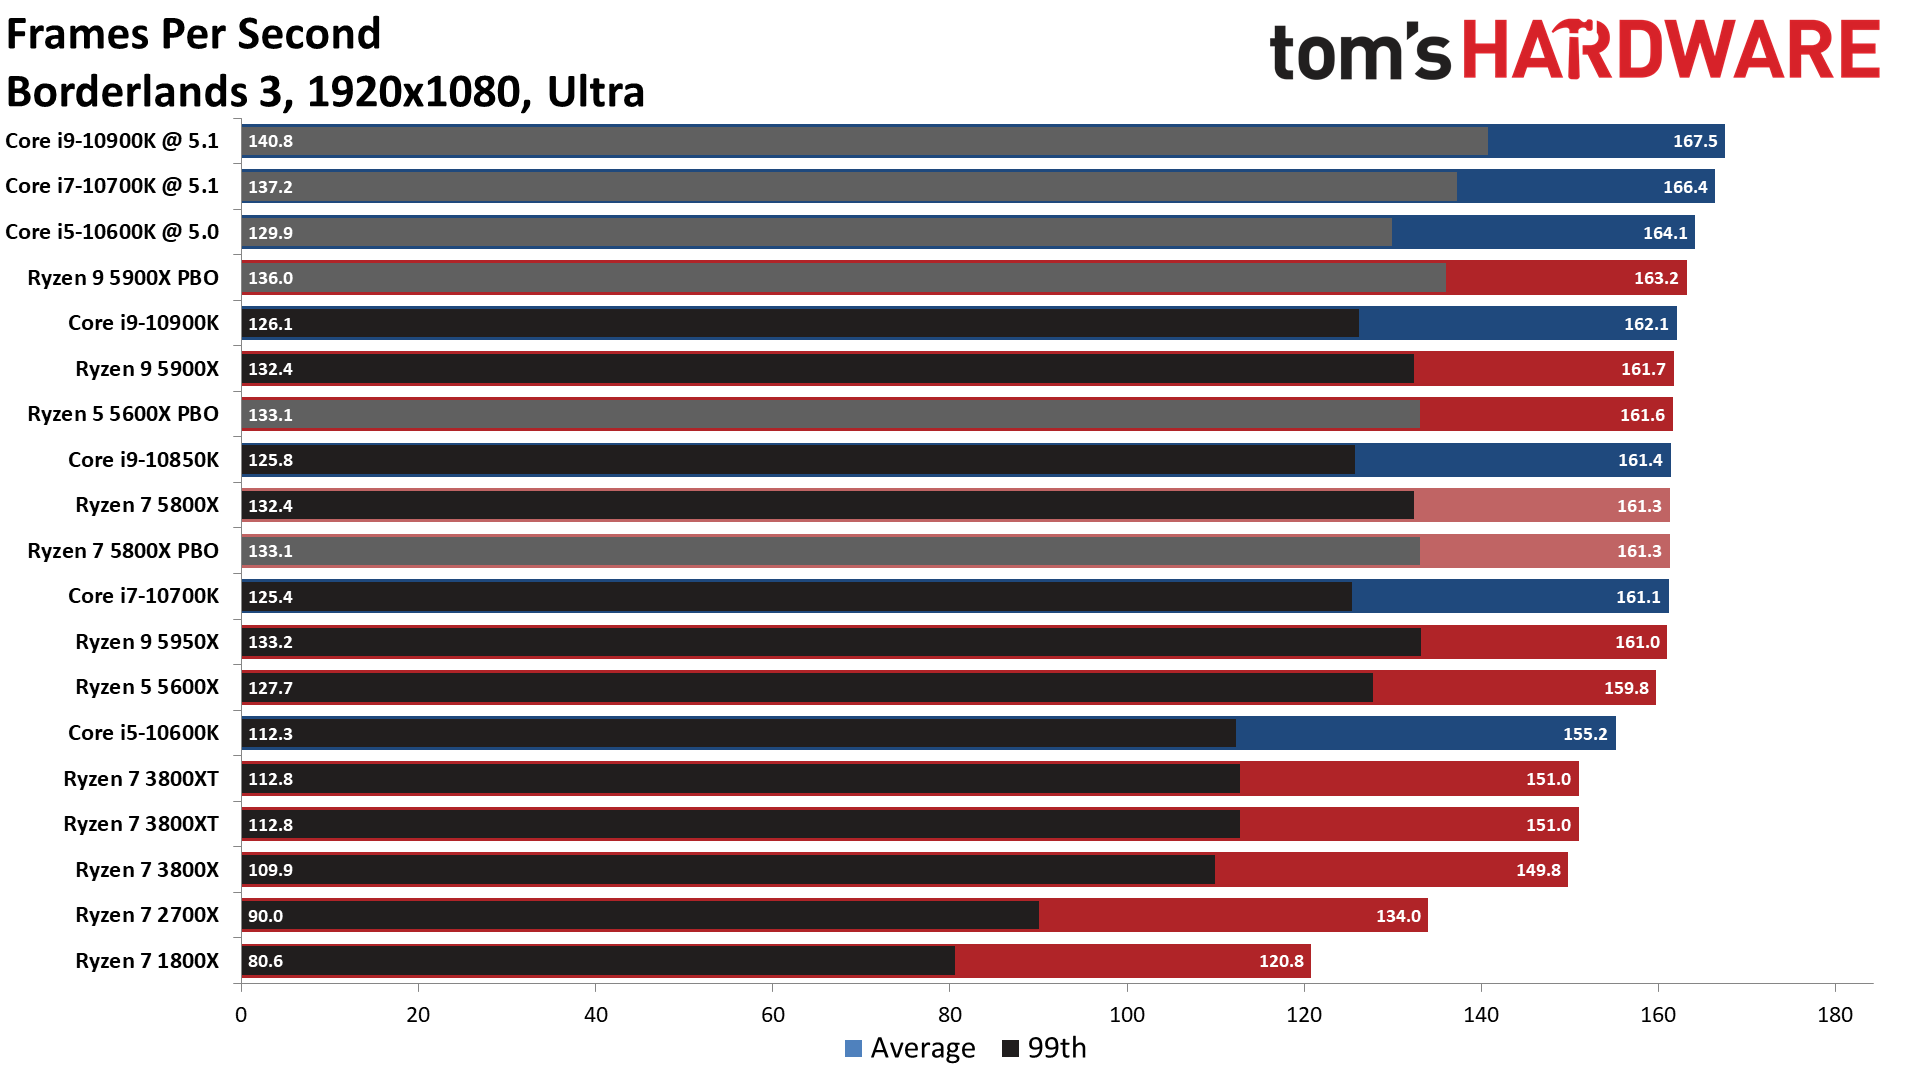
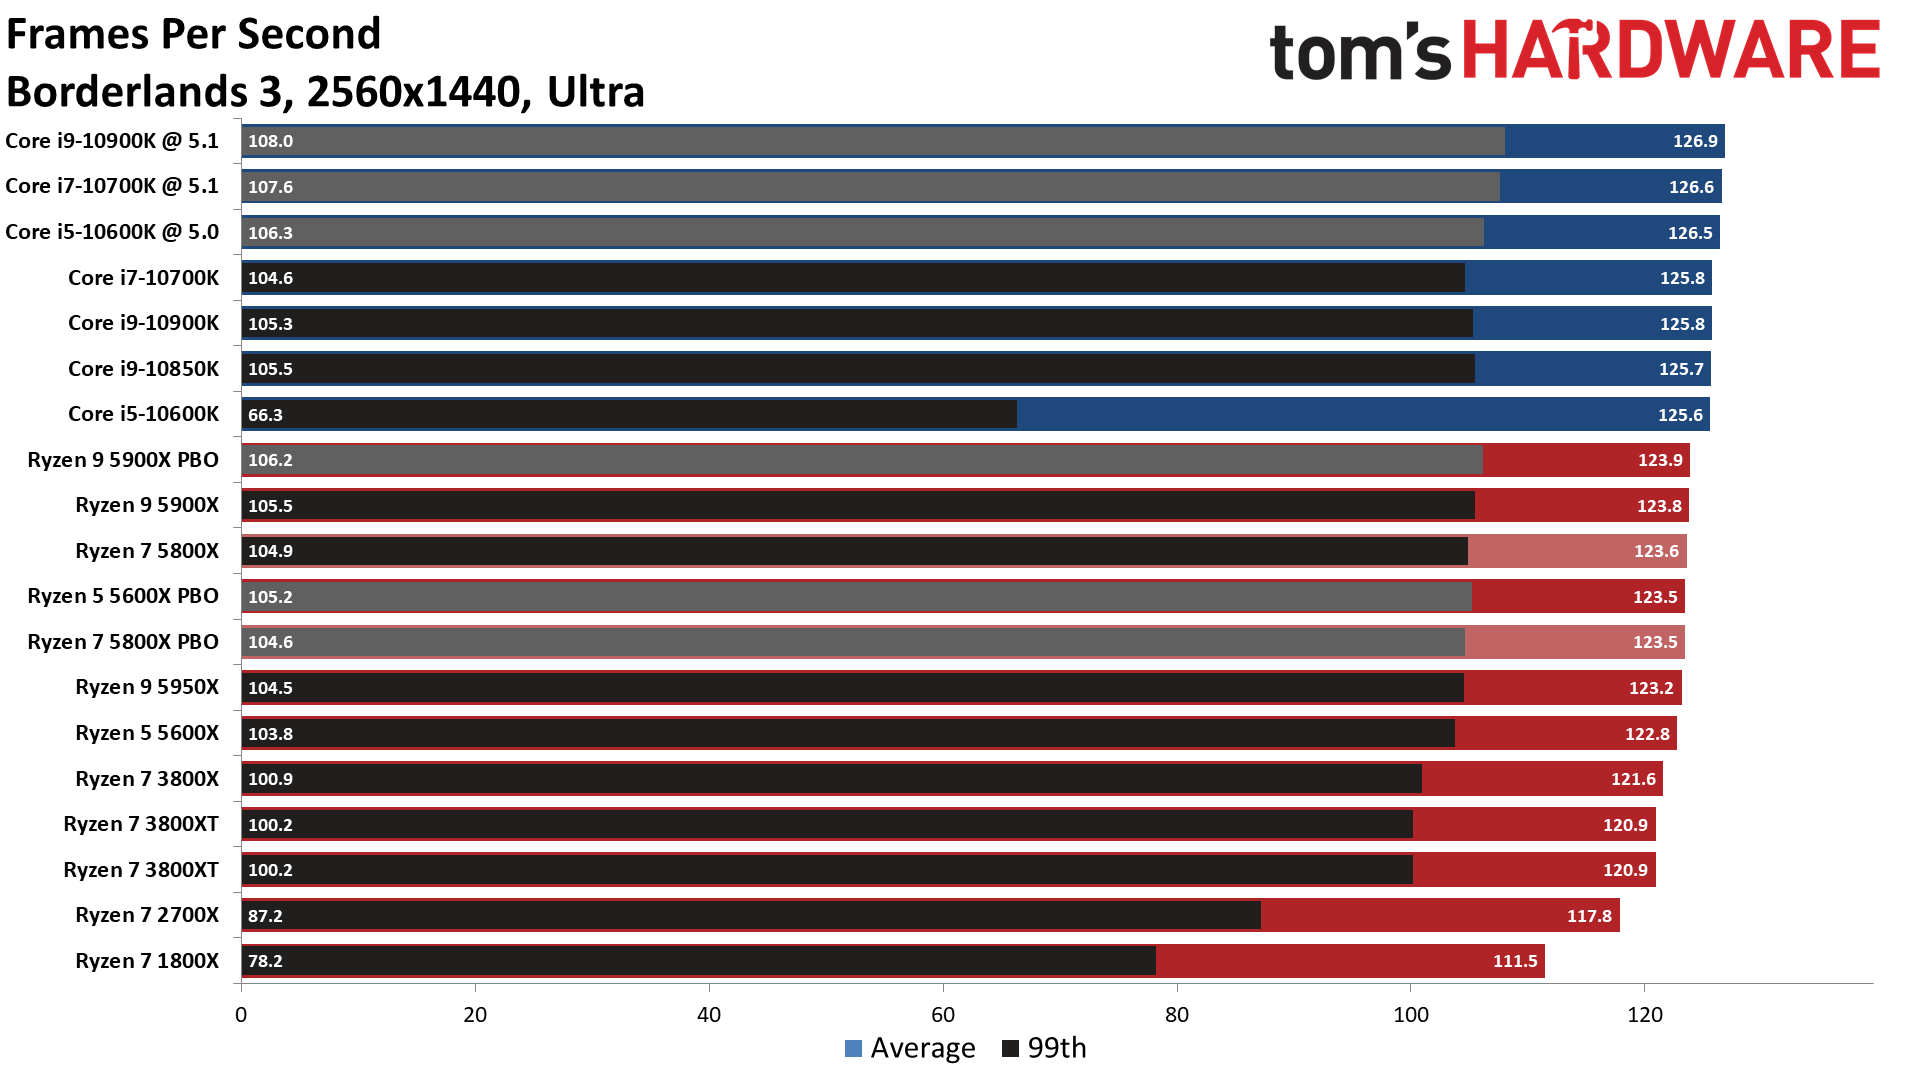
The Ryzen 7 5800X and the Ryzen 5 5600X essentially tie in our overall measure of 1080p gaming performance at both stock and overclocked settings. Although the 5800X does post slightly better 99th percentile framerates, the deltas aren't significant enough to alter the purchasing decision. We see a similar trend in our 1440p results, making the decision easy if you're only interested in gaming - the Ryzen 5 5600X, our current top pick in our list of Best CPUs for Gaming, is the chip to get. In a nutshell, there's no meaningful difference between these two chips in gaming.
Turning to Intel, the $375 Core i7-10700K is $75 (20%) cheaper than the 5800X and trails in 1080p gaming by 15%, and 7% at 1440p. The 5800X also offers better 99th percentile frame rates. Given the Ryzen 5 5600X's low price point, that doesn't really leave the 10700K much room to operate for gaming-focused rigs. Go with the Ryzen 5 5600X if you're looking for a cheaper chip than the 5800X for gaming, specifically.
The Core i9-10900K is $40 more expensive than the 5800X, but it also trails in average frame rates in gaming, even after tuning both processors. The overclocked 10900K does squeeze out 3% and 5% higher 99th percentile frame rates in 1080p and 1440p gaming, respectively. Still, it's important to note that overclocking raises platform costs in the form of beefier cooling requirements, and for most enthusiasts, these small gains in 99th percentile frame rates aren't worth the extra cost. Given the price delta associated with the 10900K, it isn't a better value for gaming than the Ryzen 7 5800X.
However, the Core i9-10850K offers nearly the same performance as the 10900K in gaming, and is $10 cheaper than the 5800X. The 10850K is compelling due to its overclockability. Once tuned, we've found that it offers the same performance as the 10900K at 5.1 GHz, which we use as a stand-in for the overclocked 10850K because gaming performance is virtually identical. At stock settings, the 10850K isn't quite as competitive against the Ryzen 7 5800X as the 10900K. The 10850K lags the 5800X by 11% in 1080p gaming and 5% at 1440p, which doesn't make a compelling case for choosing it over the 5800X, either, unless you're dead set on building an Intel-powered gaming rig or need integrated graphics, of course.
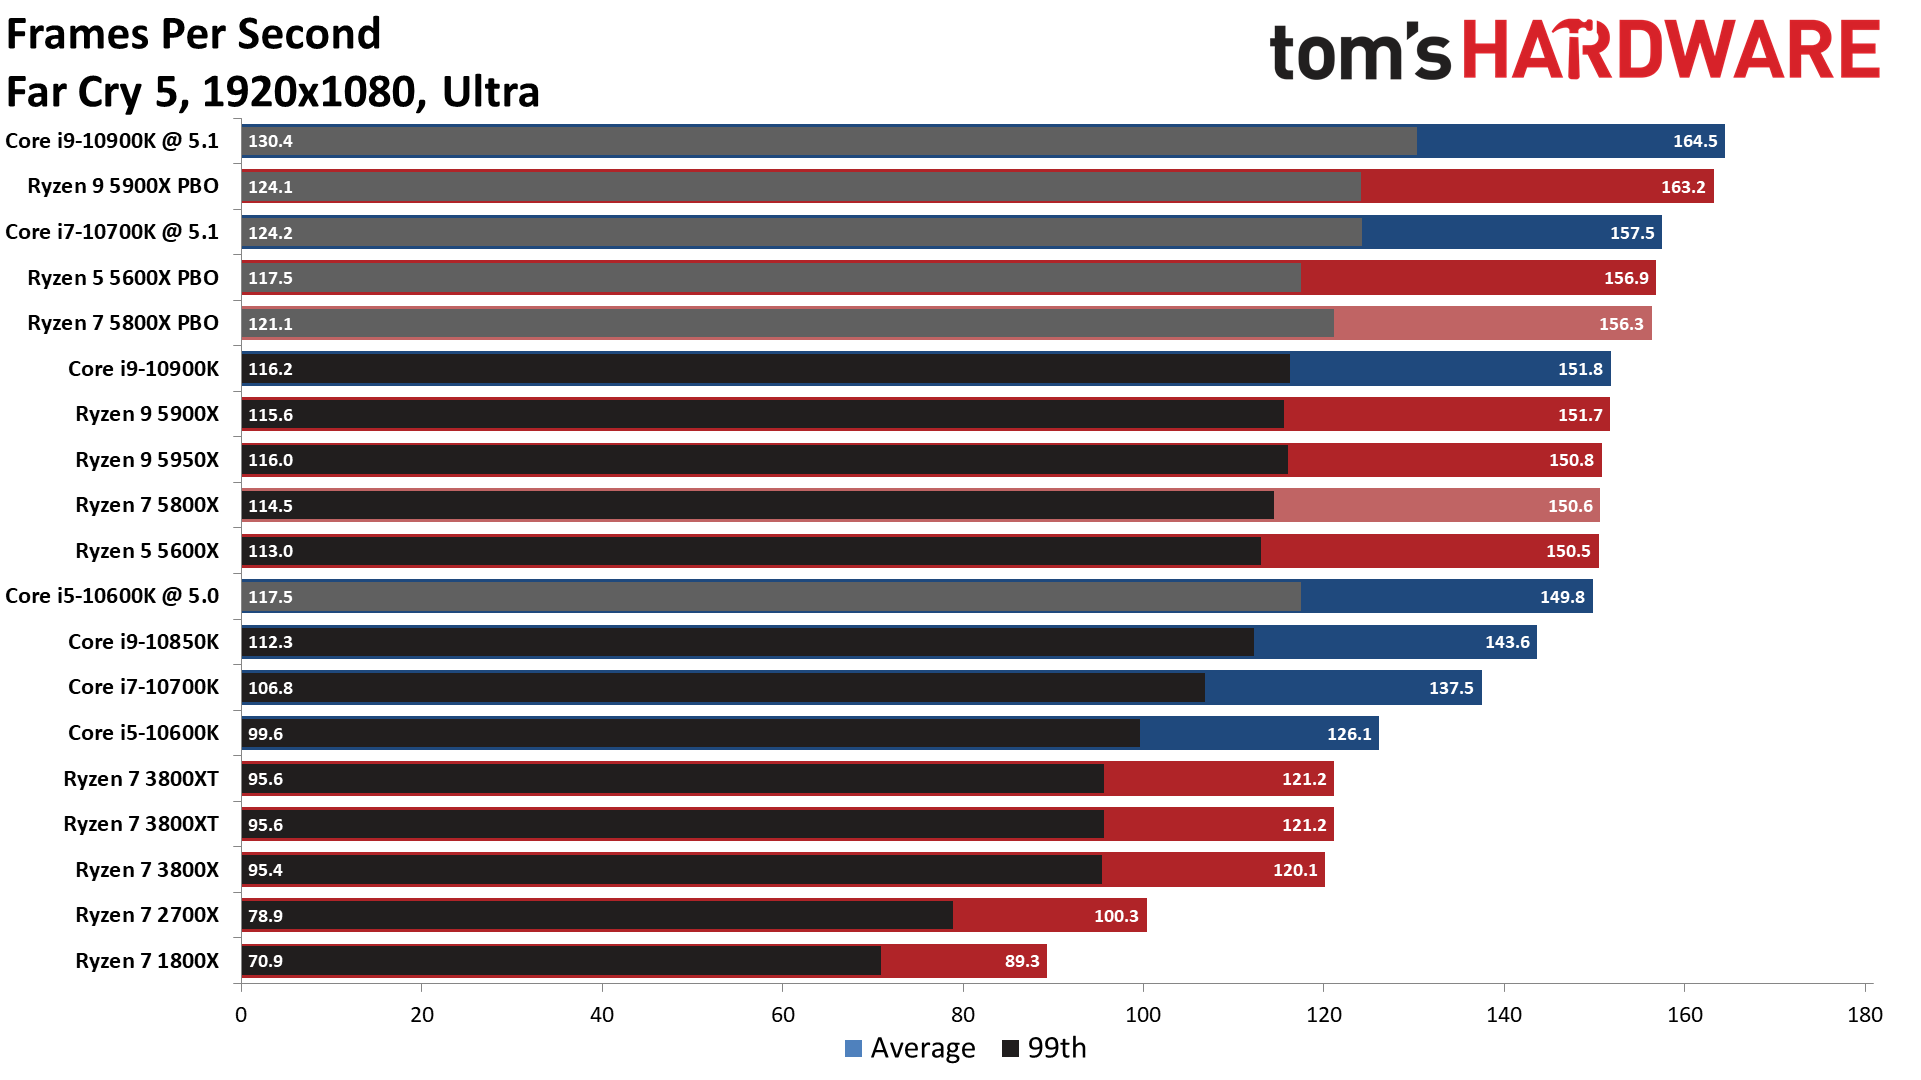
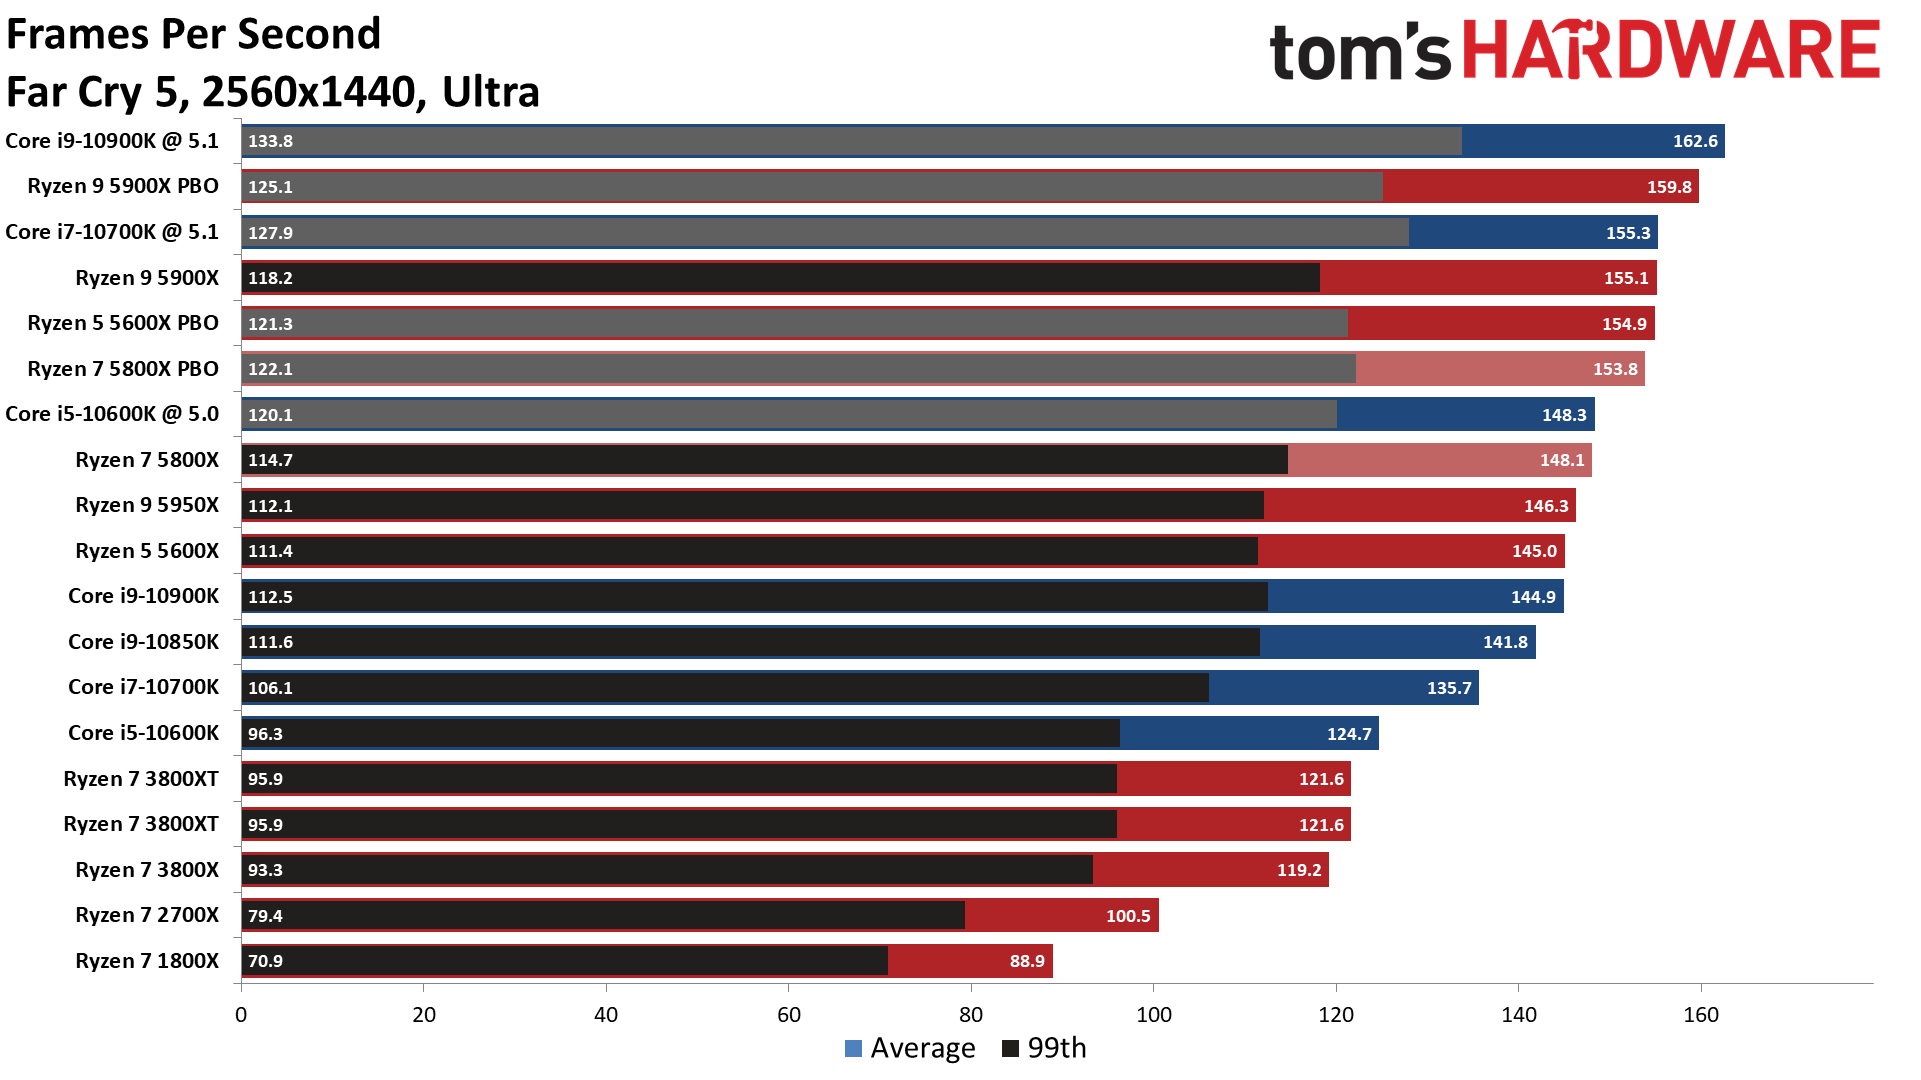
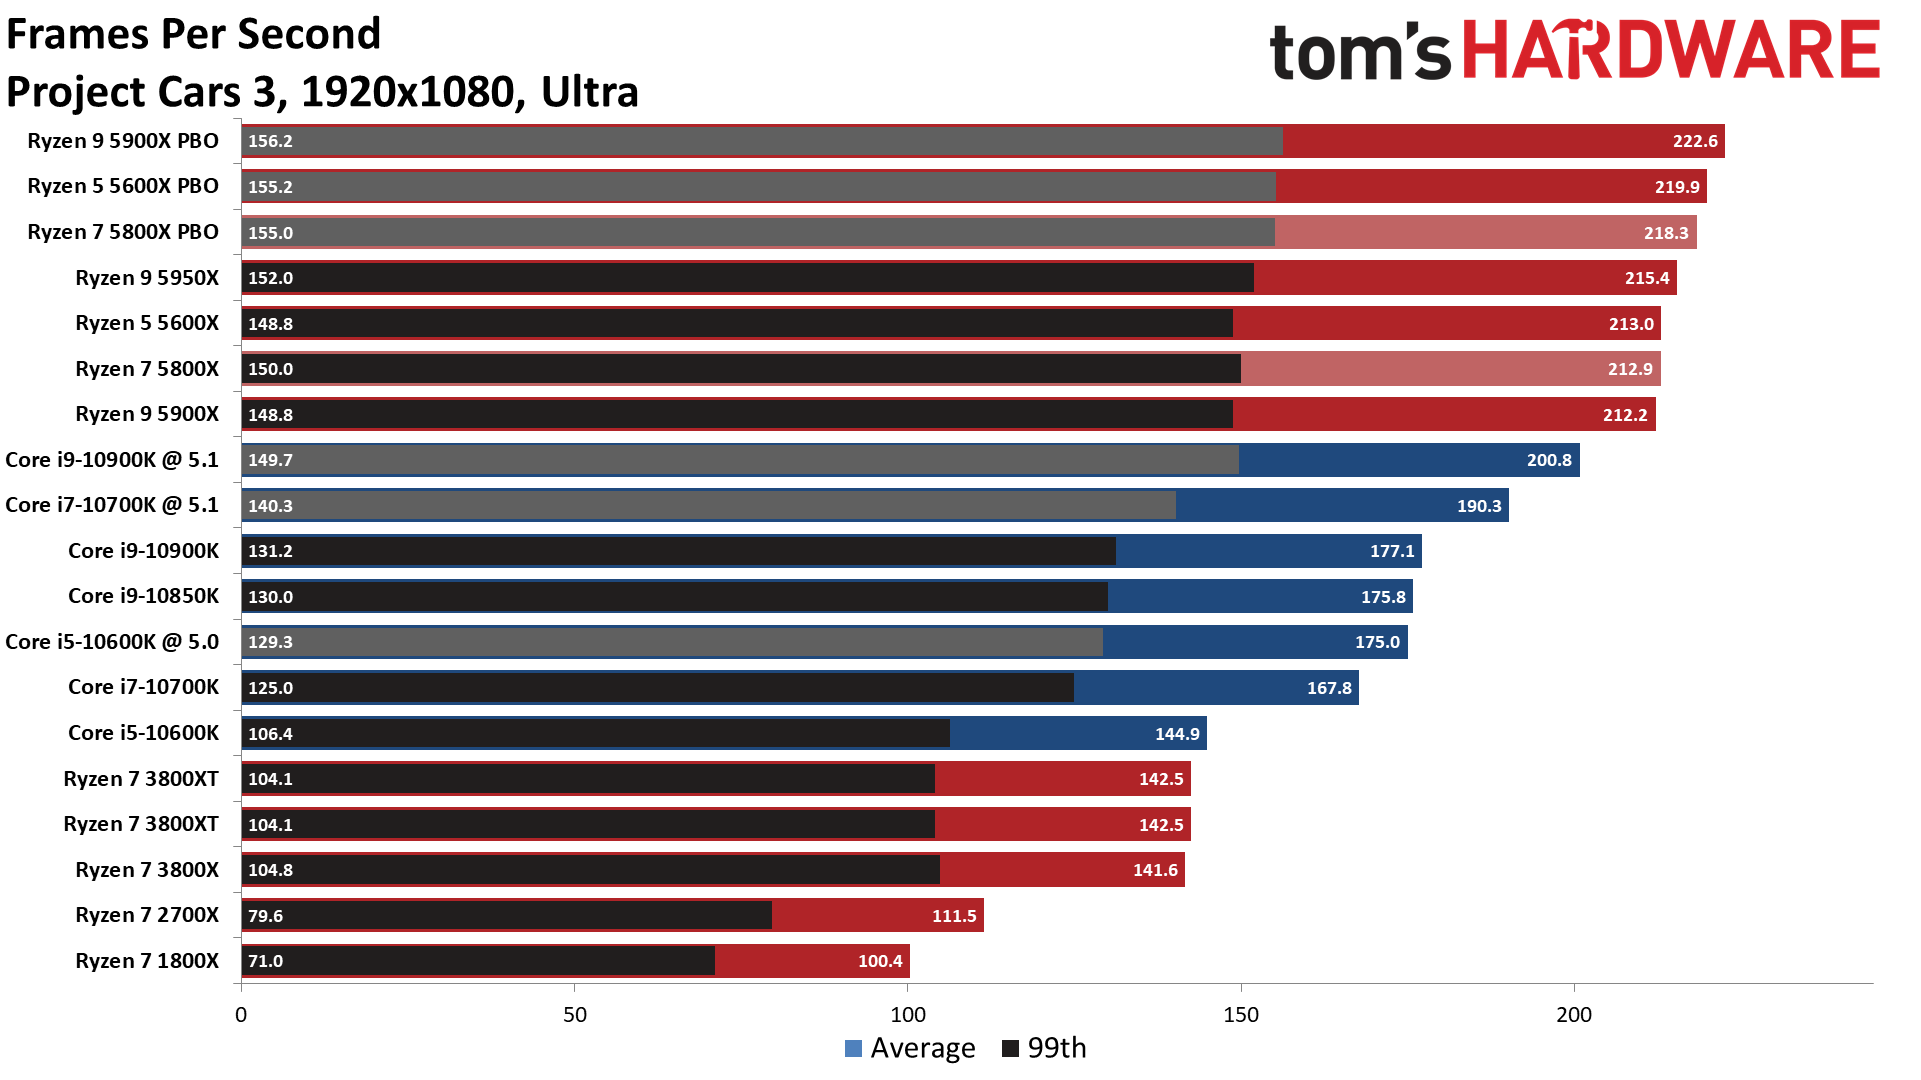
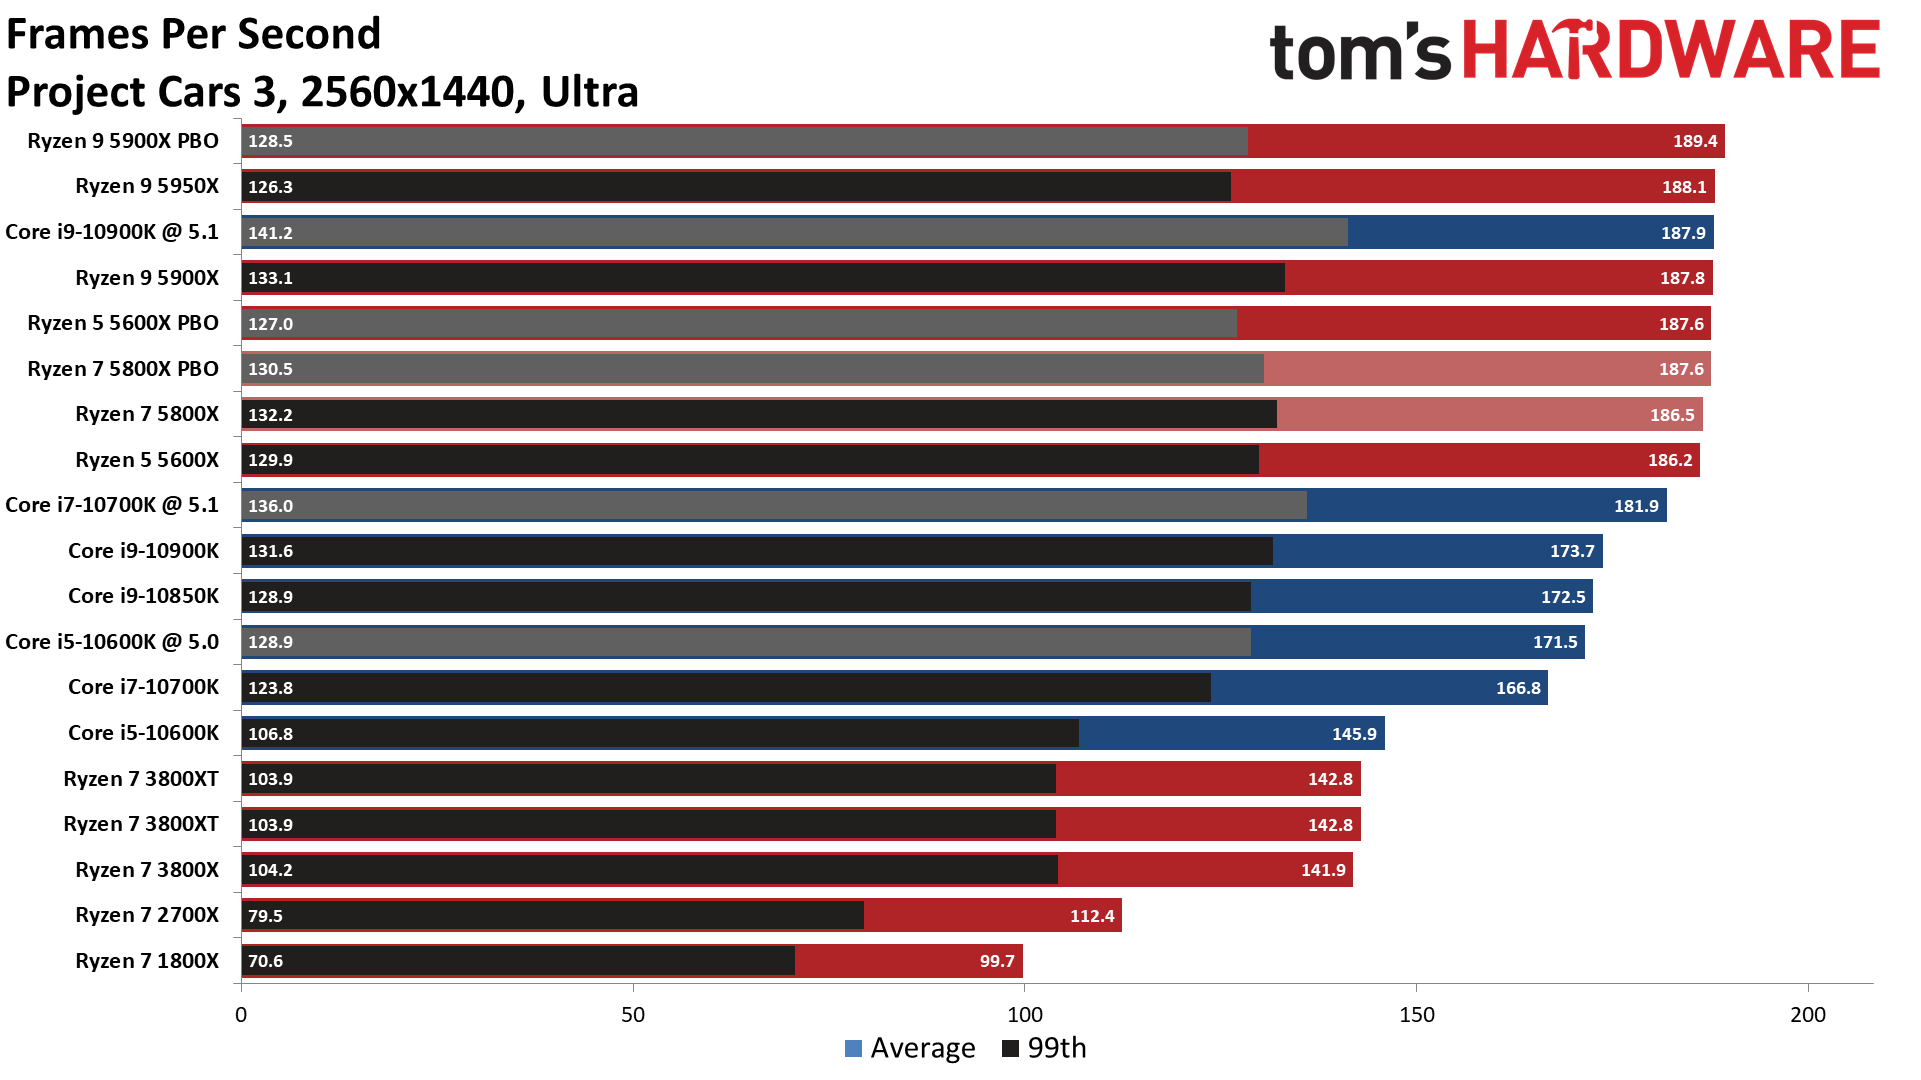
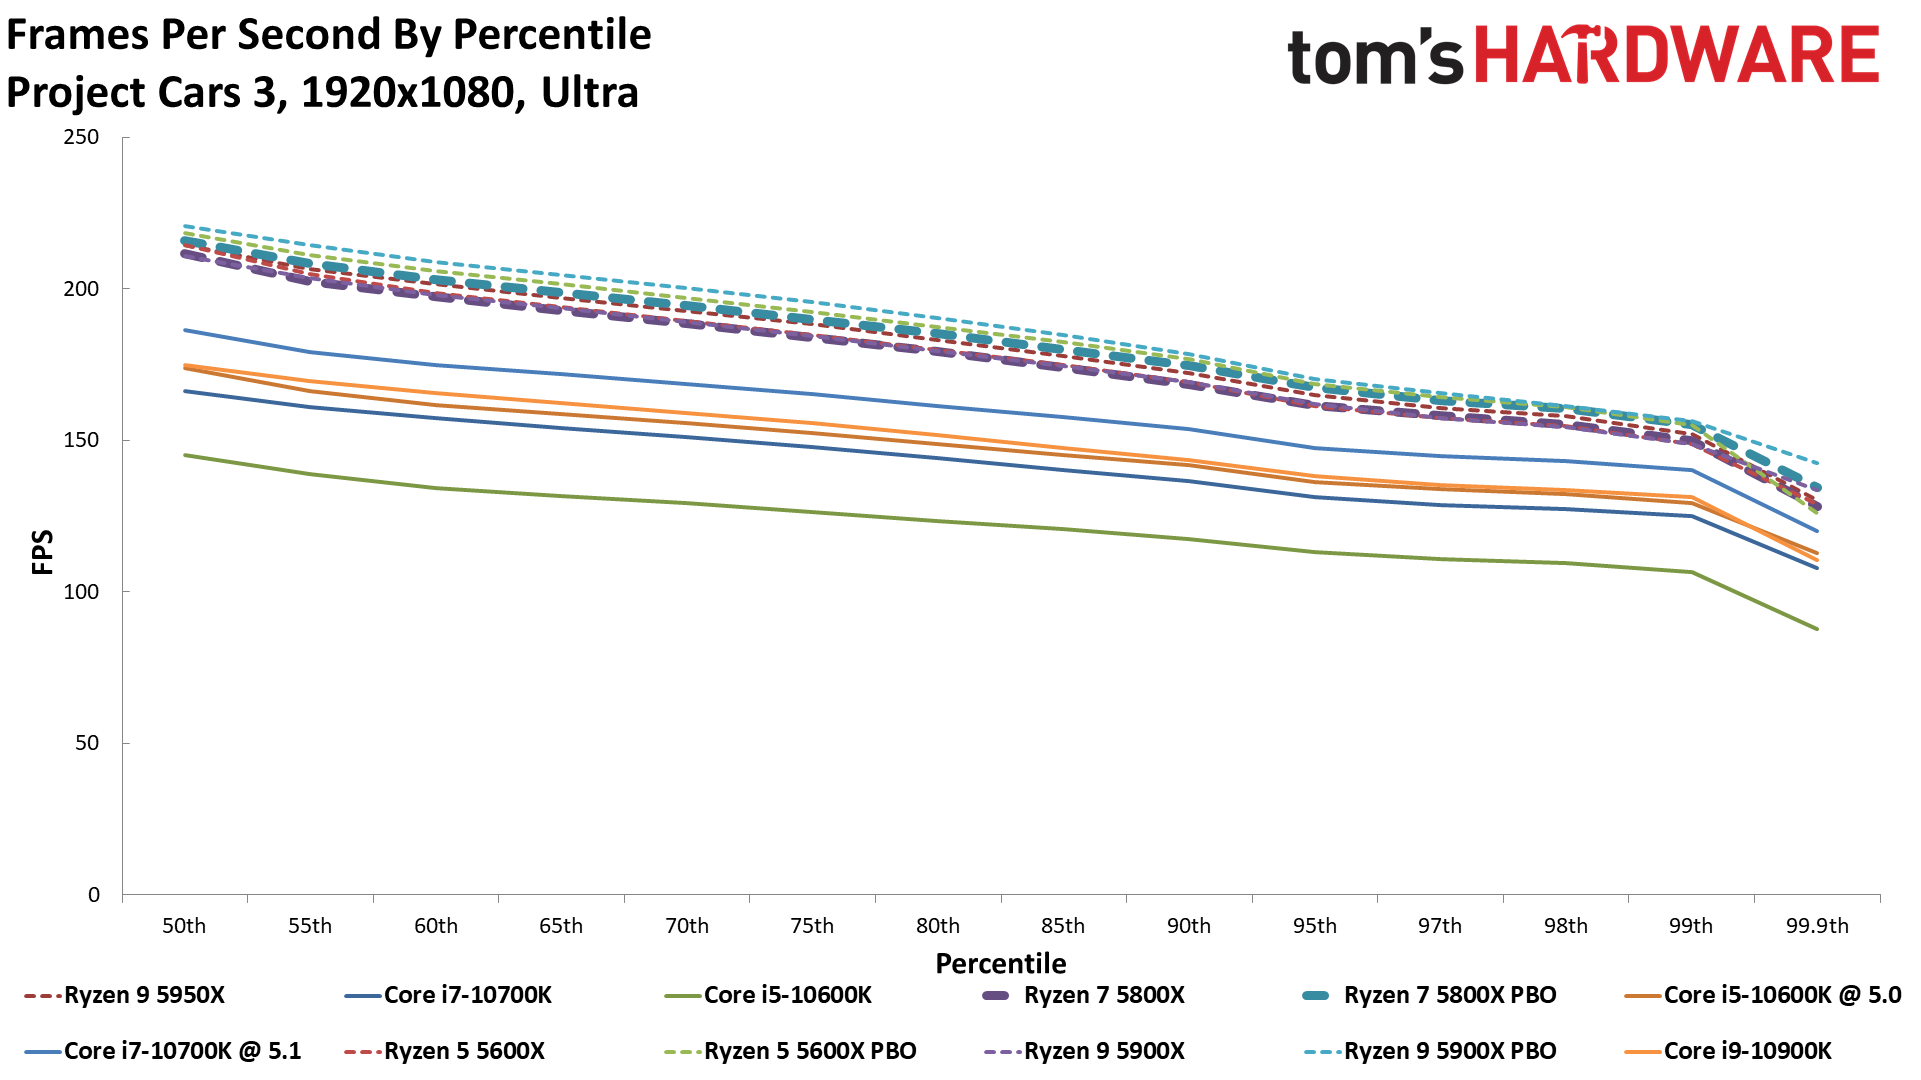
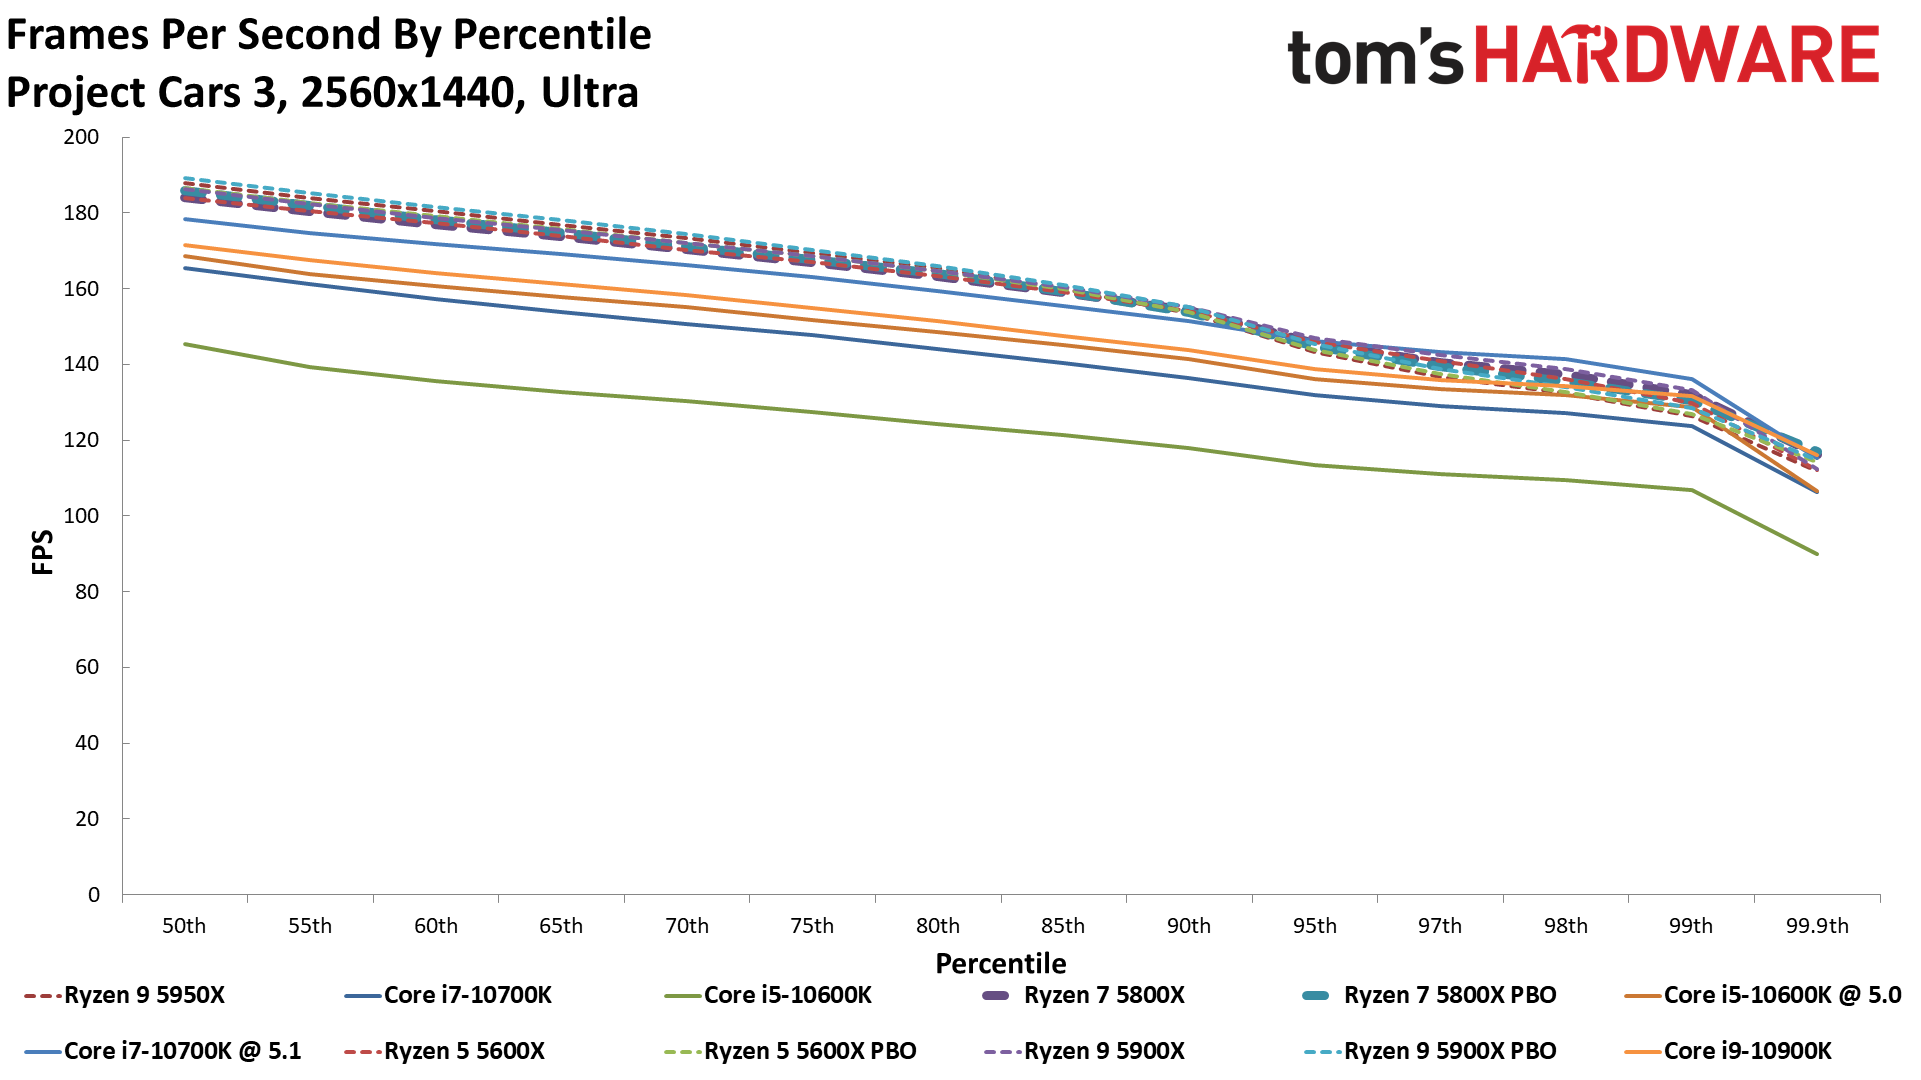
You'll see a few differences between the Ryzen 7 5800X and 5600X in the titles below, largely where games prize either core counts or other factors. However, those deltas rarely exceed 3%. Given the similarities between the two processors, we're going to skip the blow-by-blow commentary for the individual benchmarks below. We'll dive in a bit deeper during the synthetic gaming tests and the application testing results, both of which have larger performance deltas due to the Ryzen 7 5800X's more generous core counts.
Do pay attention to the previous-gen Ryzen models (Ryzen 7 1800X, Ryzen 7 2700X, Ryzen 7 3800X, and Ryzen 7 3800XT) as you flip through the gaming charts - they tell quite the story of how far AMD has come in just a few short years of refinements to its Zen architecture and manufacturing process.
Get Tom's Hardware's best news and in-depth reviews, straight to your inbox.
3D Mark, VRMark, Stockfish Chess Engine
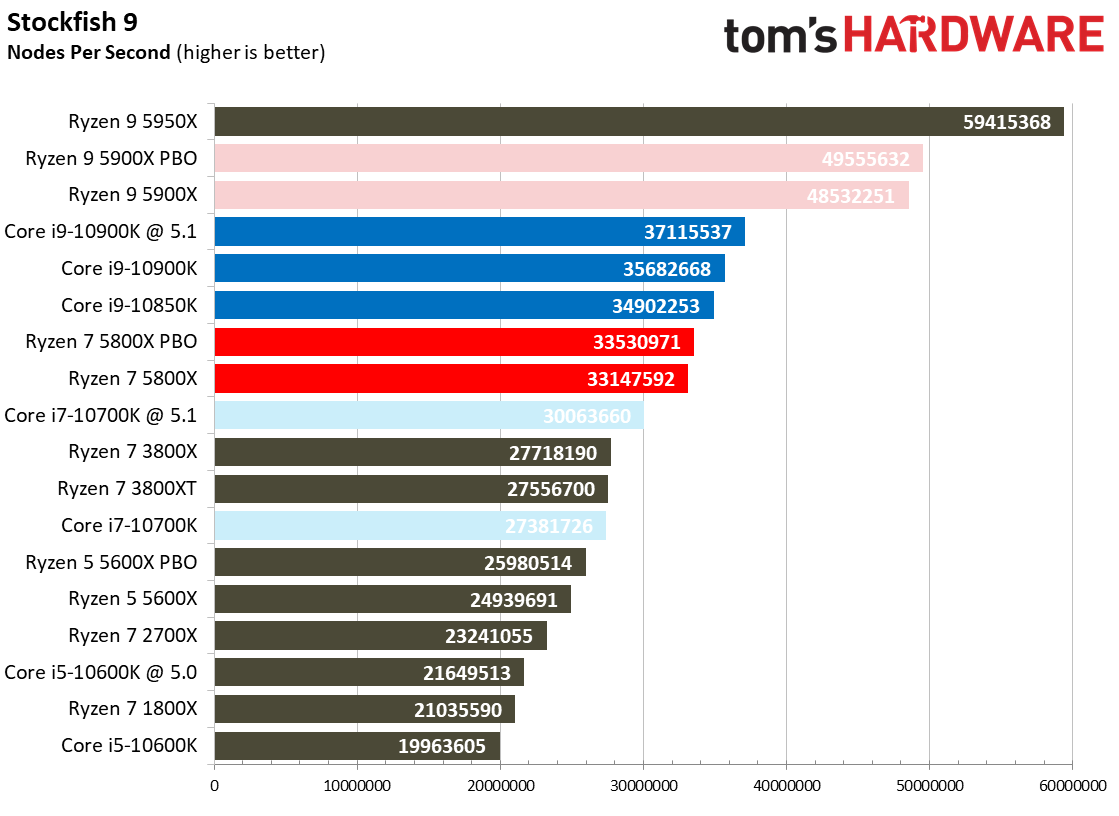
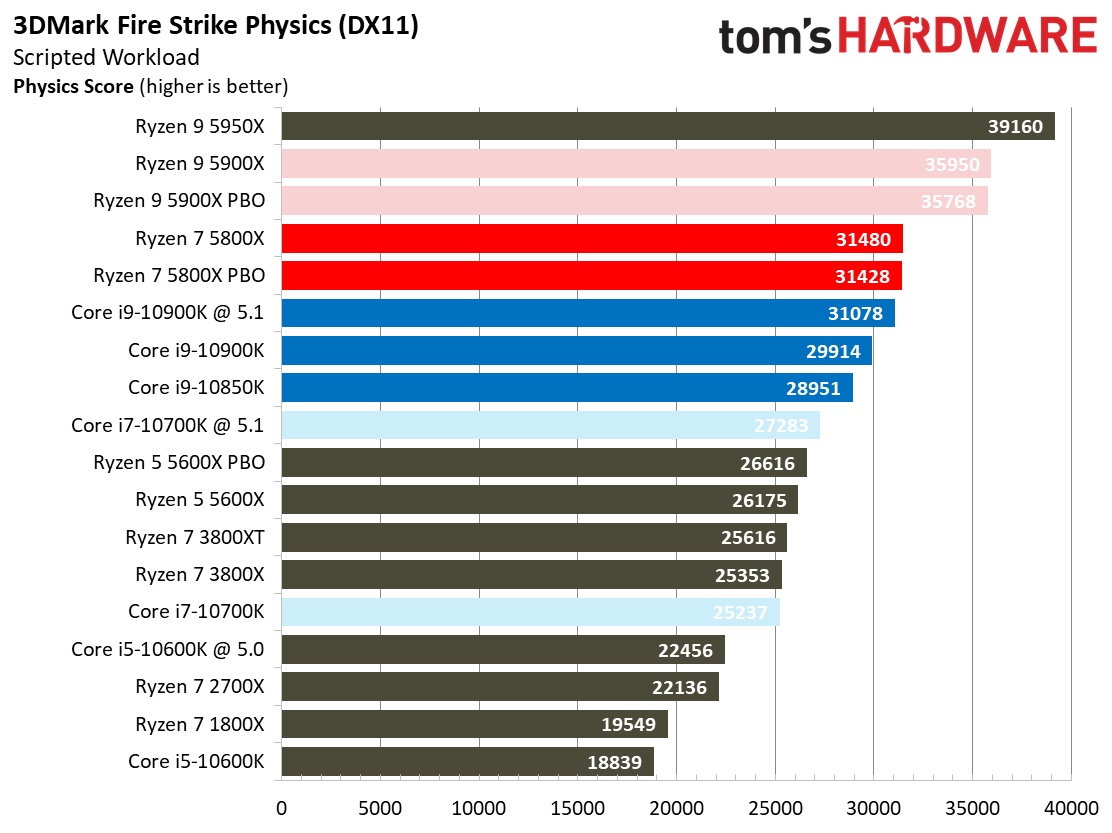
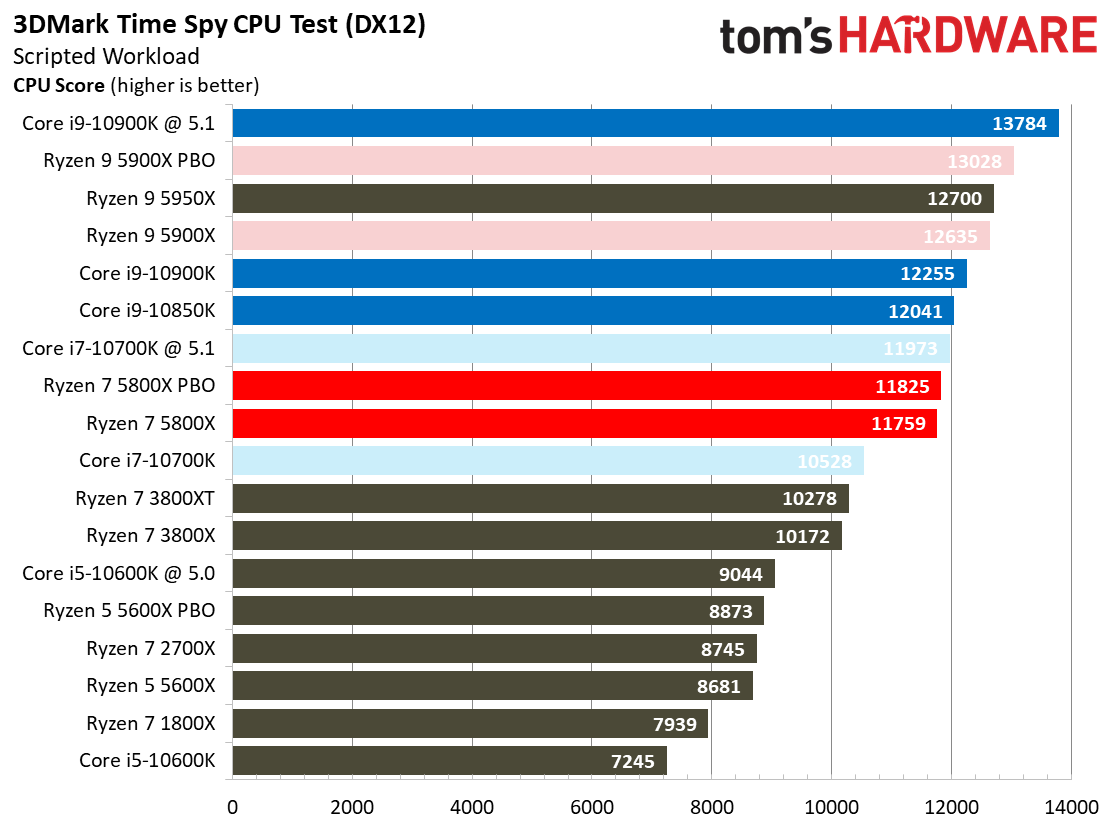
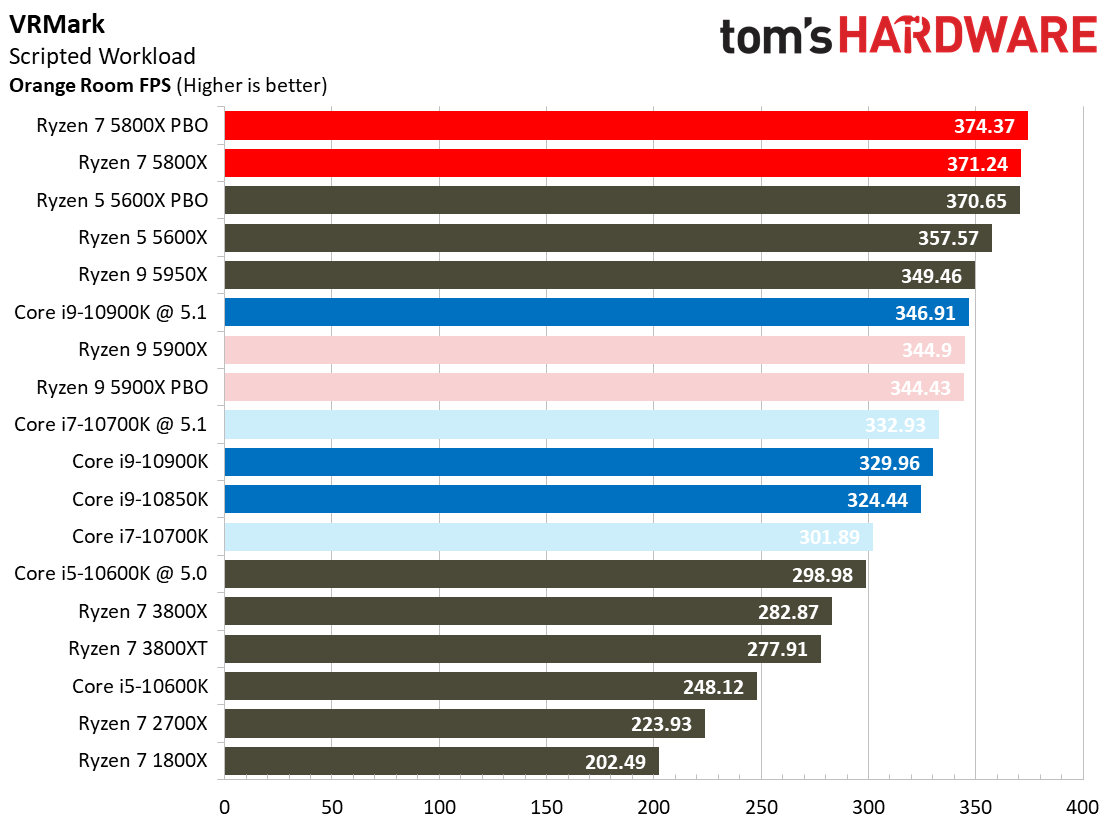
We run these synthetic gaming tests as part of our main application test script. We use an RTX 2080 Ti for these tests to facilitate faster testing, but we use an Nvidia GeForce RTX 3090 for all other gaming benchmarks (we don't include these tests in the preceding cumulative measurements).
AMD's core-heavy processors tend to dominate in threaded synthetic tests, like the Stockfish chess engine and 3DMark's DX11 and DX12 CPU benchmarks, but Intel's Core i9 models come with ten cores and twenty threads compared to the Ryzen 7 5800X's eight-core 16-thread design. As such, the Intel i9 processors carve out significant wins at stock settings in Stockfish, which scales nearly linearly with core count, and overclocking doesn't help the 5800X.
The DX11 tests don't scale nearly as well with additional core counts, allowing the Ryzen 7 5800X and its large unified cache to take the lead over the competing chips. The DX12 test scales better than the DX11 variant, so here the Intel processors carve out a win at stock settings, and overclocking grants the 10900K a 17% lead over the tuned Ryzen 7 5800X.
VRMark again proves to be a bright spot for the Zen 3-powered chips. This benchmark leans heavily on per-core performance (a mixture of IPC and frequency). As you can see from the previous-gen Ryzen processors, AMD has traditionally trailed in this benchmark, but the Ryzen 7 5800X takes the uncontested lead, at least over the Intel processors. That reverses the long-held trend of Intel domination in this benchmark, and the 5800X's win is quite convincing - the stock 5800X, by virtue of its higher IPC and unified cache, beats the overclocked Core i9-10900K by a comparatively large margin.
Borderlands 3 on Ryzen 7 5800X
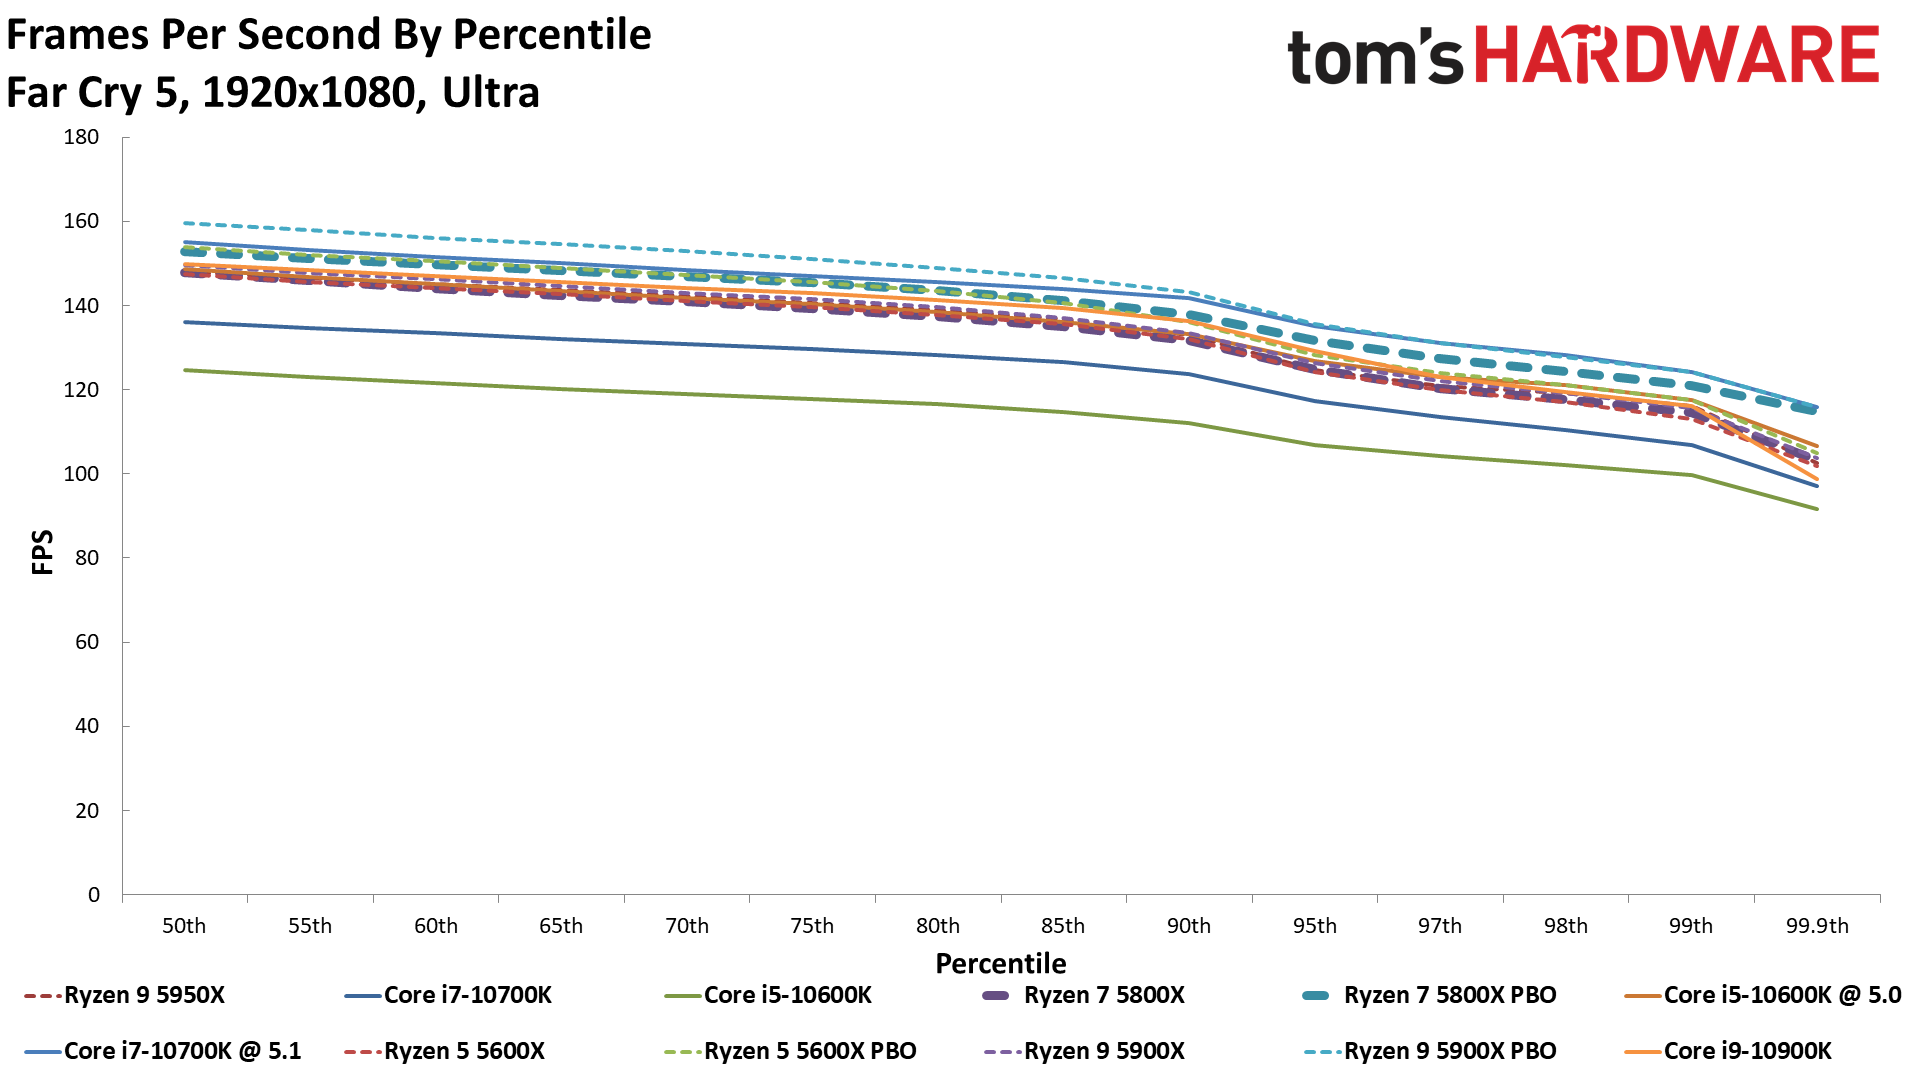
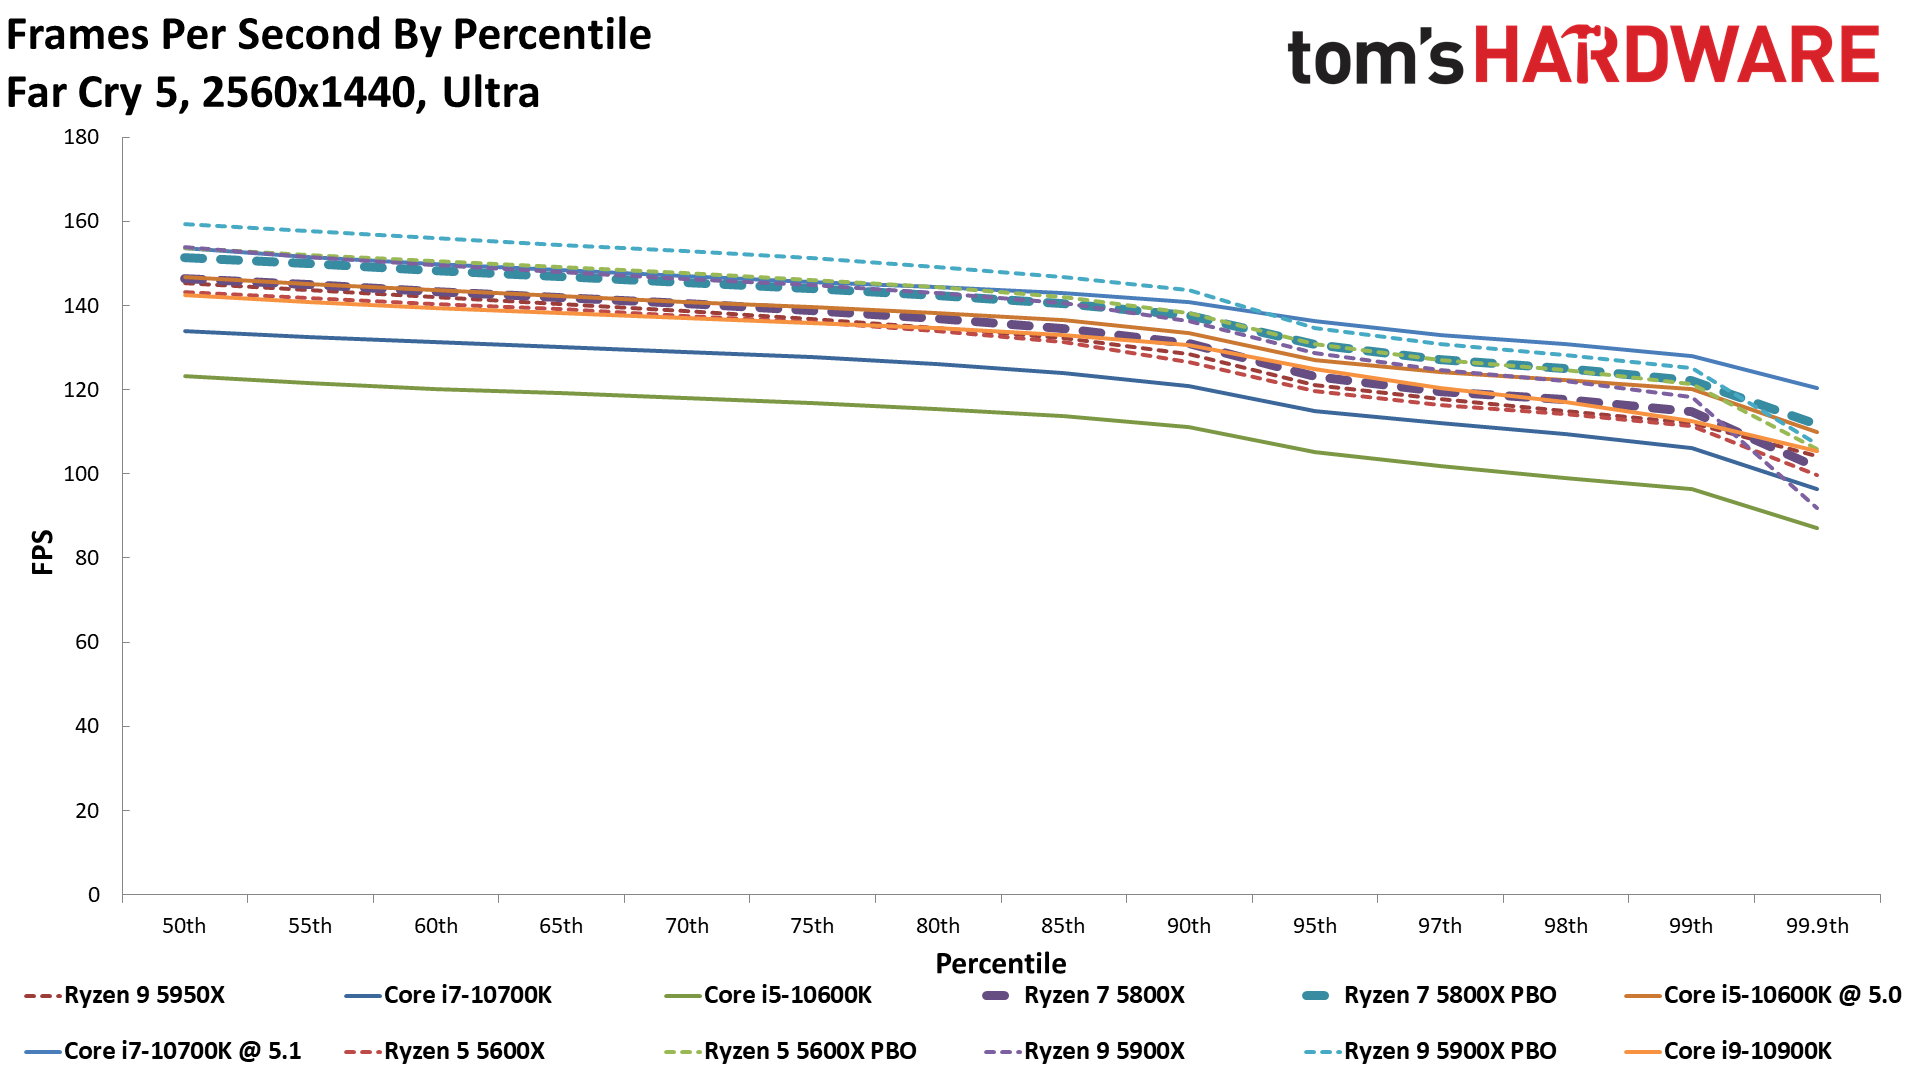
Far Cry 5 on Ryzen 7 5800X
Hitman 2 on Ryzen 7 5800X
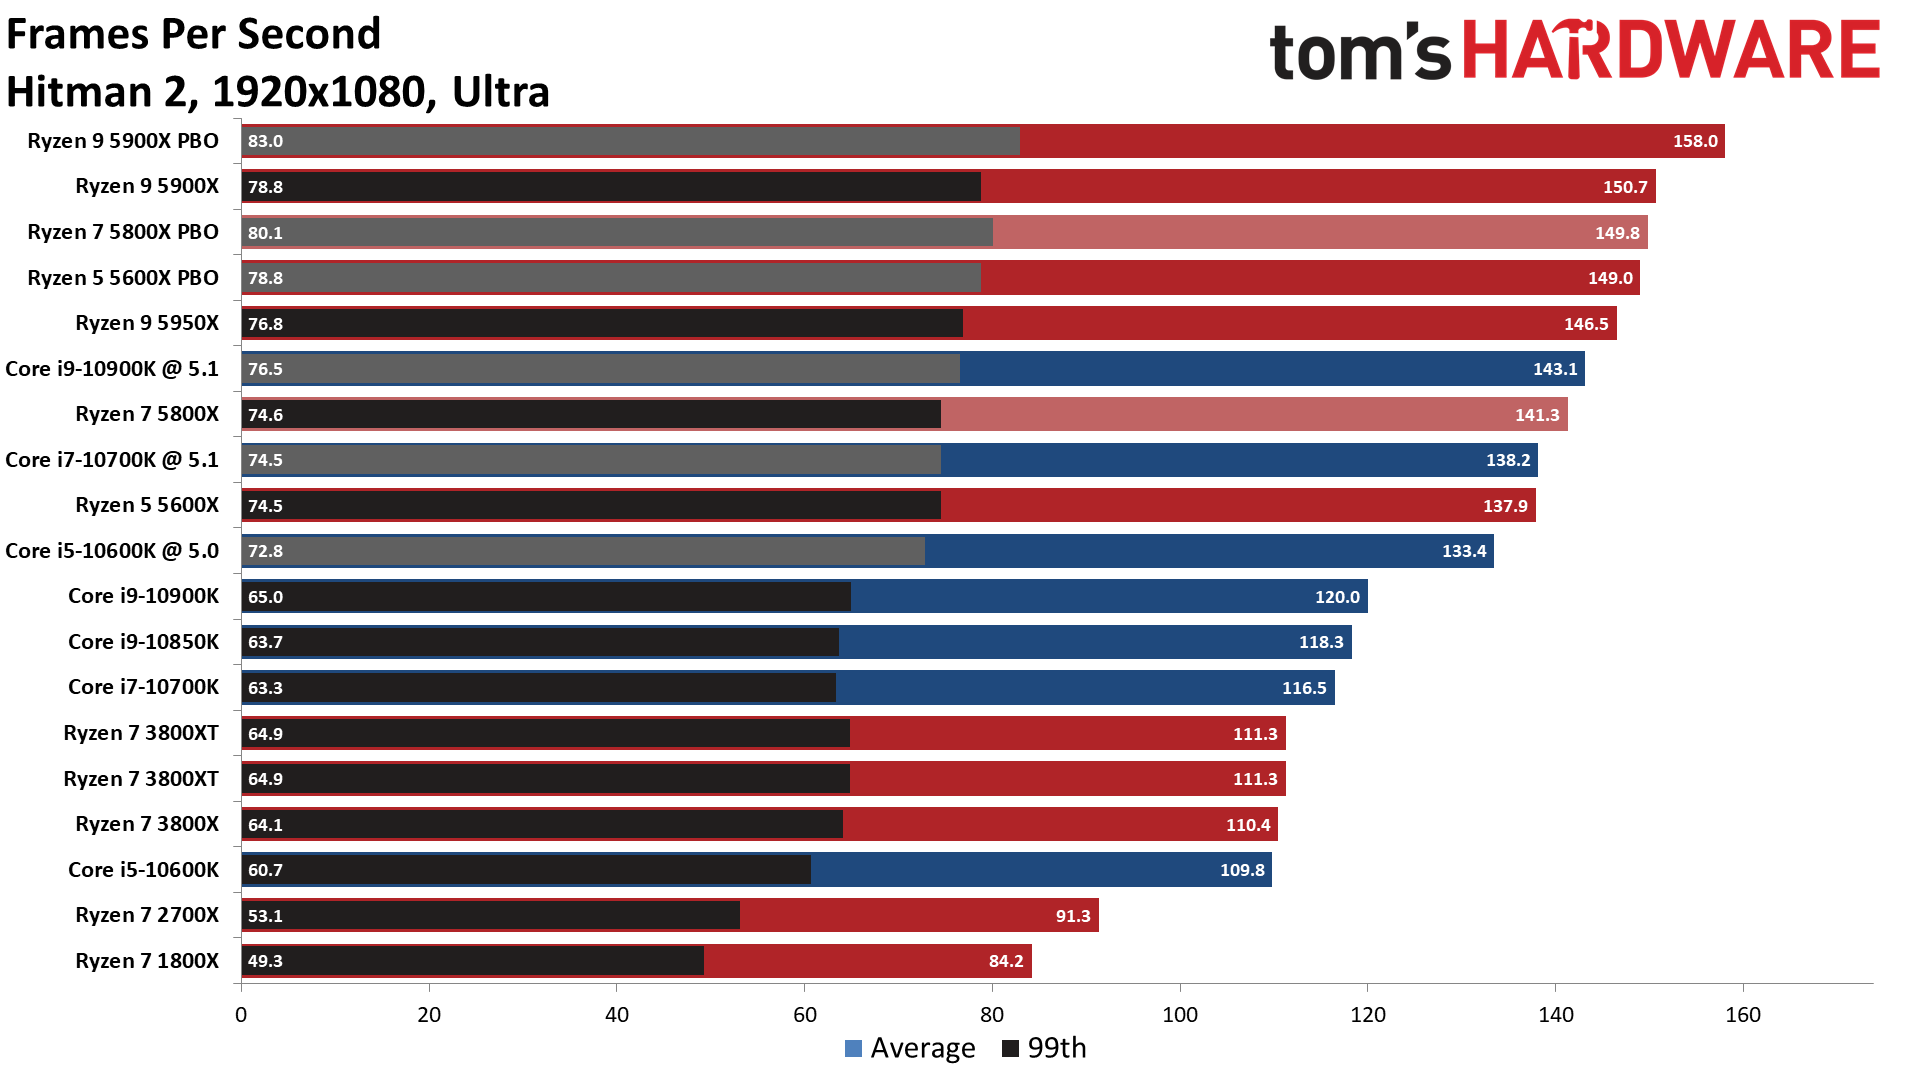
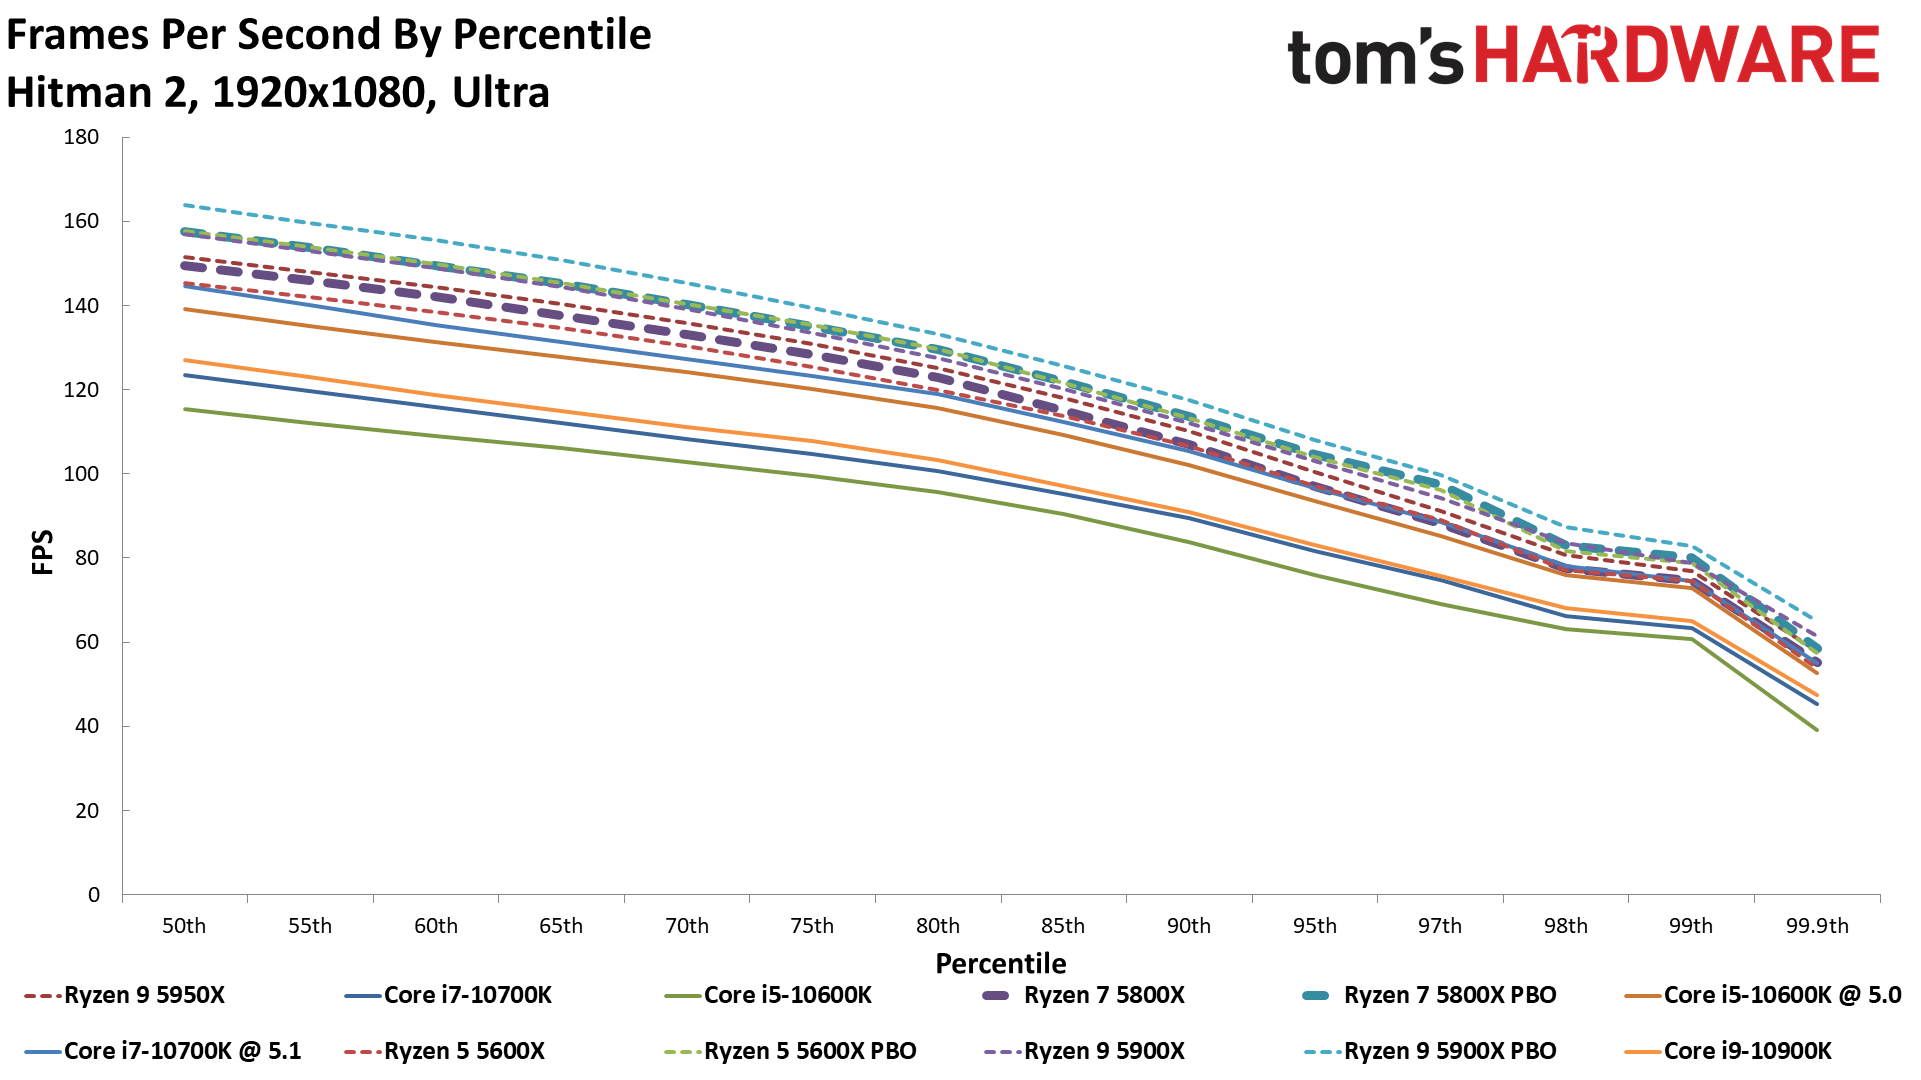
Hitman 2 doesn't seem to scale well from 1080p to 1440p, at least not at the heightened fidelity settings we use for the benchmark. We stuck with the 1080p test for this title because the same trends carry over to 1440p.
Microsoft Flight Simulator on Ryzen 7 5800X
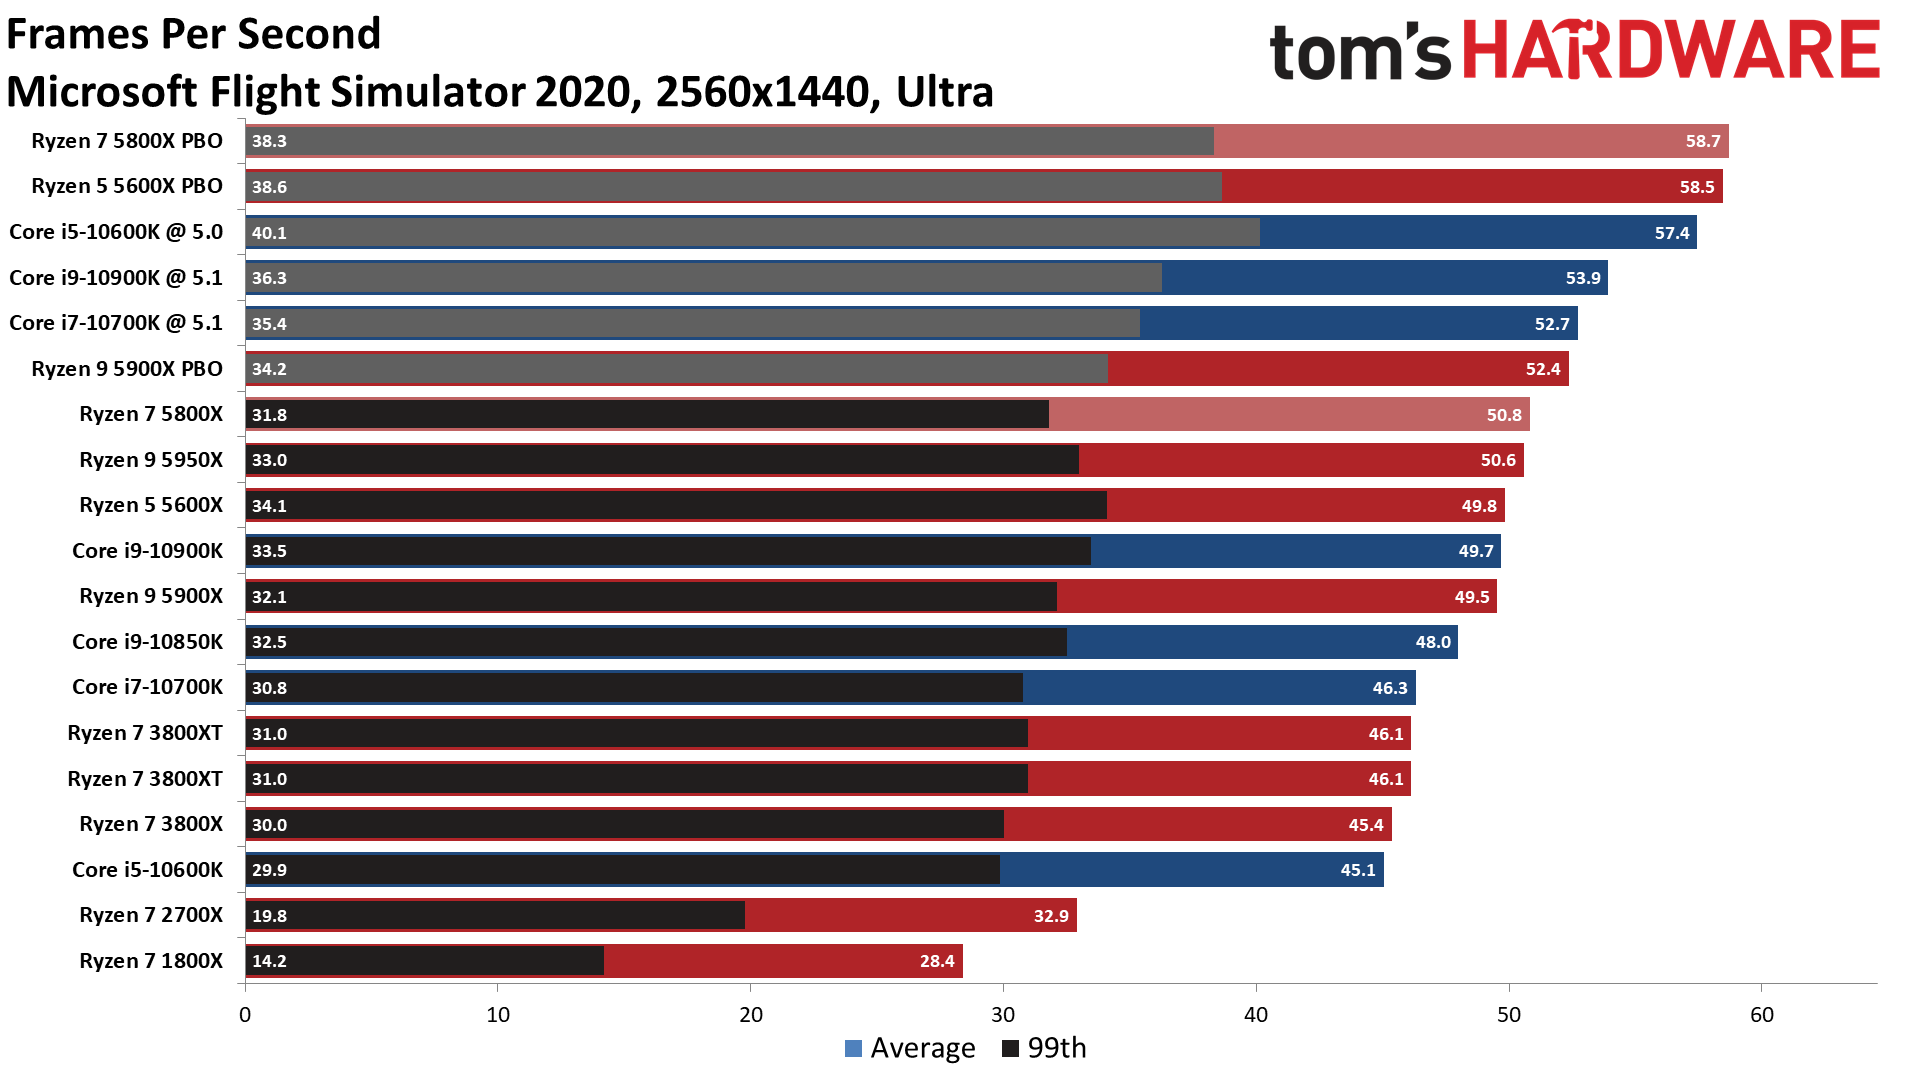
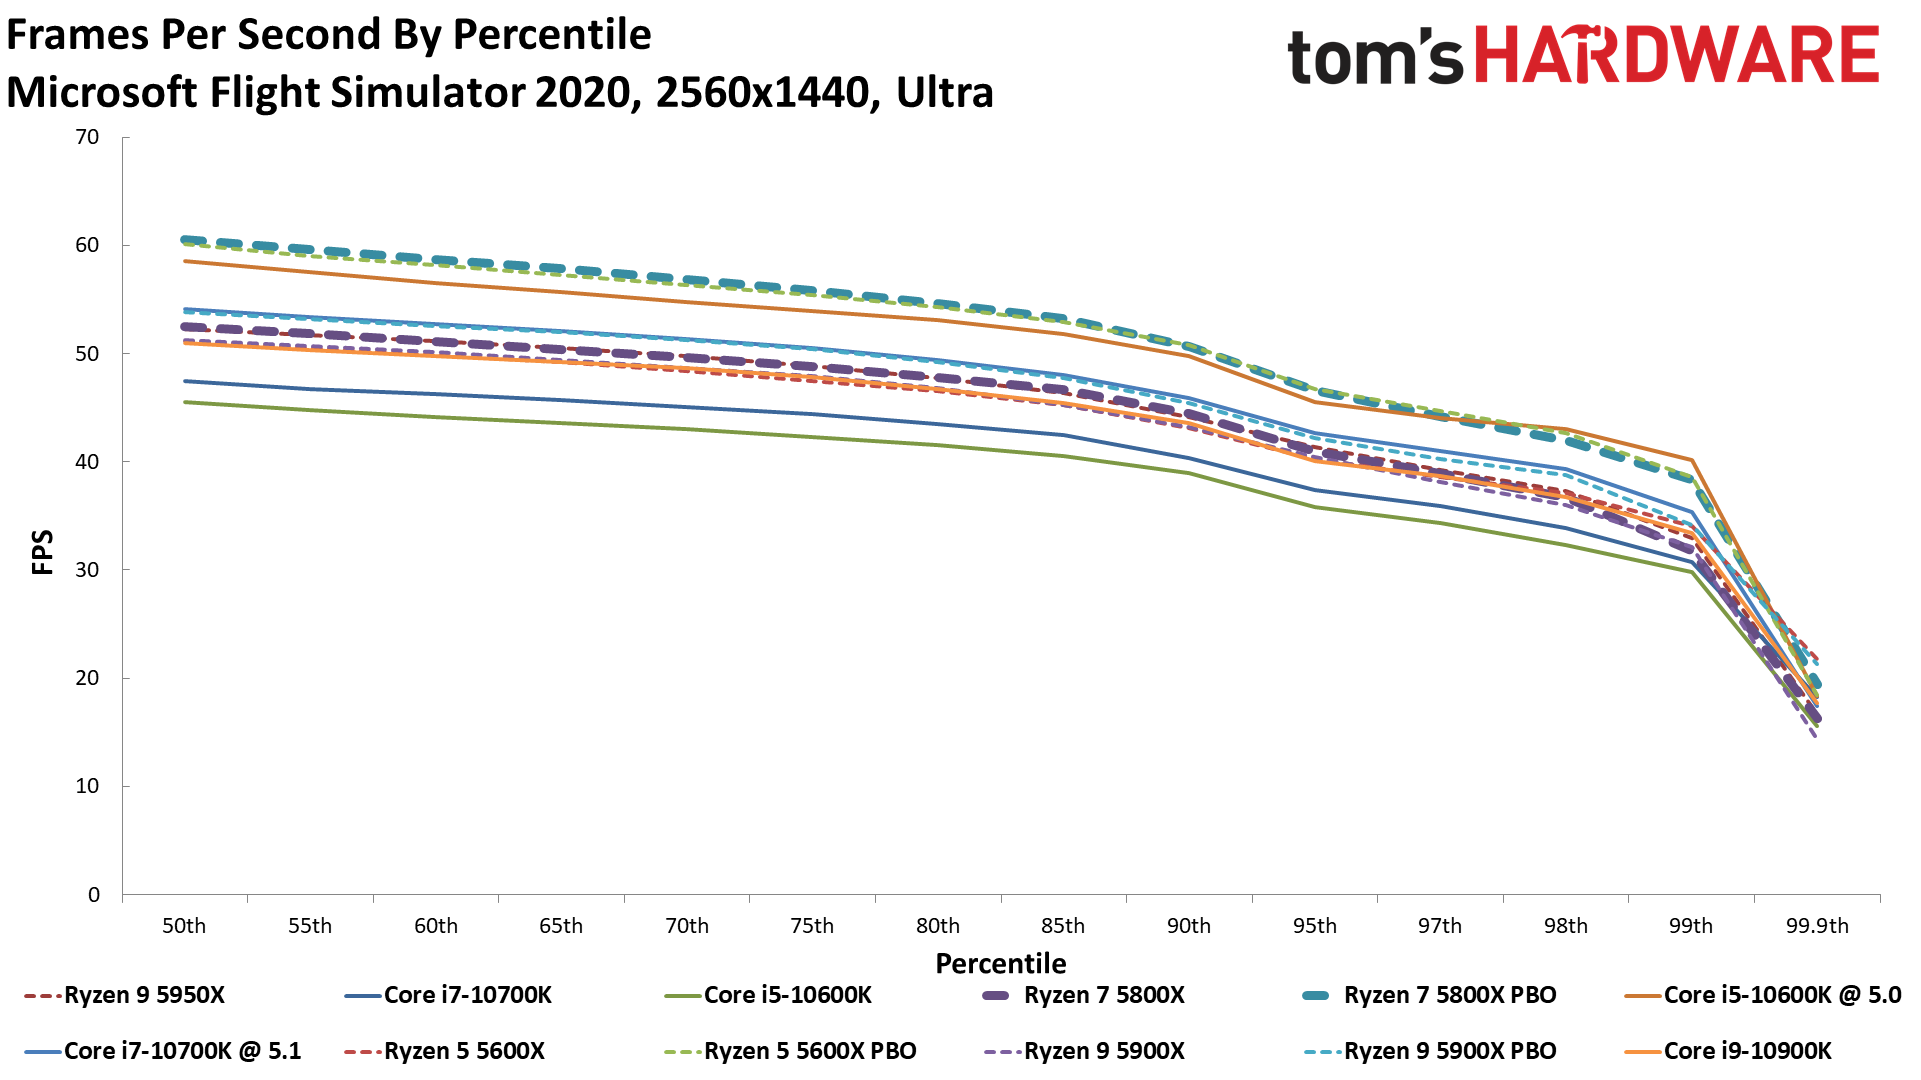
We're just as excited as anyone else about Microsoft's long long-overdue release of Flight Simulator, and we're sure that serious flight sim fans will want to crank up the resolution on this title. Hence our tests at 1440p, which typically bring graphics bottlenecks into play. Expect these deltas to widen with 1080p testing.
Project CARS 3 on Ryzen 7 5800X
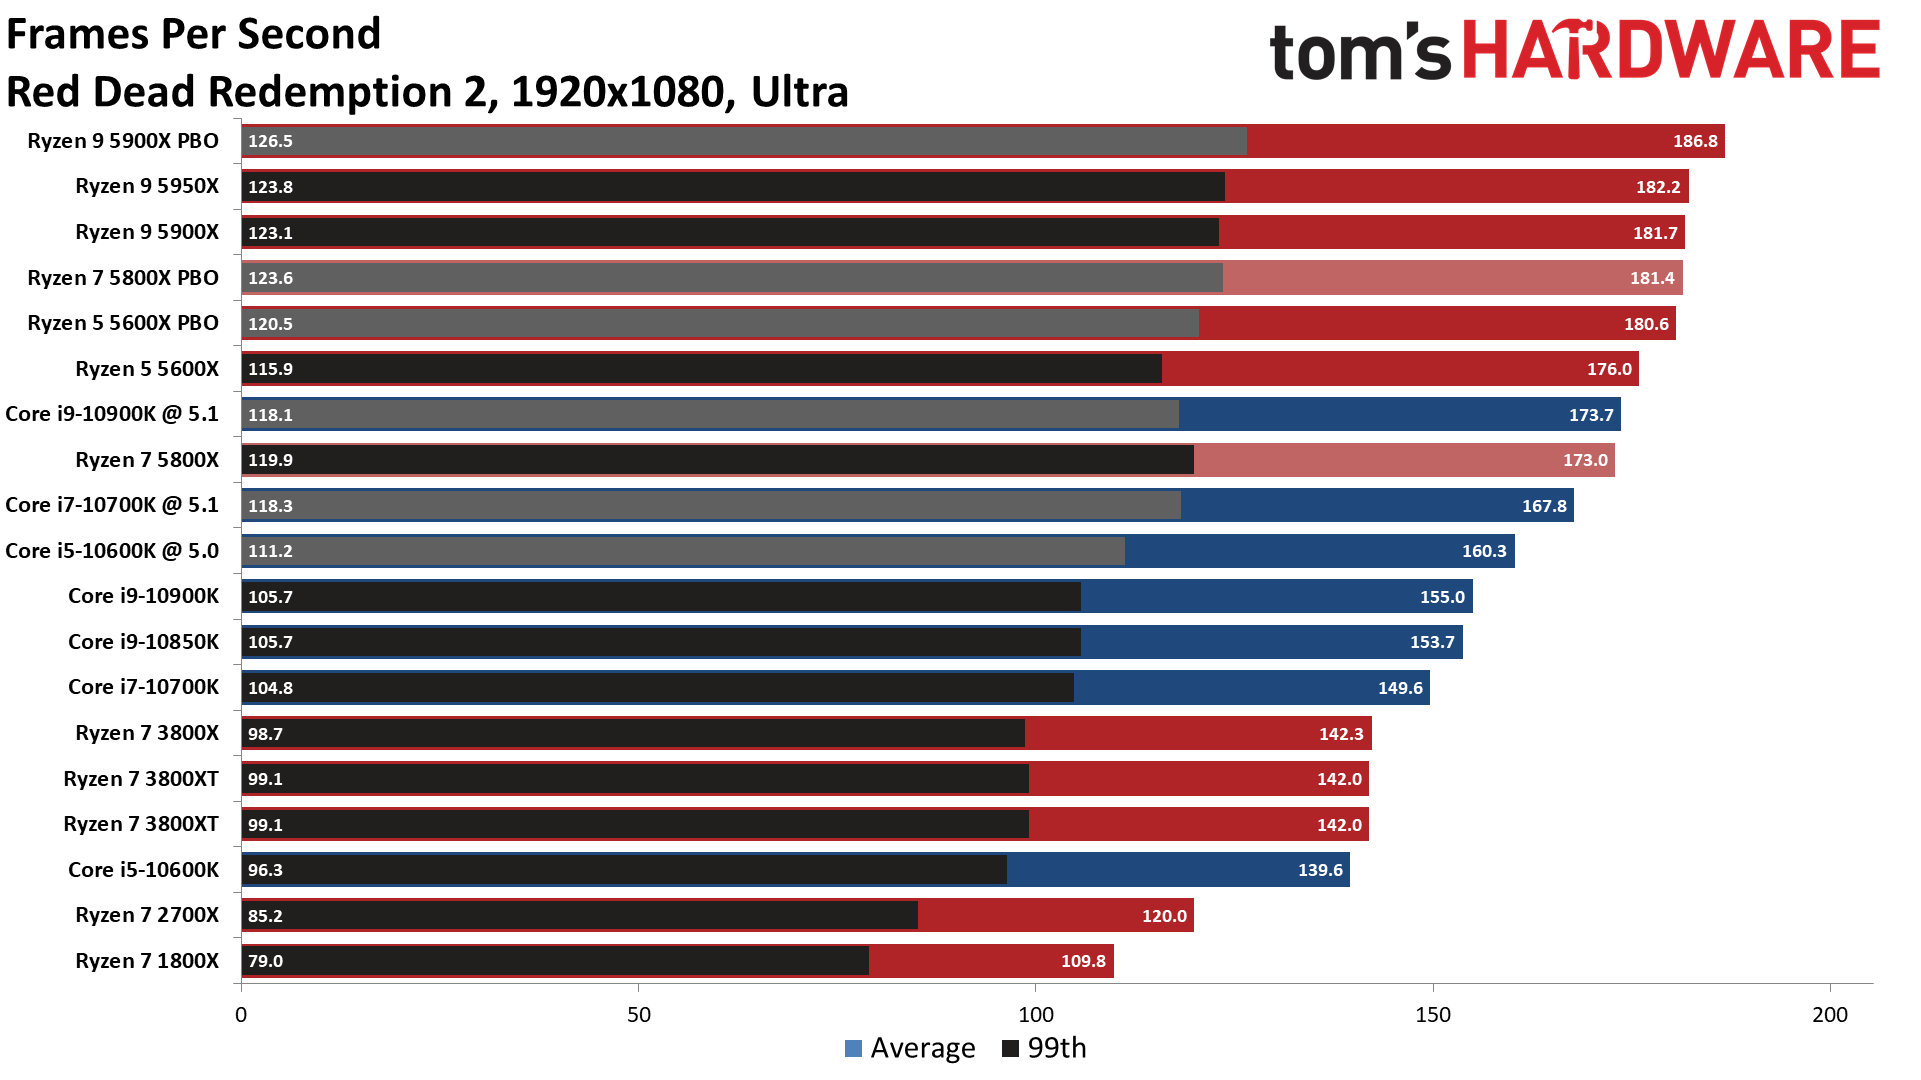
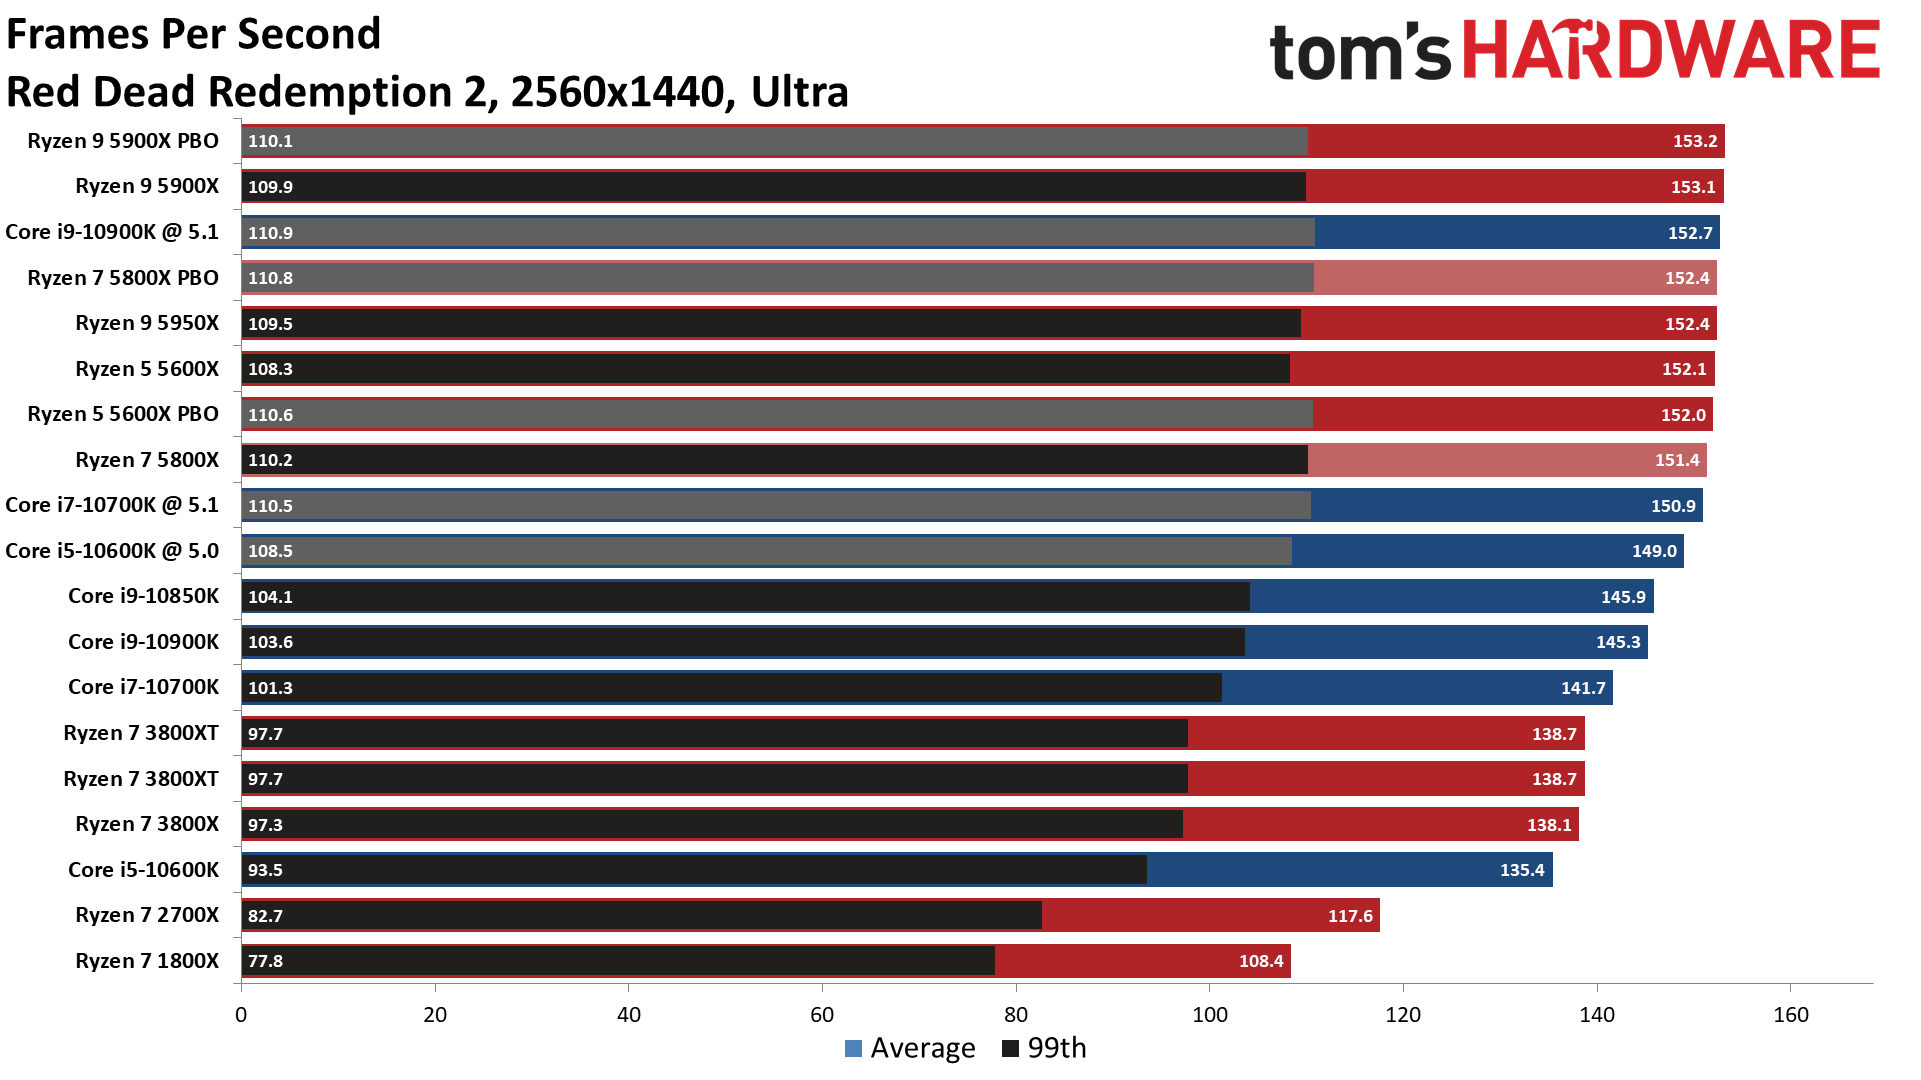
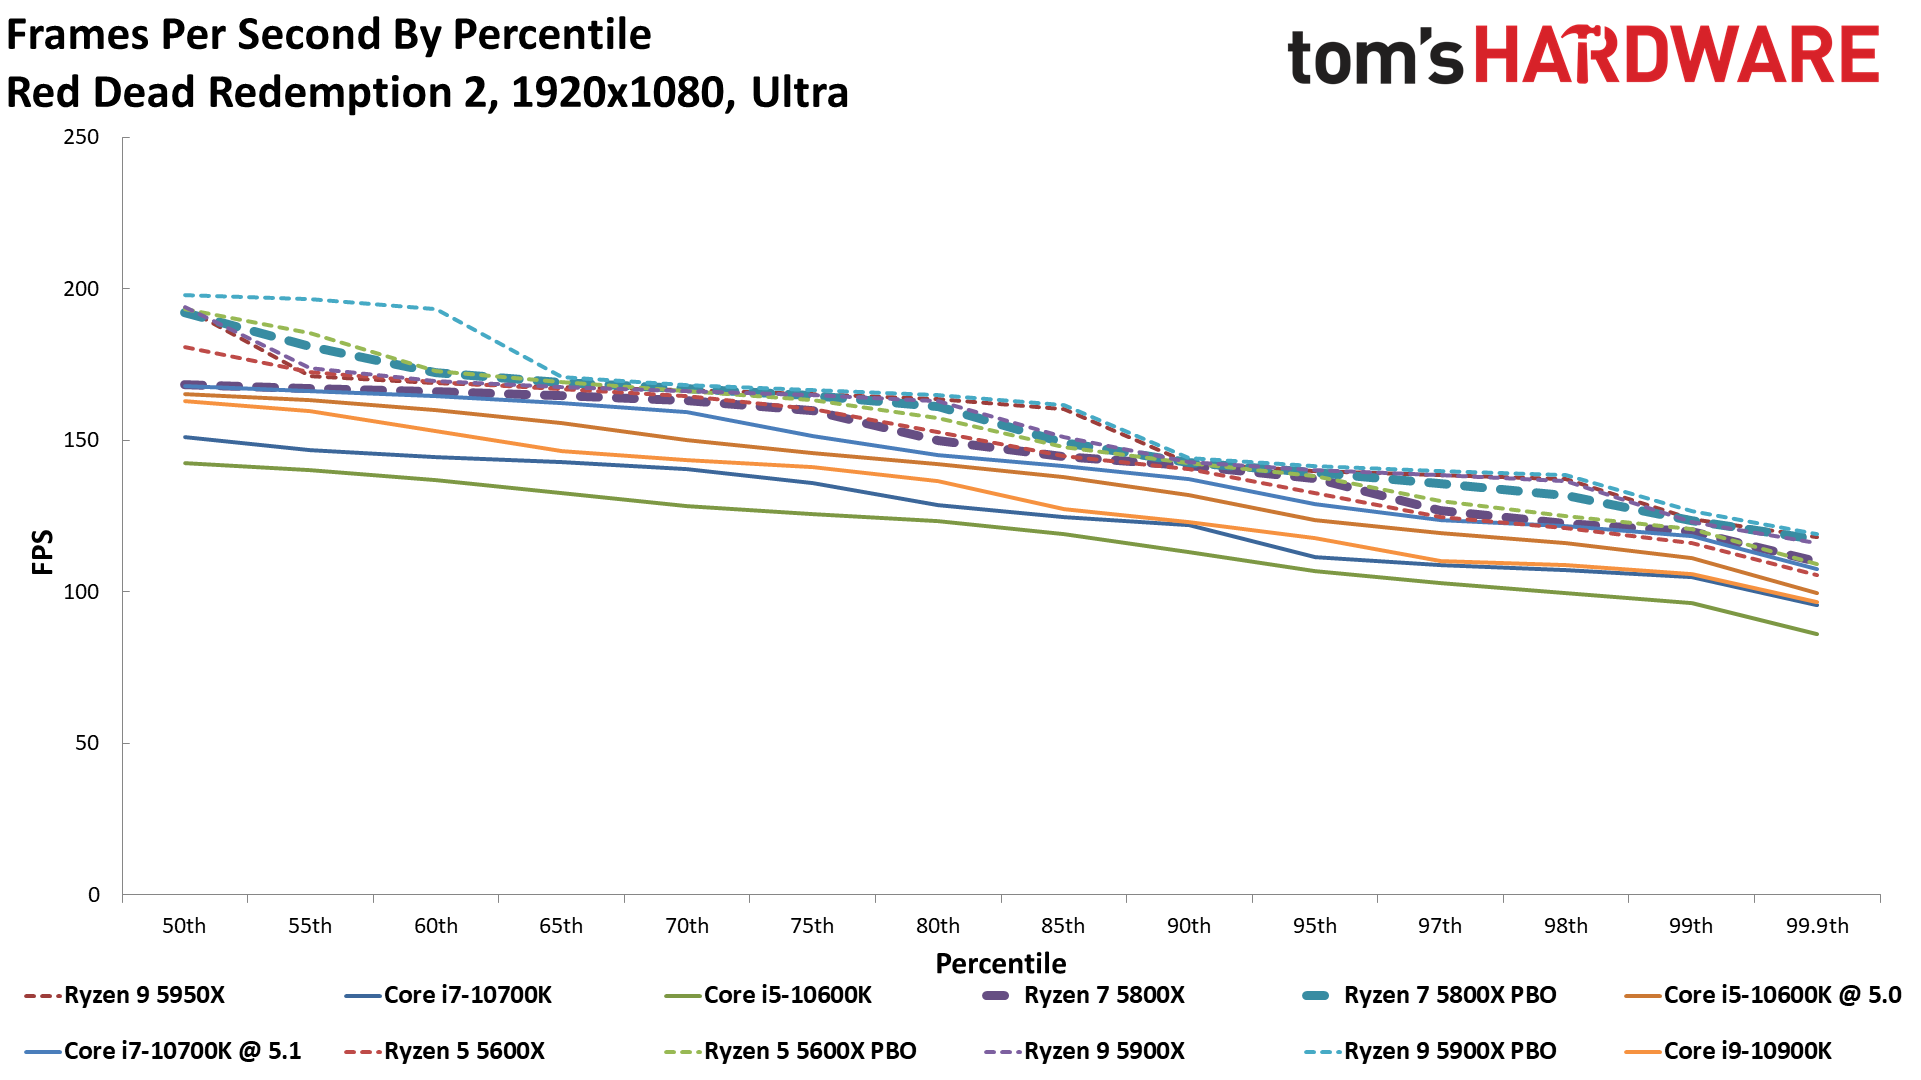
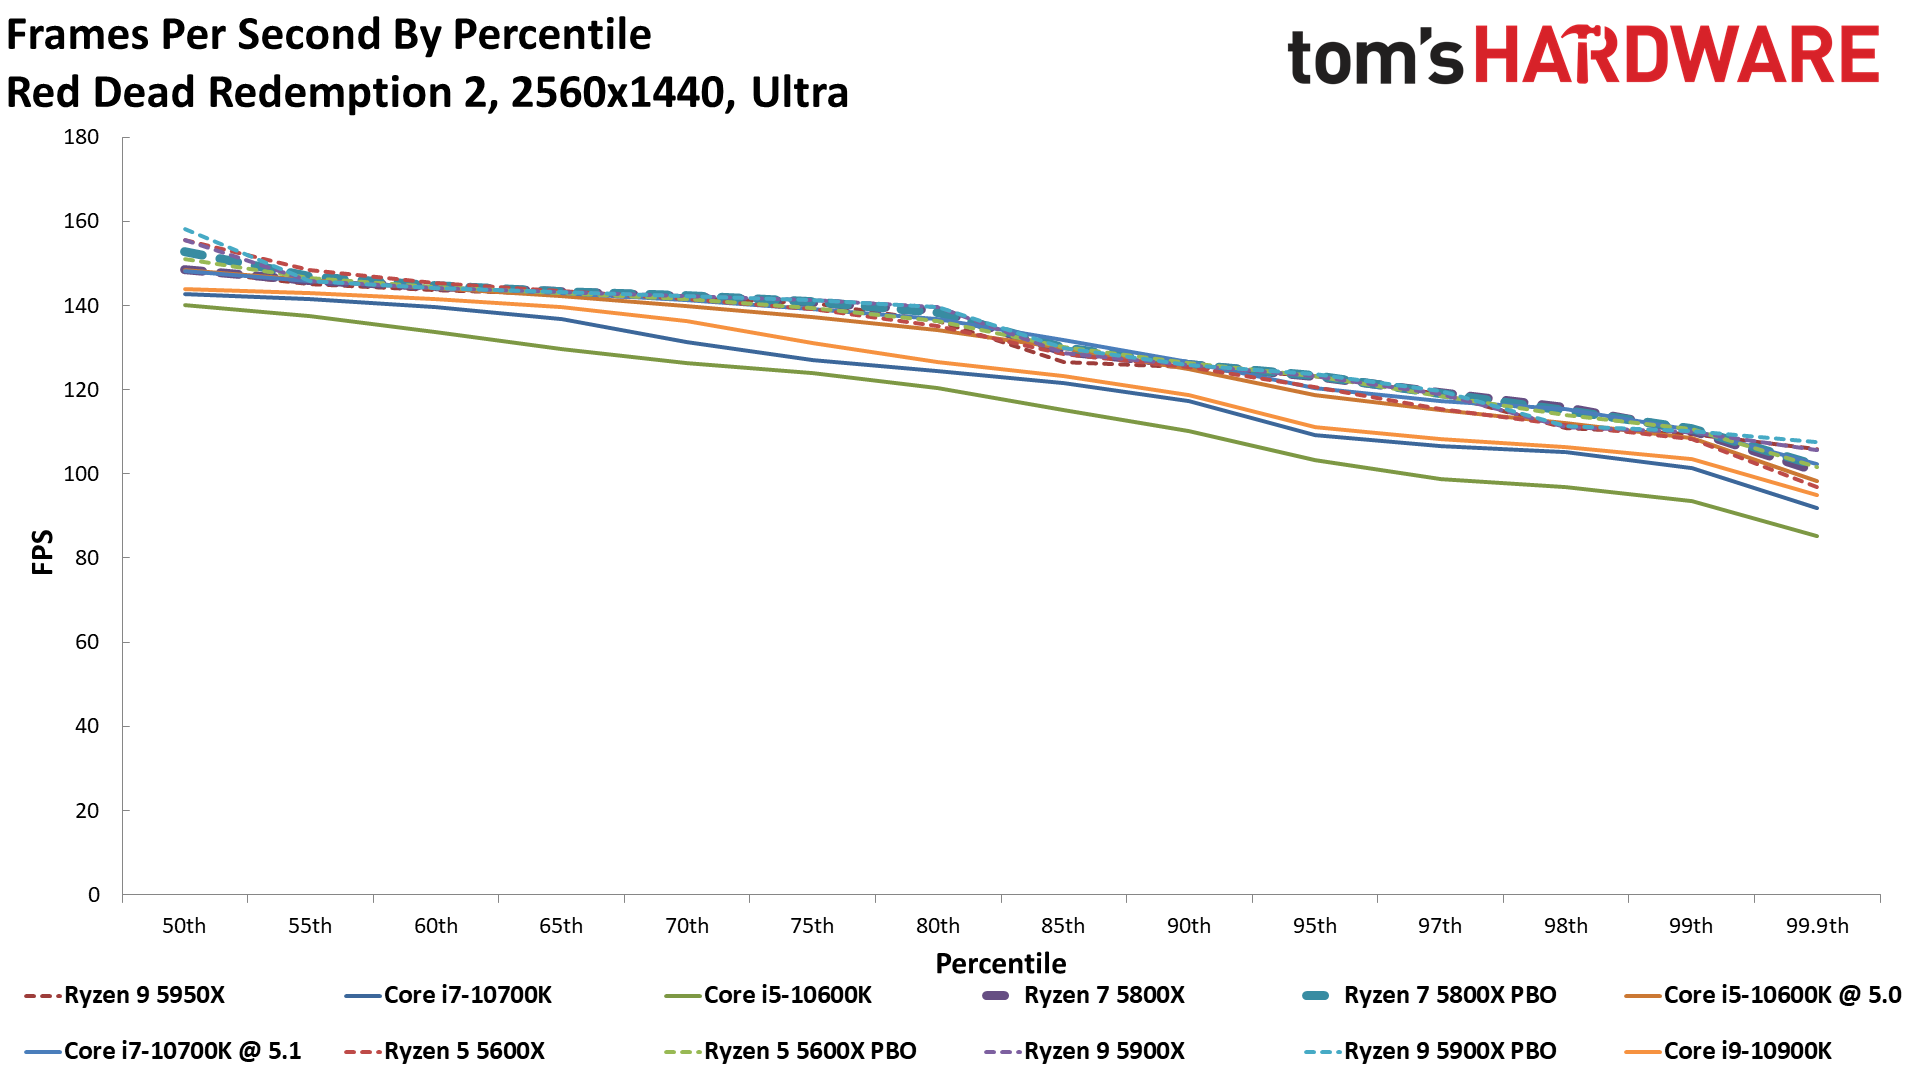
Red Dead Redemption 2 on Ryzen 7 5800X
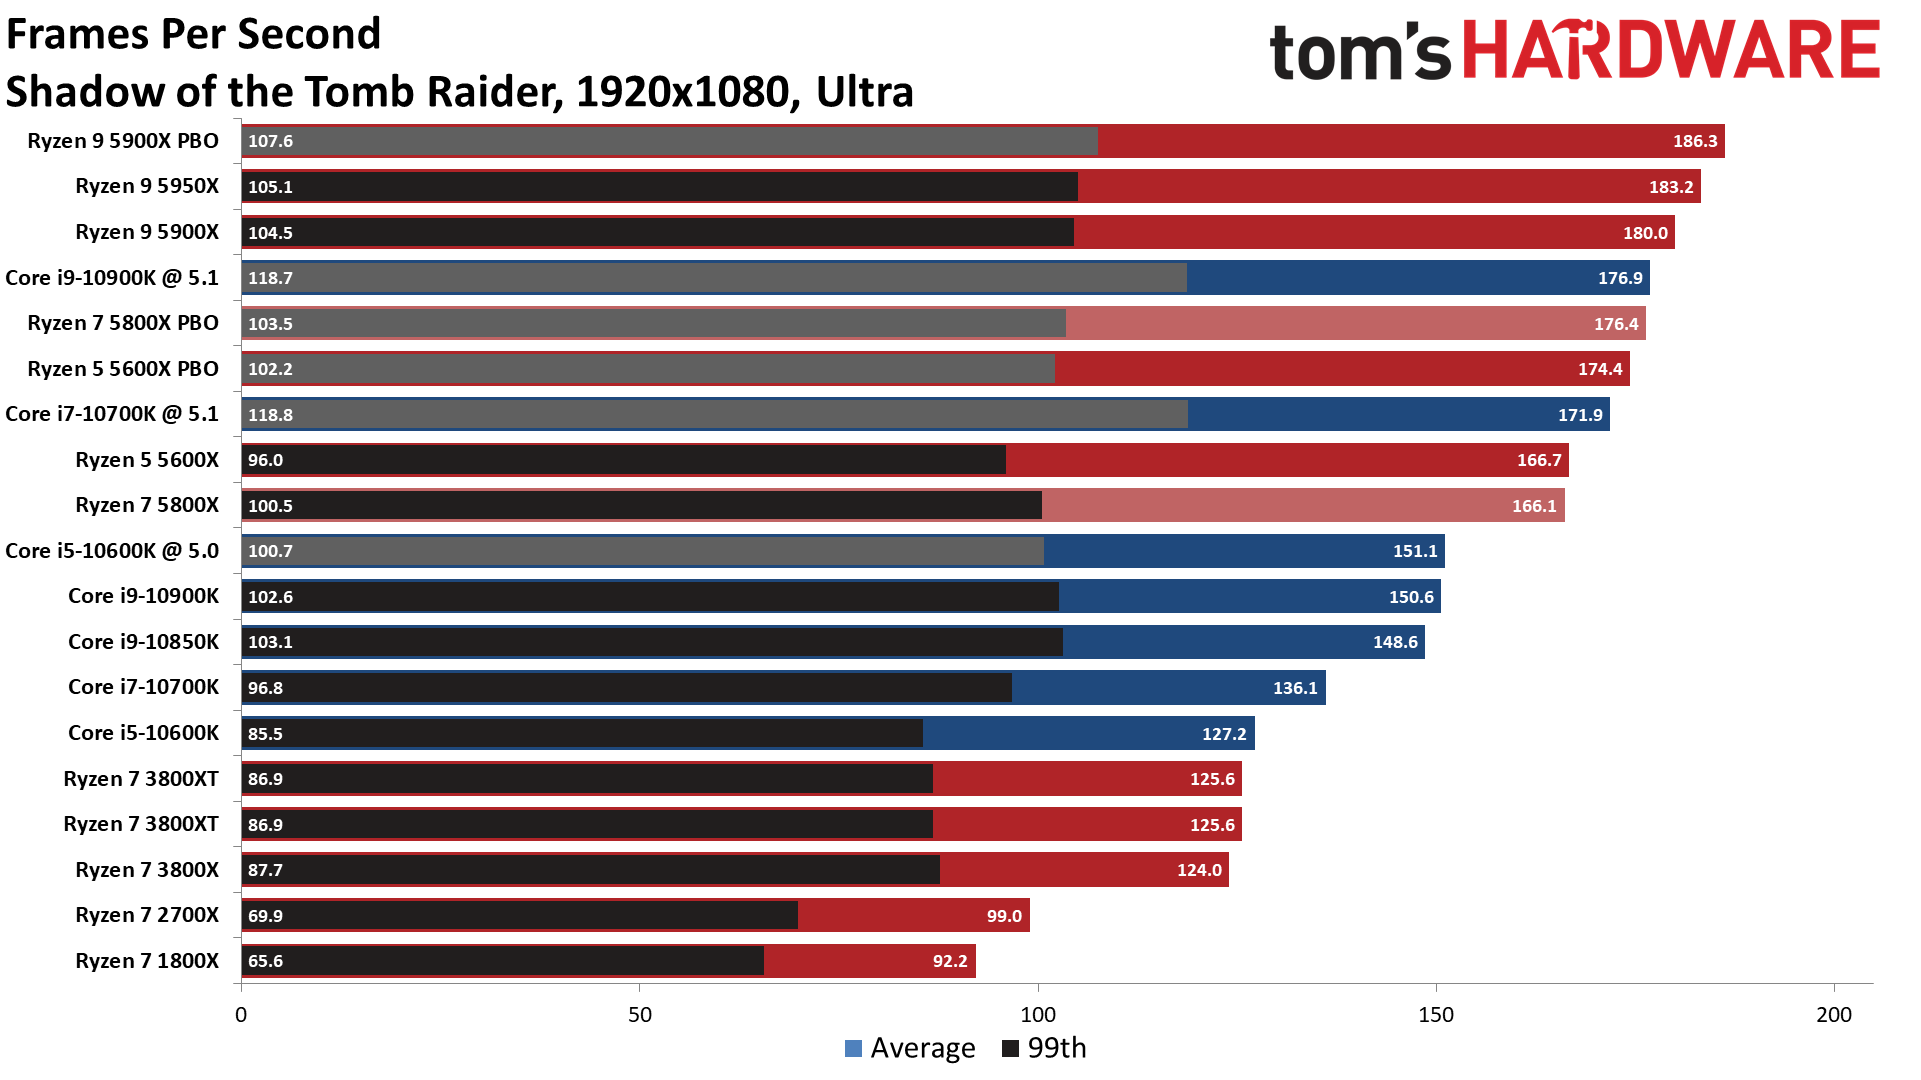
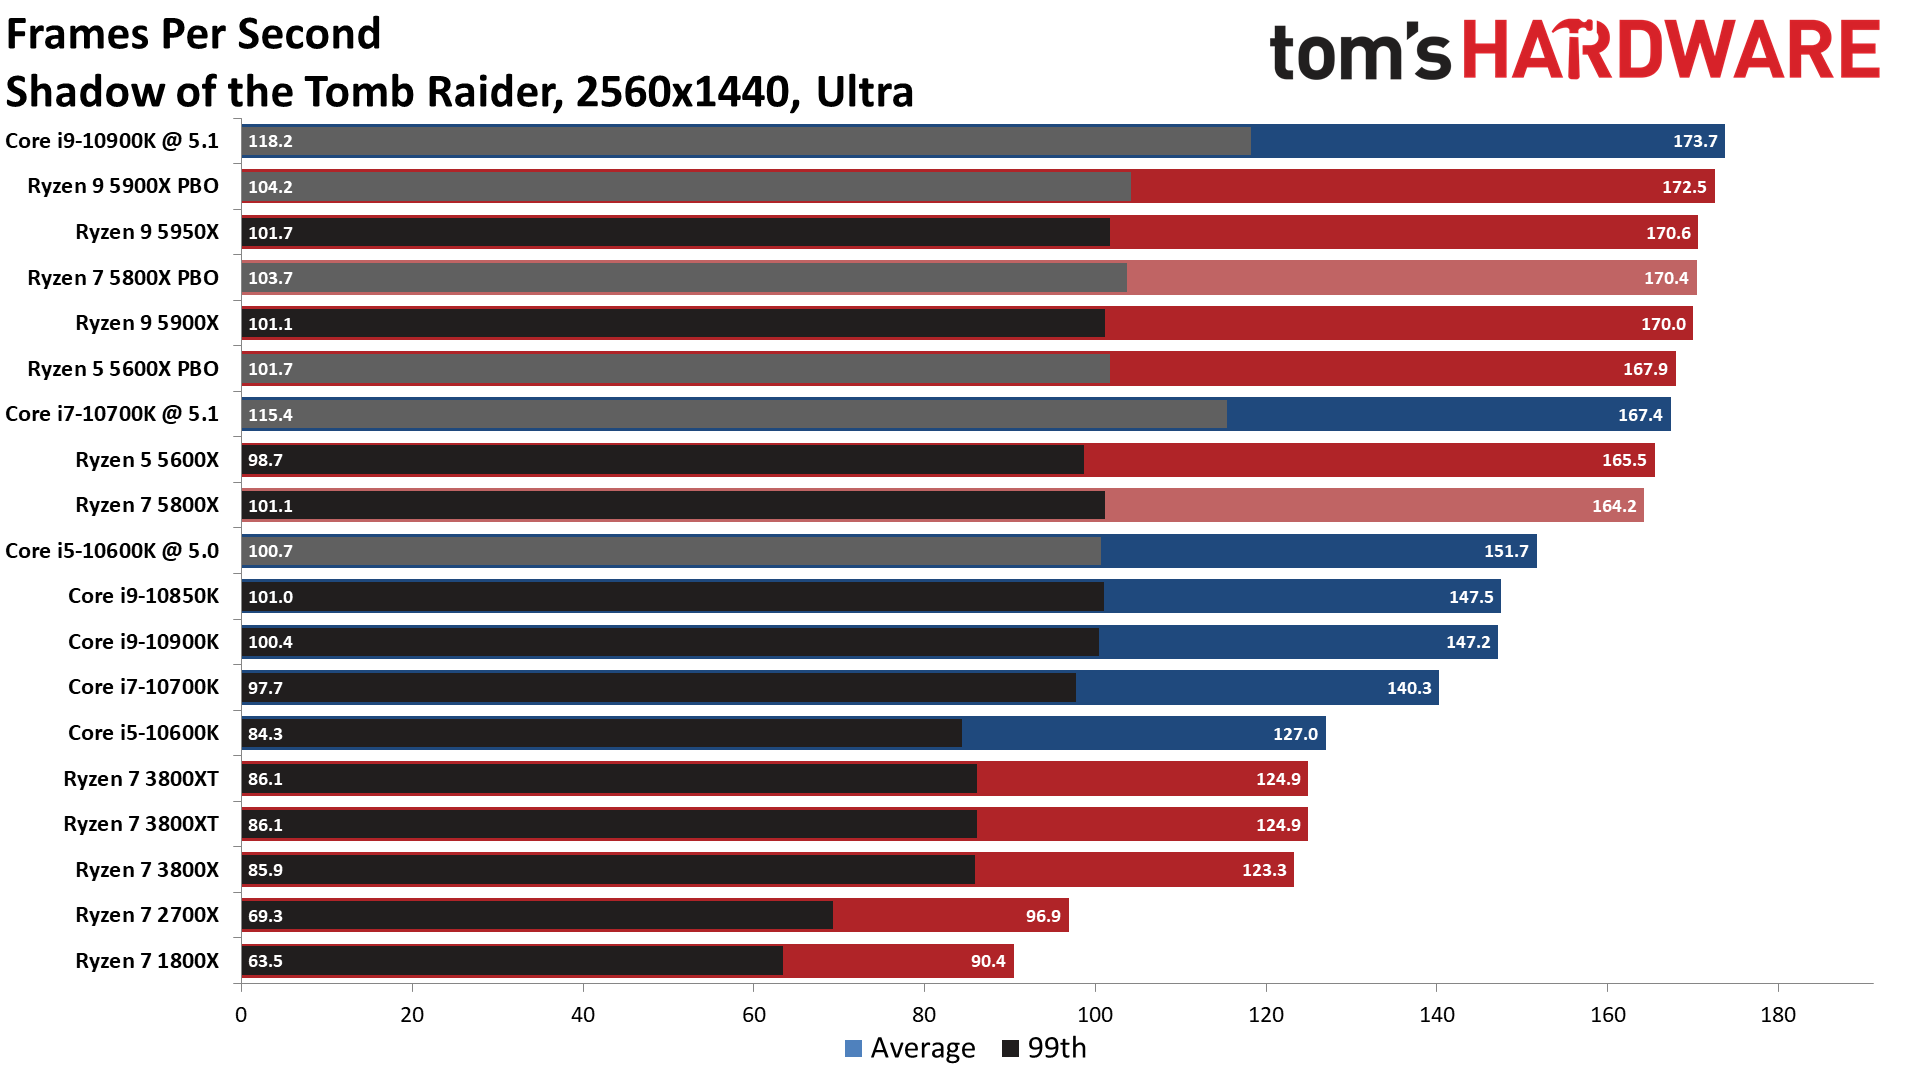
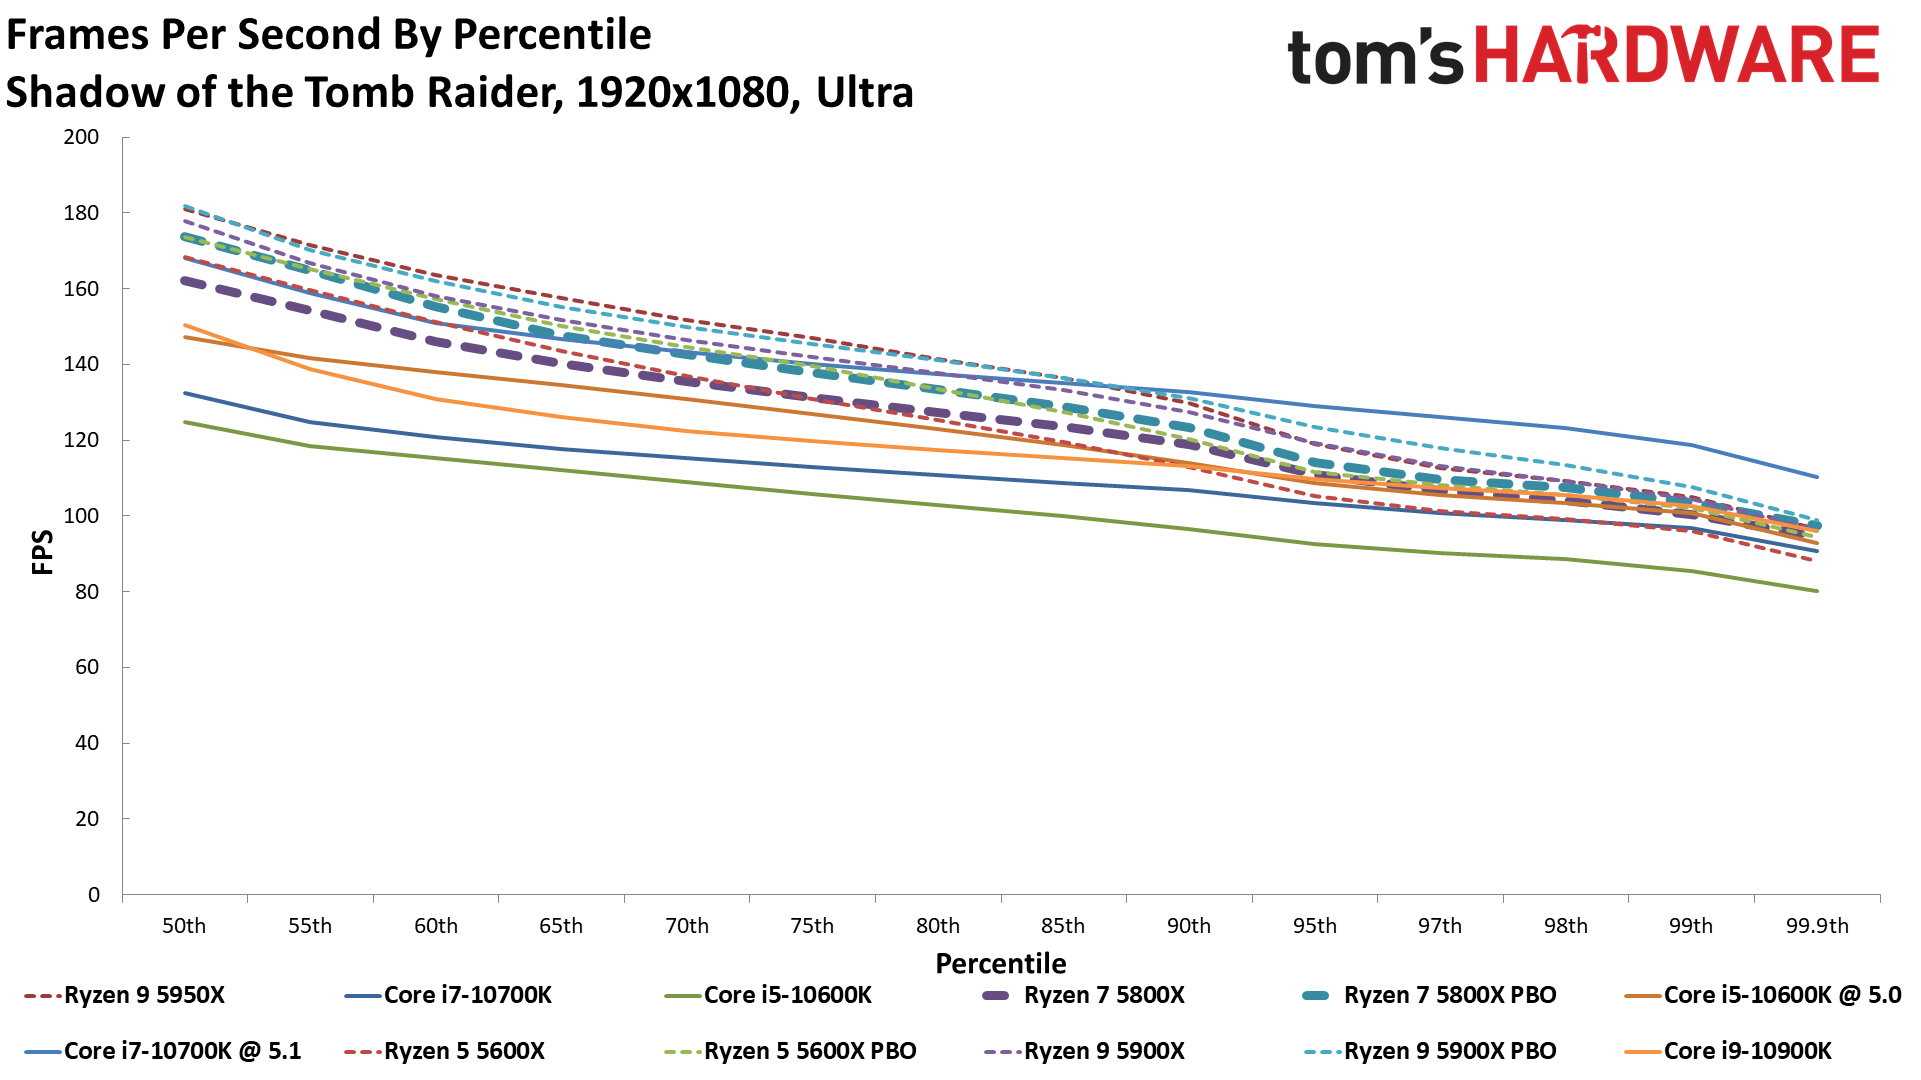
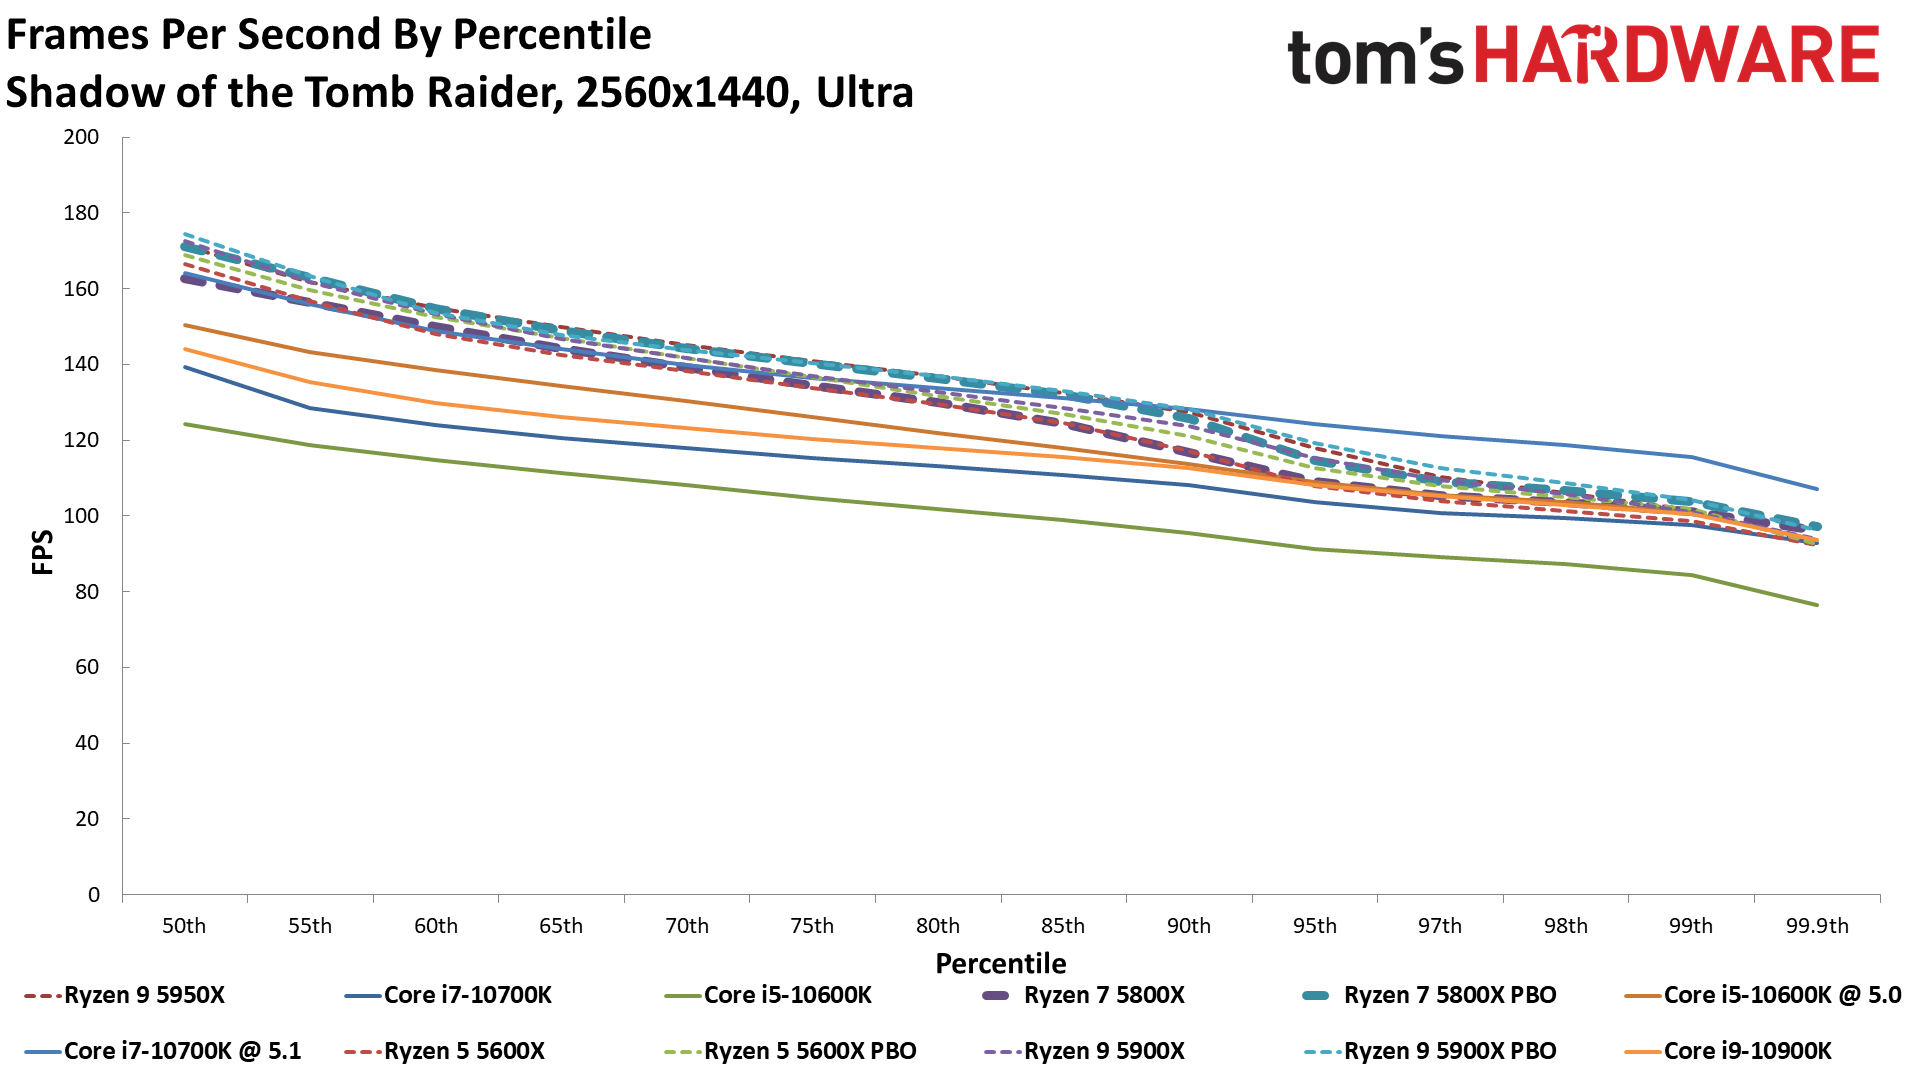
Shadow of the Tomb Raider on Ryzen 7 5800X
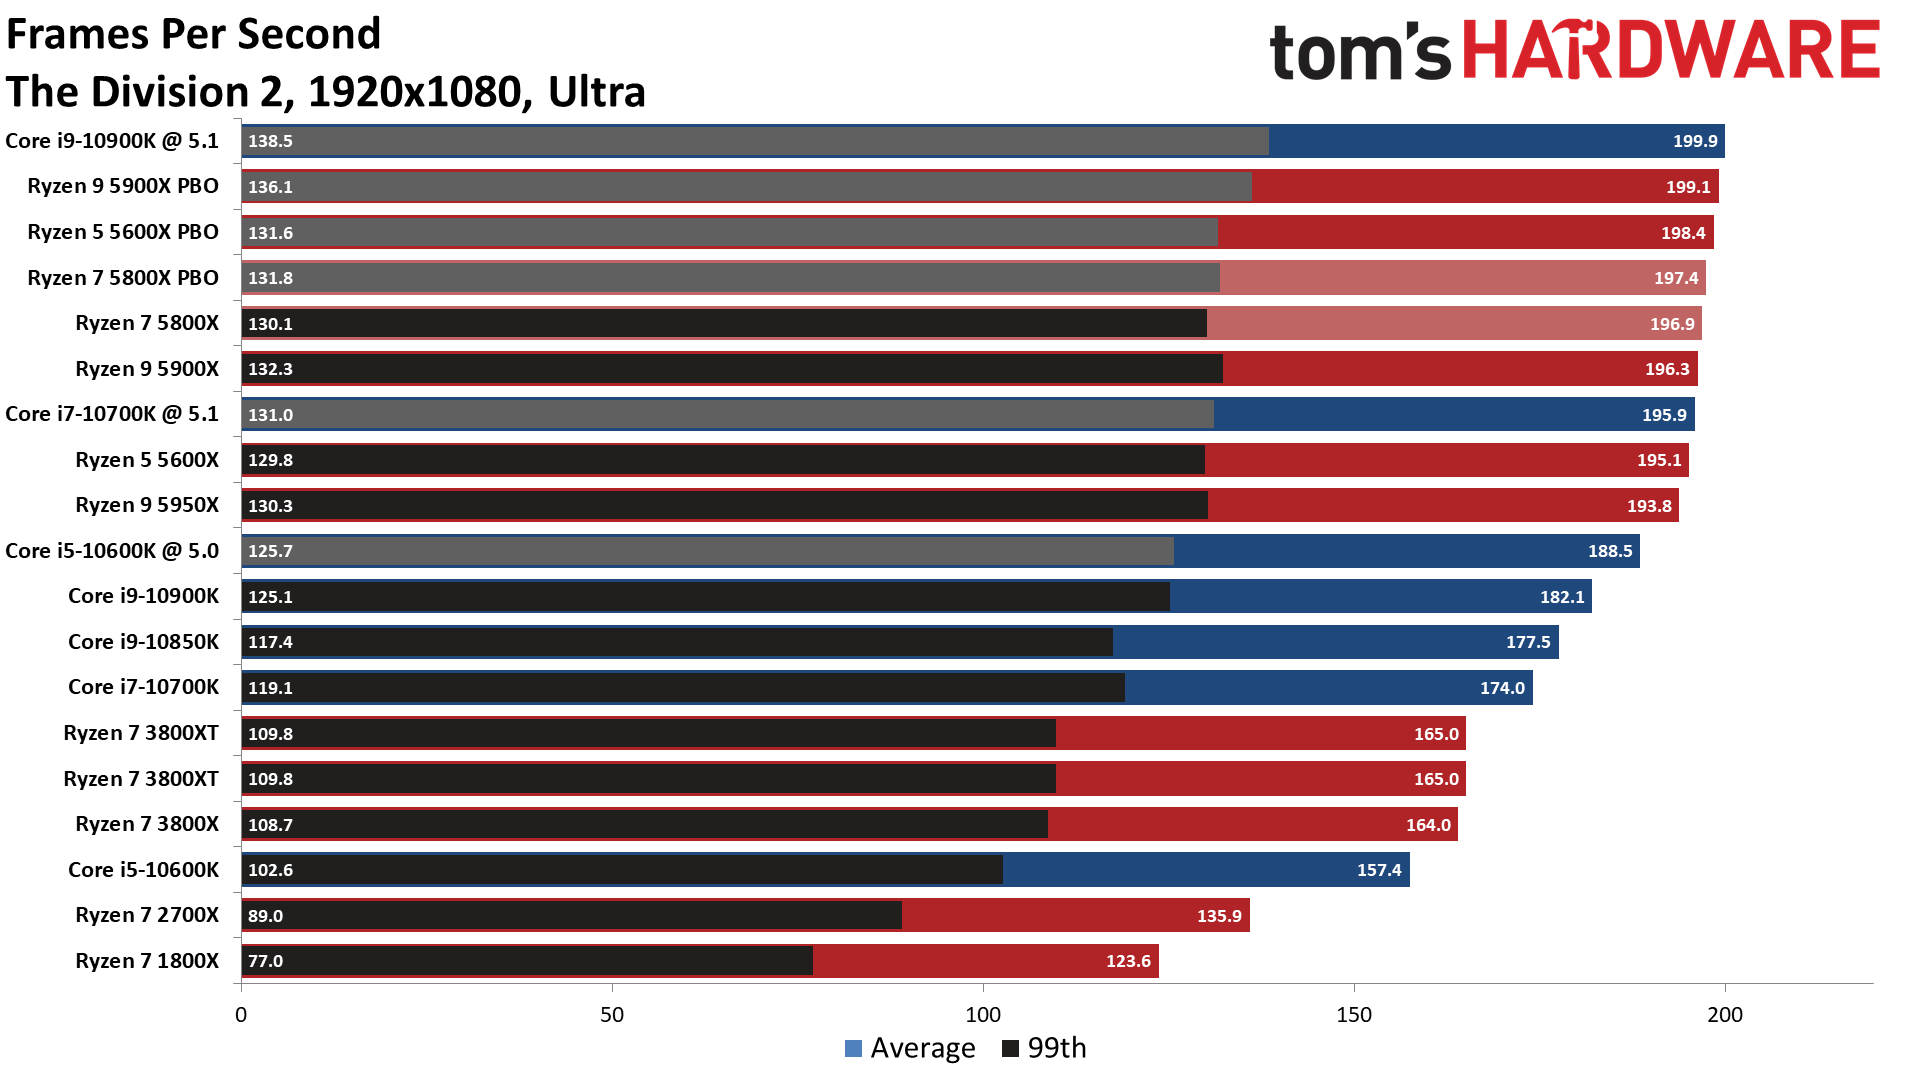
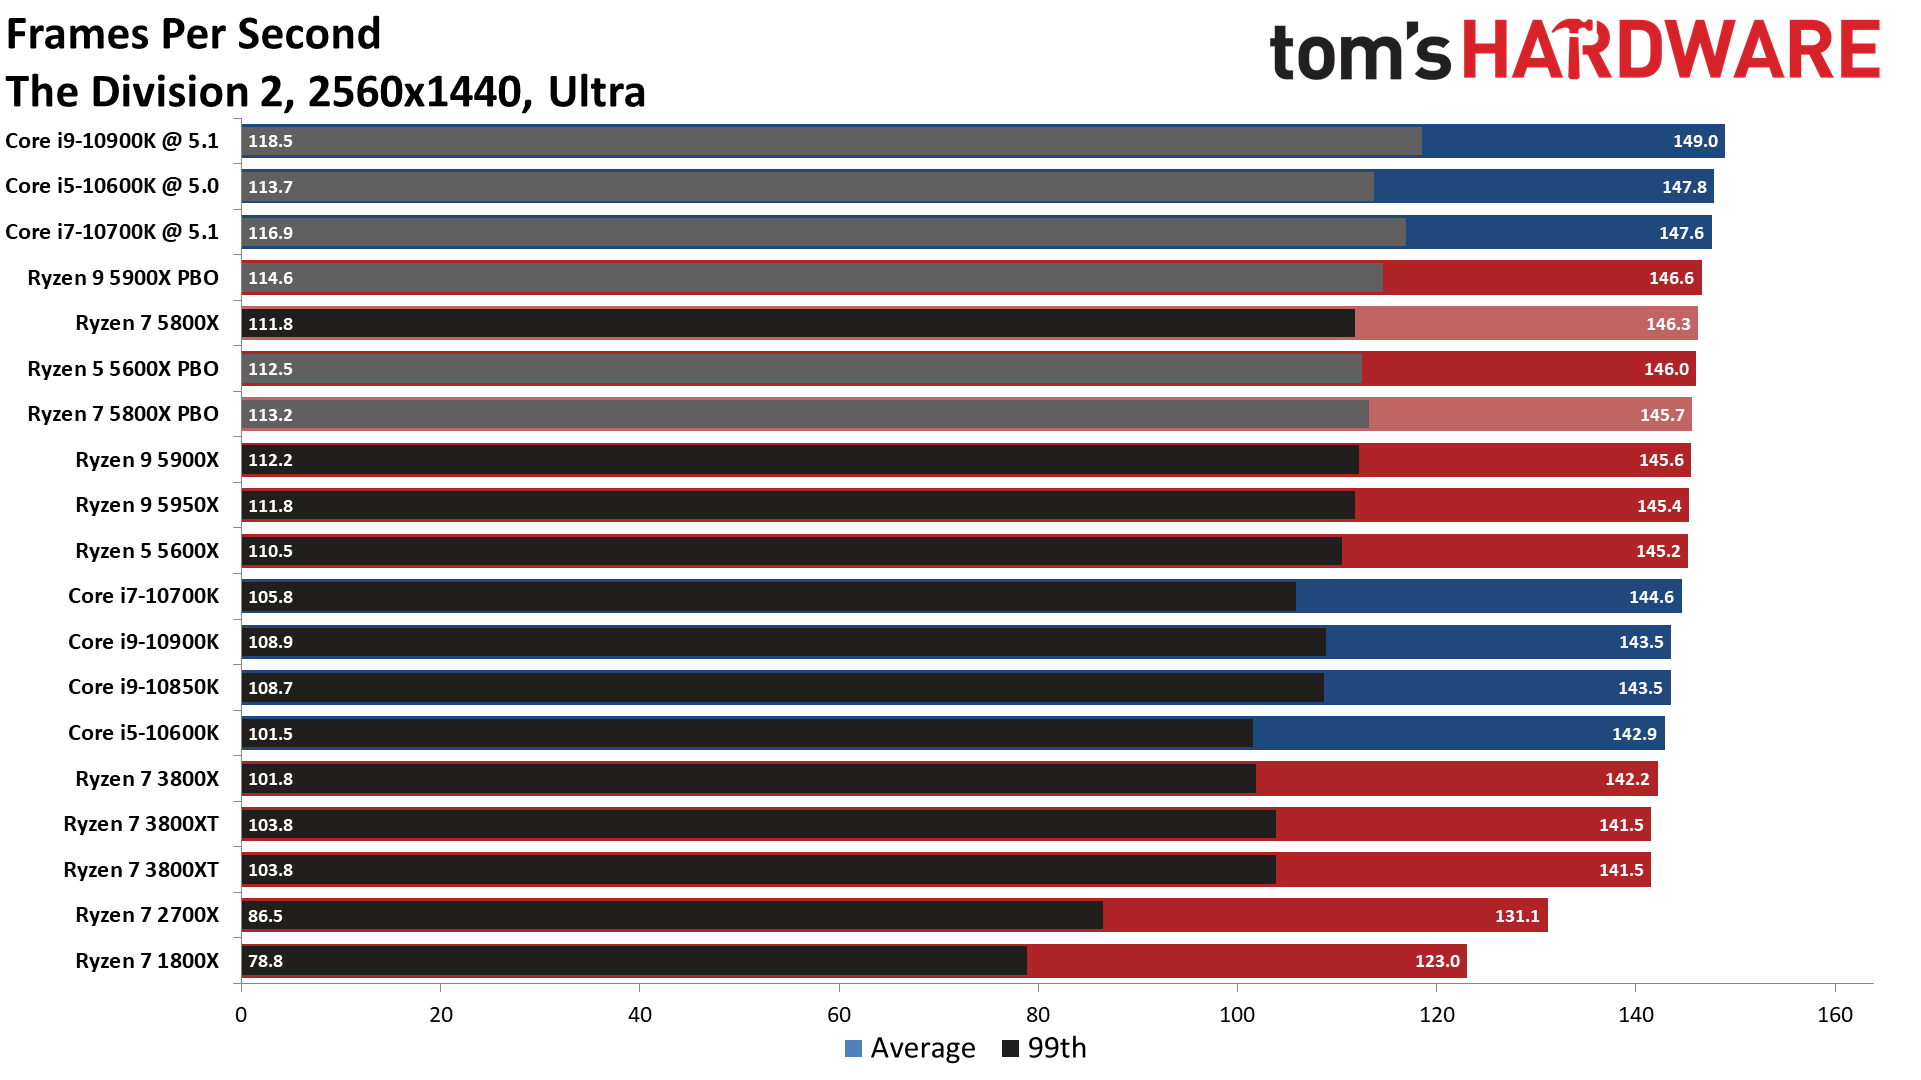
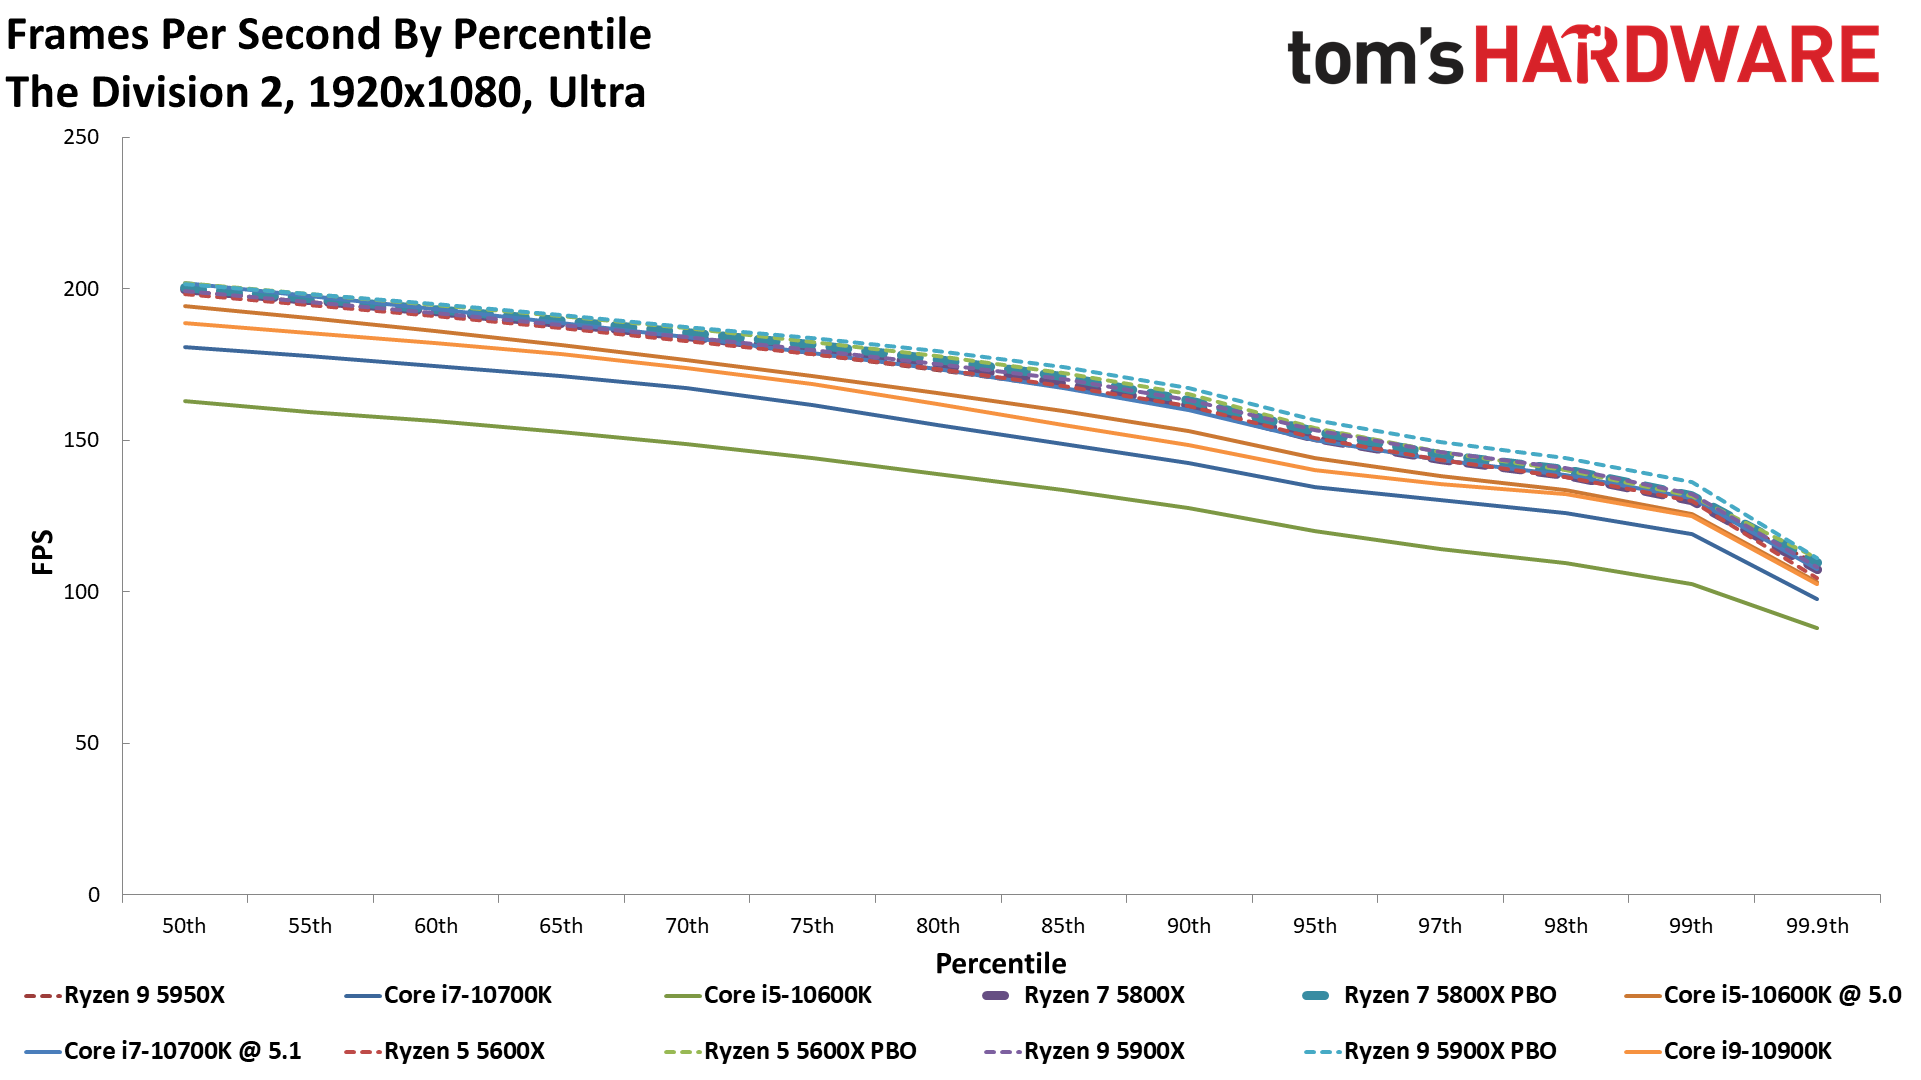
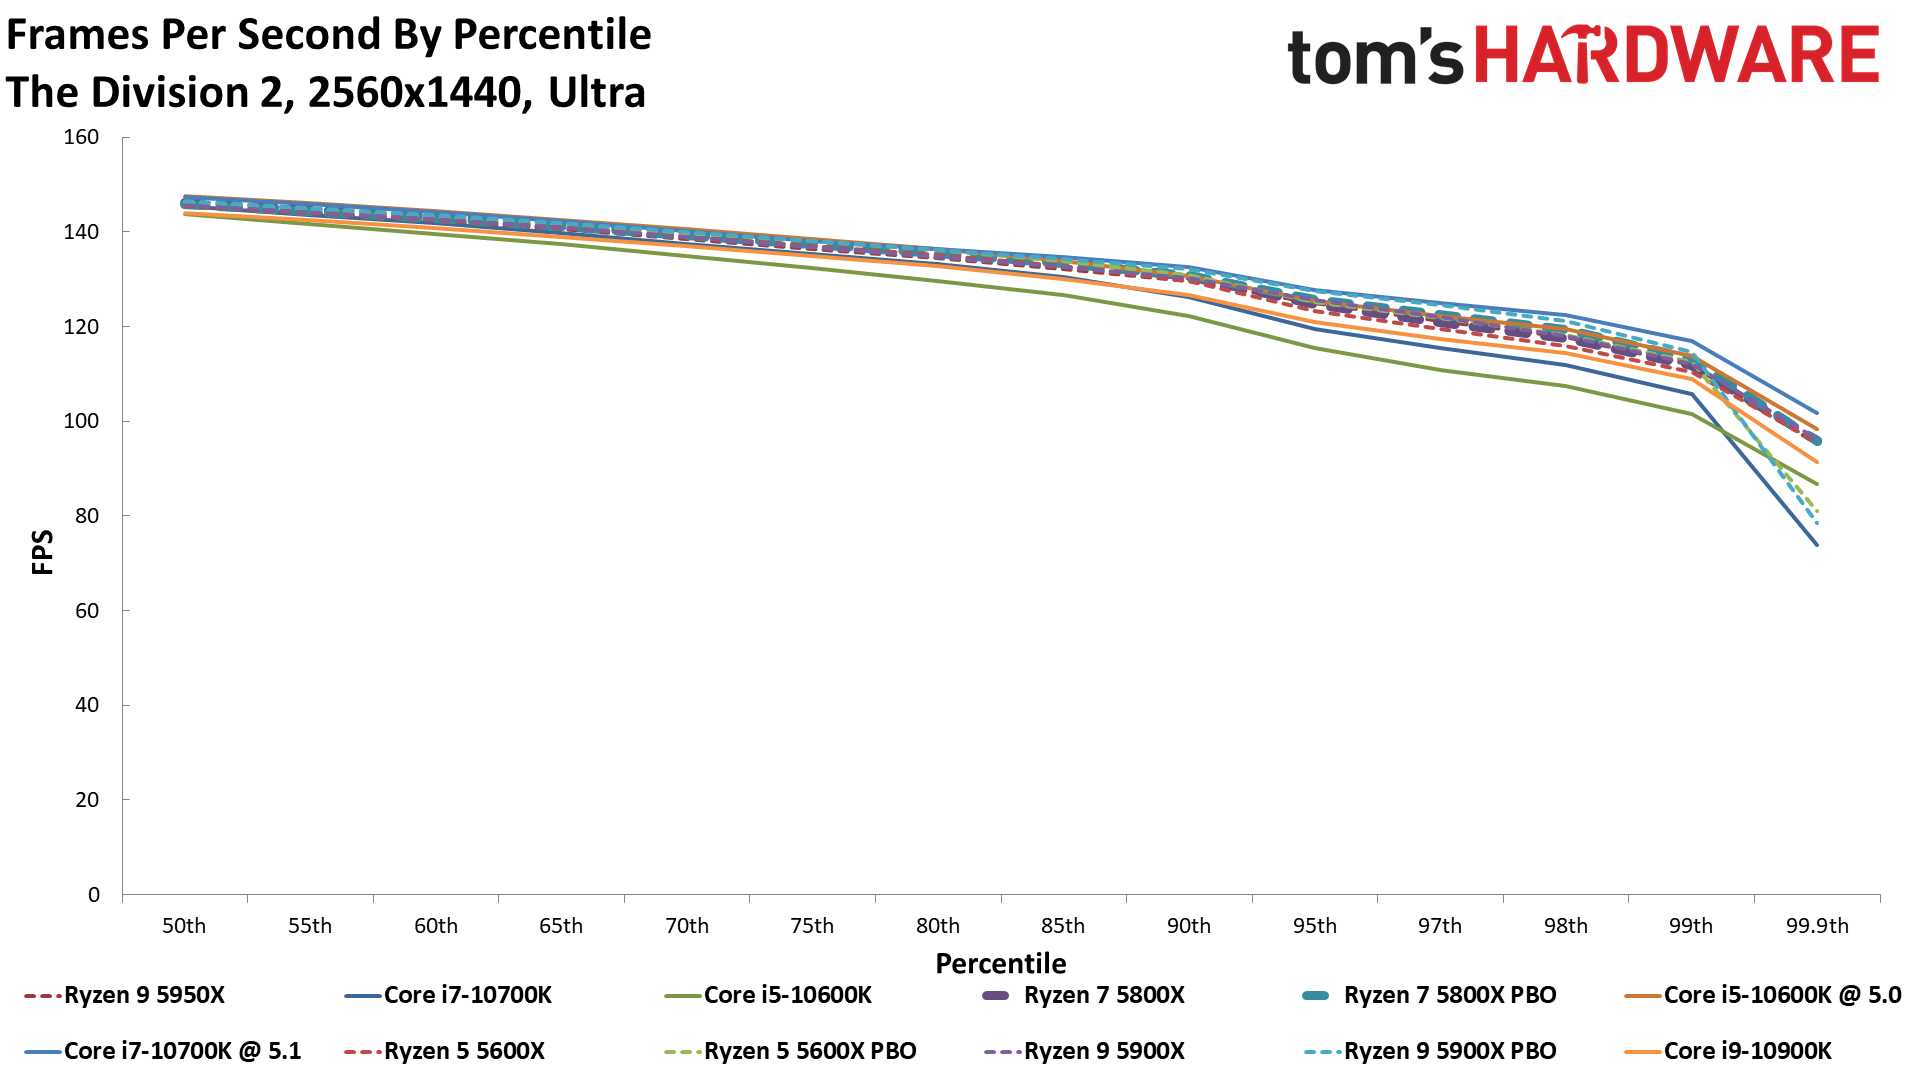
The Division 2 on Ryzen 7 5800X
MORE: Best CPUs
MORE: Intel and AMD CPU Benchmark Hierarchy Comparisons
MORE: All CPUs Content
Current page: Ryzen 7 5800X Gaming Performance
Prev Page Ryzen 7 5800X Power Consumption, Thermals Next Page Ryzen 5 5600X Application Benchmarks
Paul Alcorn is the Editor-in-Chief for Tom's Hardware US. He also writes news and reviews on CPUs, storage, and enterprise hardware.
-
Co BIY "AMD's suggested selling prices rarely manifest at retail, and continuing shortages have found Ryzen 5000 chips selling far over recommended pricing. History indicates that, given sufficient supply, AMD's processors typically retail for far less than the official price points. That makes it hard to predict how pricing will shake out over the next months as supply normalizes. "Reply
Given current market conditions I would expect both AMD and Intel to be able to sell almost everything they make at the prices they want (plus some "obscene" profits for the retailers)
Intel has been able to sell everything they make for the last few years and made tons of money despite their 10nm problems and lack of enthusiast excitement for their incremental gains.
AMD is at parity or has a small lead in performance and can demand the same prices. They probably cannot easily increase production.
AMD's history of below MSRP prices is when they were second tier products in low demand. No reason to think that will be the case going forward on either the supply or the demand side. I don't think I would try waiting for an AMD 5800XT to drop below MSRP.
OTOH - Both AMD and Intel's mid-range chips should be the real competition for their high end products. Games are GPU bound and the mid-range offerings are more than adequate for even a high-end GPU if you can find one. This article clearly points to that sweet spot. -
Phobos258 The tests that put the 5800x PBO at the top of the list show why AMD feels like they can charge what they want for this chip.Reply
Price may suck but it's more available then the rest of the fleet right now. -
purple_dragon The only problem here is the fact you can't acquire a 5000 series chip easily. Whereas, Intel chips are readily available and the I7-10700k is the most reasonable cpu at the moment unless your lucky enough to stumble upon an in stock AMD cpu. Hopefully production catches up with demand soon but it probably won't until March or April 2021.Reply -
clsmithj I'm not in a market for a CPU, my ZEN+ & ZEN2 family CPUs are enough. But if one can get AMD and NVIDIA to kick-start production again of their graphics cards. That would be great.Reply -
Friesiansam "AGAINSTPriceReply
No bundled cooler
No integrated graphics" I don't think most buyers, at this level, are going to be bothered about points 2 and 3. I certainly wouldn't be. -
Remedailjoe Everyone who's commenting negatively obviously doesnt own this chip. My single scores are insane. Hands down destroys anything in intels line up. PBO uses voltage I dont like but it maybe my mobo. Gigabyte x570 Aorus Master.. Hits 1.5volts so i disabled it and set all core 4.85ghz at 1.375volt... Shattered-Dreams #8 CpuZ validation at 5.05ghz. On cell so no link. Over 690 single core.Reply
As for ram I can easily oc my ram 3600 gskill ripjaw 4x8gb to 4200 at 1.45v cl19. Ram oc is all in the motherboard.. And using realistic timings.. -
zodiacfml The 5800x is Amd's perfect silicon, only next to the 16 core. The price is justified being way ahead of its time unlike the 5600x which is perfext for current and existing gamesReply -
mikie tim t With AMD constrained from TSMC, they need to get as much money as they can with the wafers they get. They will have no shortage of I/O dies as they are 12nm from Global Foundries, so it makes absolute business sense to get as much money right now as they can with the inputs they have available, which means that 5800X is going to be what they push out the doors until they have enough lower quality chiplets to boost production of 5600X and 5900X, respectively. I was able to get a 5800X from the Overland Park, KS MicroCenter at MSRP, and it has been a night and day difference in responsiveness on everything over the 3600X it replaced, which wasn't particularly slothful. I don't feel shortchanged at all, quite frankly. I hope AMD can pull as much market share as possible from Intel these next few quarters, because that's what it will take to move both companies to better execution, to the benefit of us all.Reply -
mrv_co I get the argument on paper that the 5800x is overpriced, but that argument has been strictly an intellectual one to date. I also don't doubt that once supply finally outpaces demand, the street price will adjust accordingly. Regardless, bring on the 5700x for my SFF upgrade!Reply