
Why you can trust Tom's Hardware Our expert reviewers spend hours testing and comparing products and services so you can choose the best for you. Find out more about how we test.
AMD Ryzen 9 7950X3D Power Consumption and Efficiency
| Header Cell - Column 0 | 65W TDP | 105W TDP | 120W TDP (X3D) | 170W TDP |
|---|---|---|---|---|
| Socket Power (PPT) Watts | 88W | 142W | 162W | 230W |
| Peak Current (EDC) Amps | 150A | 170A | 180A | 225A |
| Sustained Current (TDC) Amps | 75A | 110A | 120A | 160A |
AMD defined new TDP ranges with the debut of Zen 4 and the AM5 platform. All three Ryzen 7000X3D chips have their own new category — the 120W entry in the table above. This means the flagship 7950X3D operates in a much lower power and thermal envelope than the standard Ryzen 9 7950X. That's evident in our power testing.


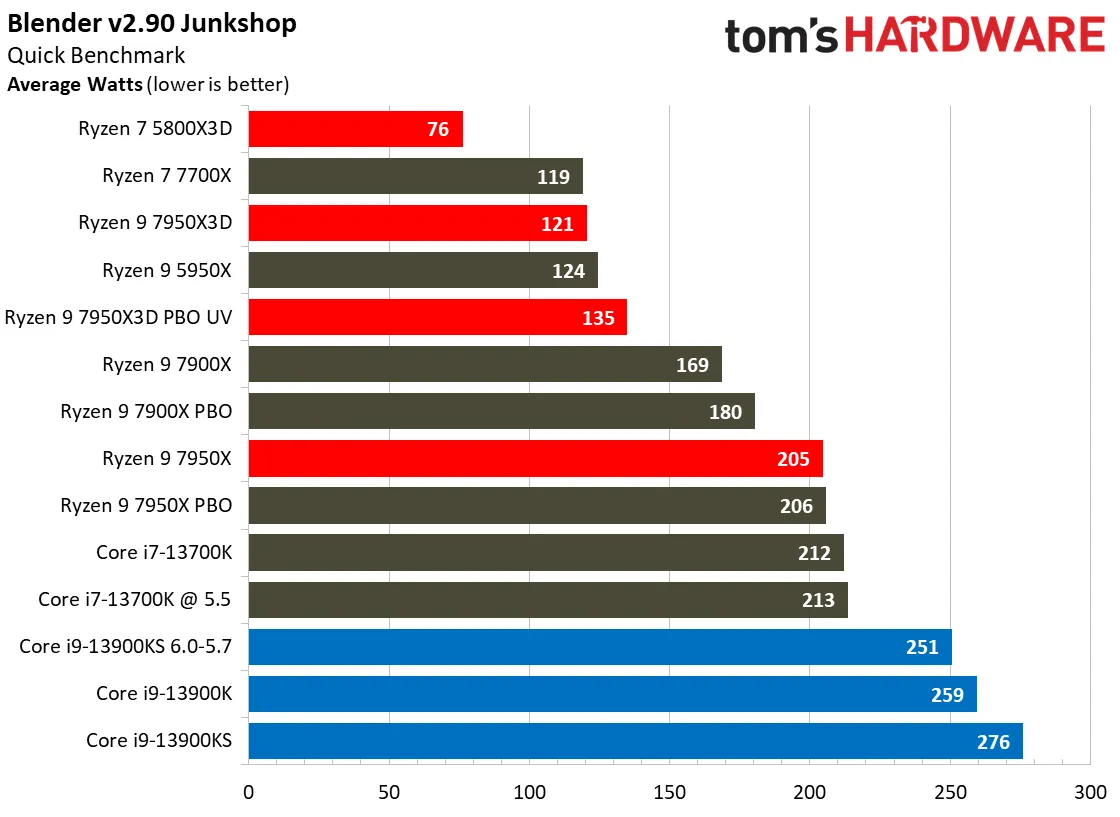


AMD's Ryzen chips have excellent power and efficiency metrics, but the Ryzen 9 7950X3D is even more efficient because it has a lower 120W TDP rating. This means the chip is similar to a 7950X operating slightly above the 105W Eco Mode.
Ryzen’s Eco Mode allows you to downshift AMD processors into lower TDP envelopes with a single click in the BIOS or Ryzen Master software, thus yielding lower power consumption and heat. This also improves efficiency tremendously. We can see those same benefits reflected in the 7950X’s Handbrake renders-per-watt efficiency metric, which blows past the standard 7950X and the rest of the competition by a large margin.
We also experimented with enabling the auto-overclocking PBO in tandem with undervolting (listed as PBO UV in the charts), and you can see the impressive reduction in power consumption across a few of these power measurements. Remember, the undervolted configuration is often faster than the standard 7950X config in some of these benchmarks. You’ll see that in our productivity application testing on the following pages.
Our highest average power measurement for the 7950X3D weighed in at 149W, showing that the chip often runs below its official 162W peak power rating (PPT).


Here we take a slightly different look at power consumption by calculating the cumulative energy required to perform x264 and x265 HandBrake workloads, respectively. We plot this 'task energy' value in Kilojoules on the left side of the chart.
These workloads are comprised of a fixed amount of work, so we can plot the task energy against the time required to finish the job (bottom axis), thus generating a really useful power chart.
Bear in mind that faster compute times, and lower task energy requirements, are ideal. That means processors that fall the closest to the bottom left corner of the chart are the best. After the impressive performance in the renders-per-day power efficiency metric, it’s no surprise to find the Ryzen 9 7950X3D flaunting an excellent blend of power and performance — the chip consumes far less cumulative energy than the others yet still delivers competitive performance.
- MORE: Best CPU for gaming
- MORE: CPU Benchmark Hierarchy
- MORE: Intel vs AMD
- MORE: How to Overclock a CPU
