Why you can trust Tom's Hardware
AMD Ryzen 9 7950X3D Productivity Benchmarks — The TLDR:
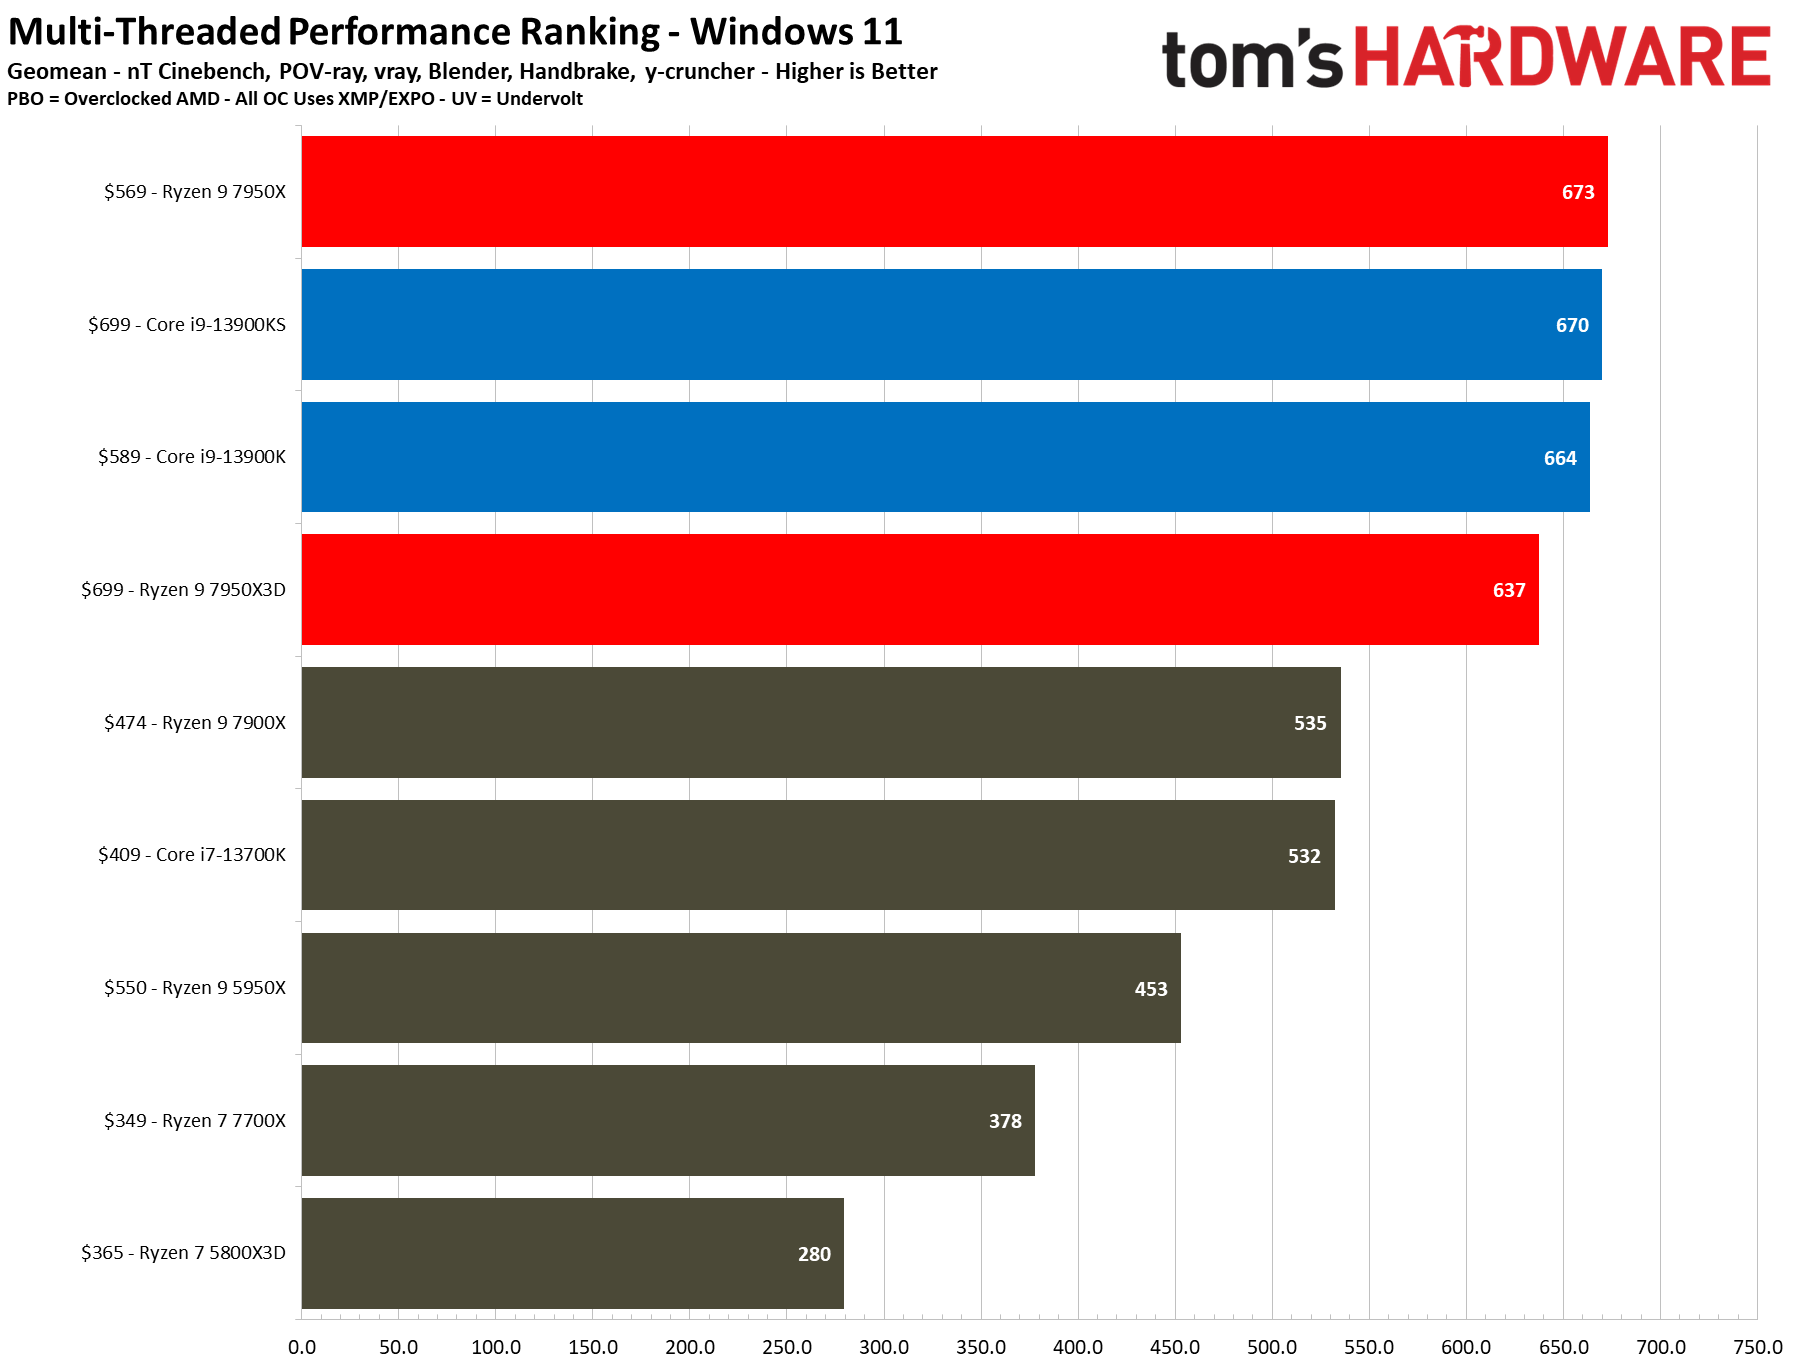
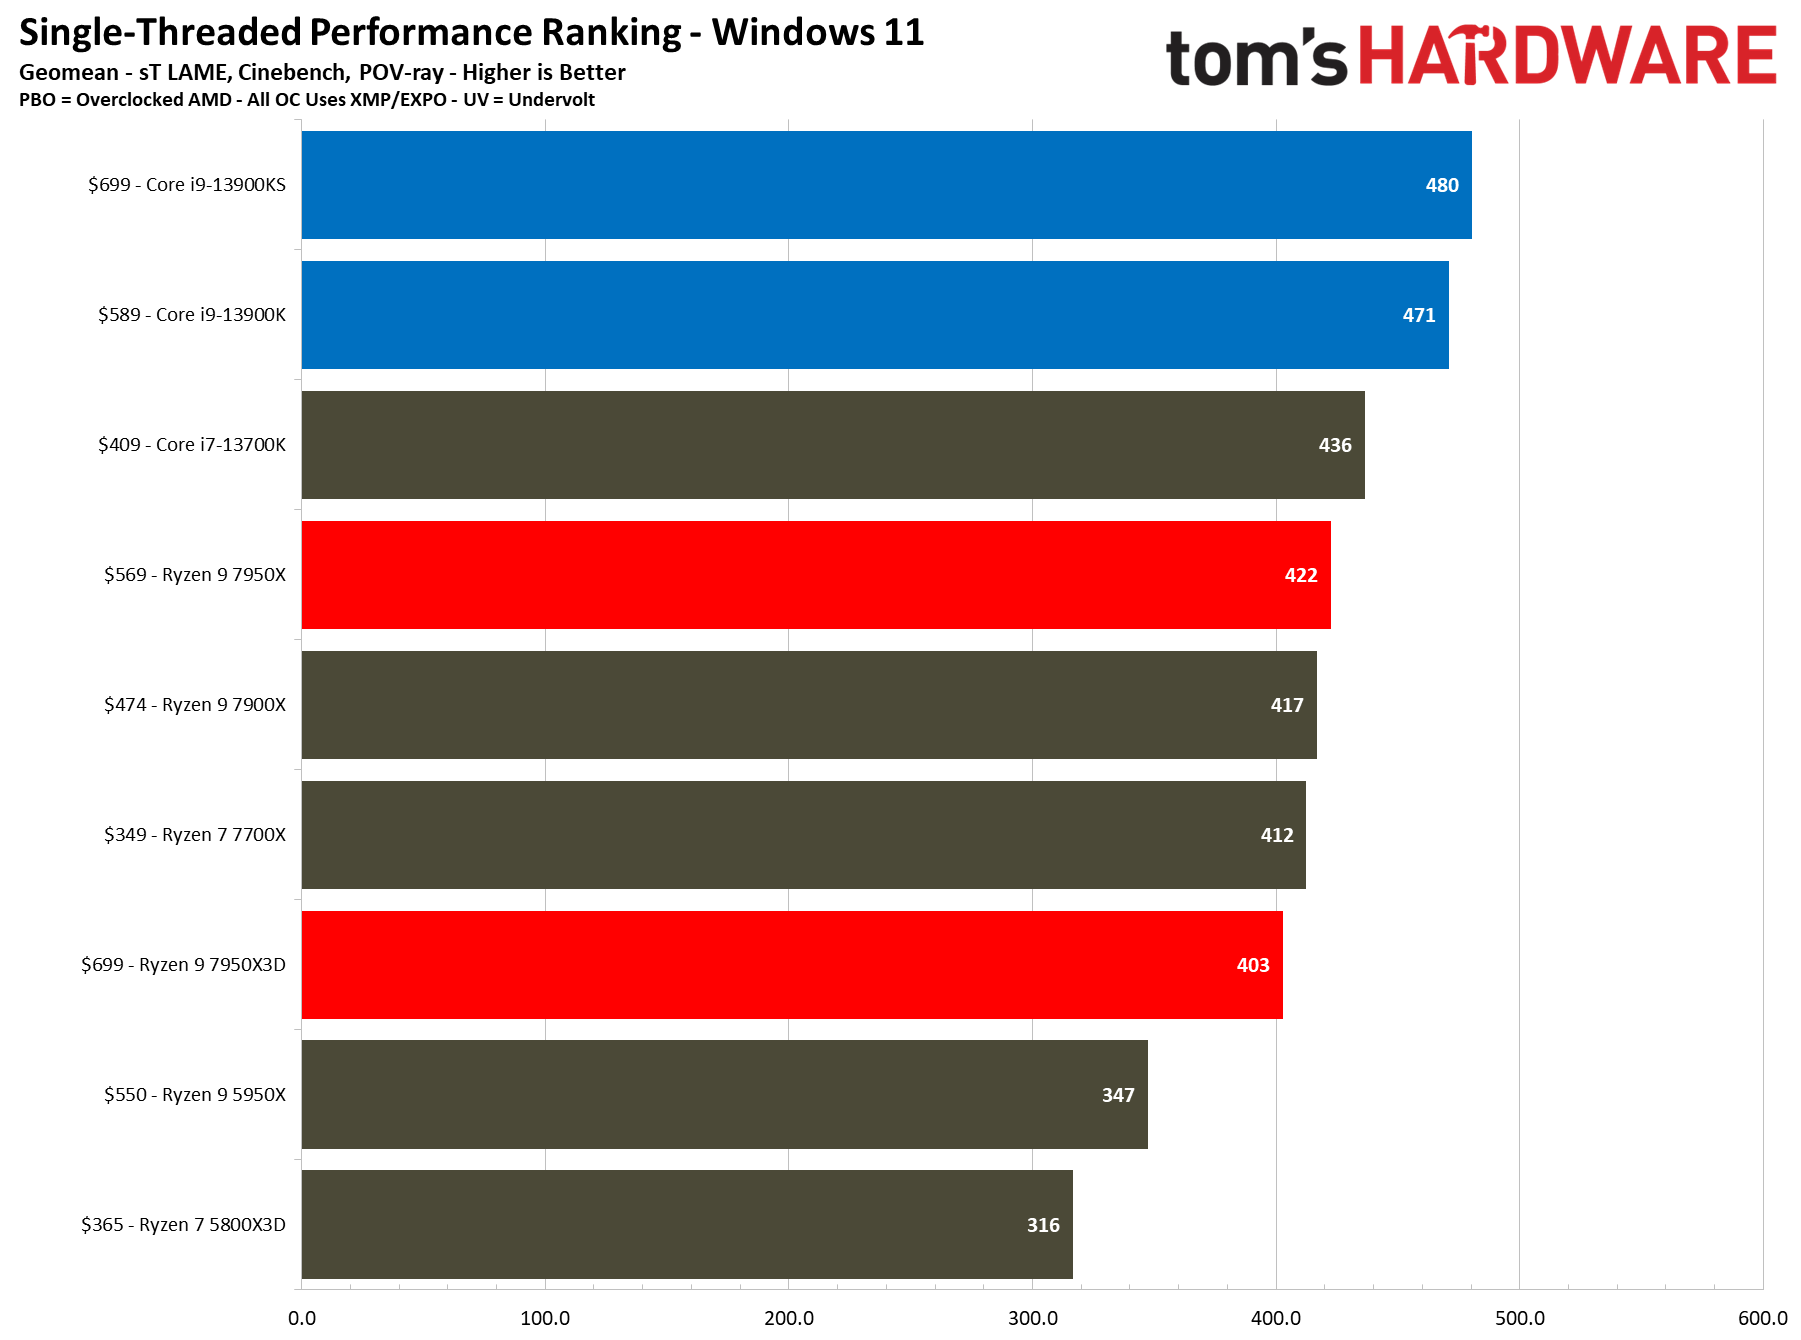
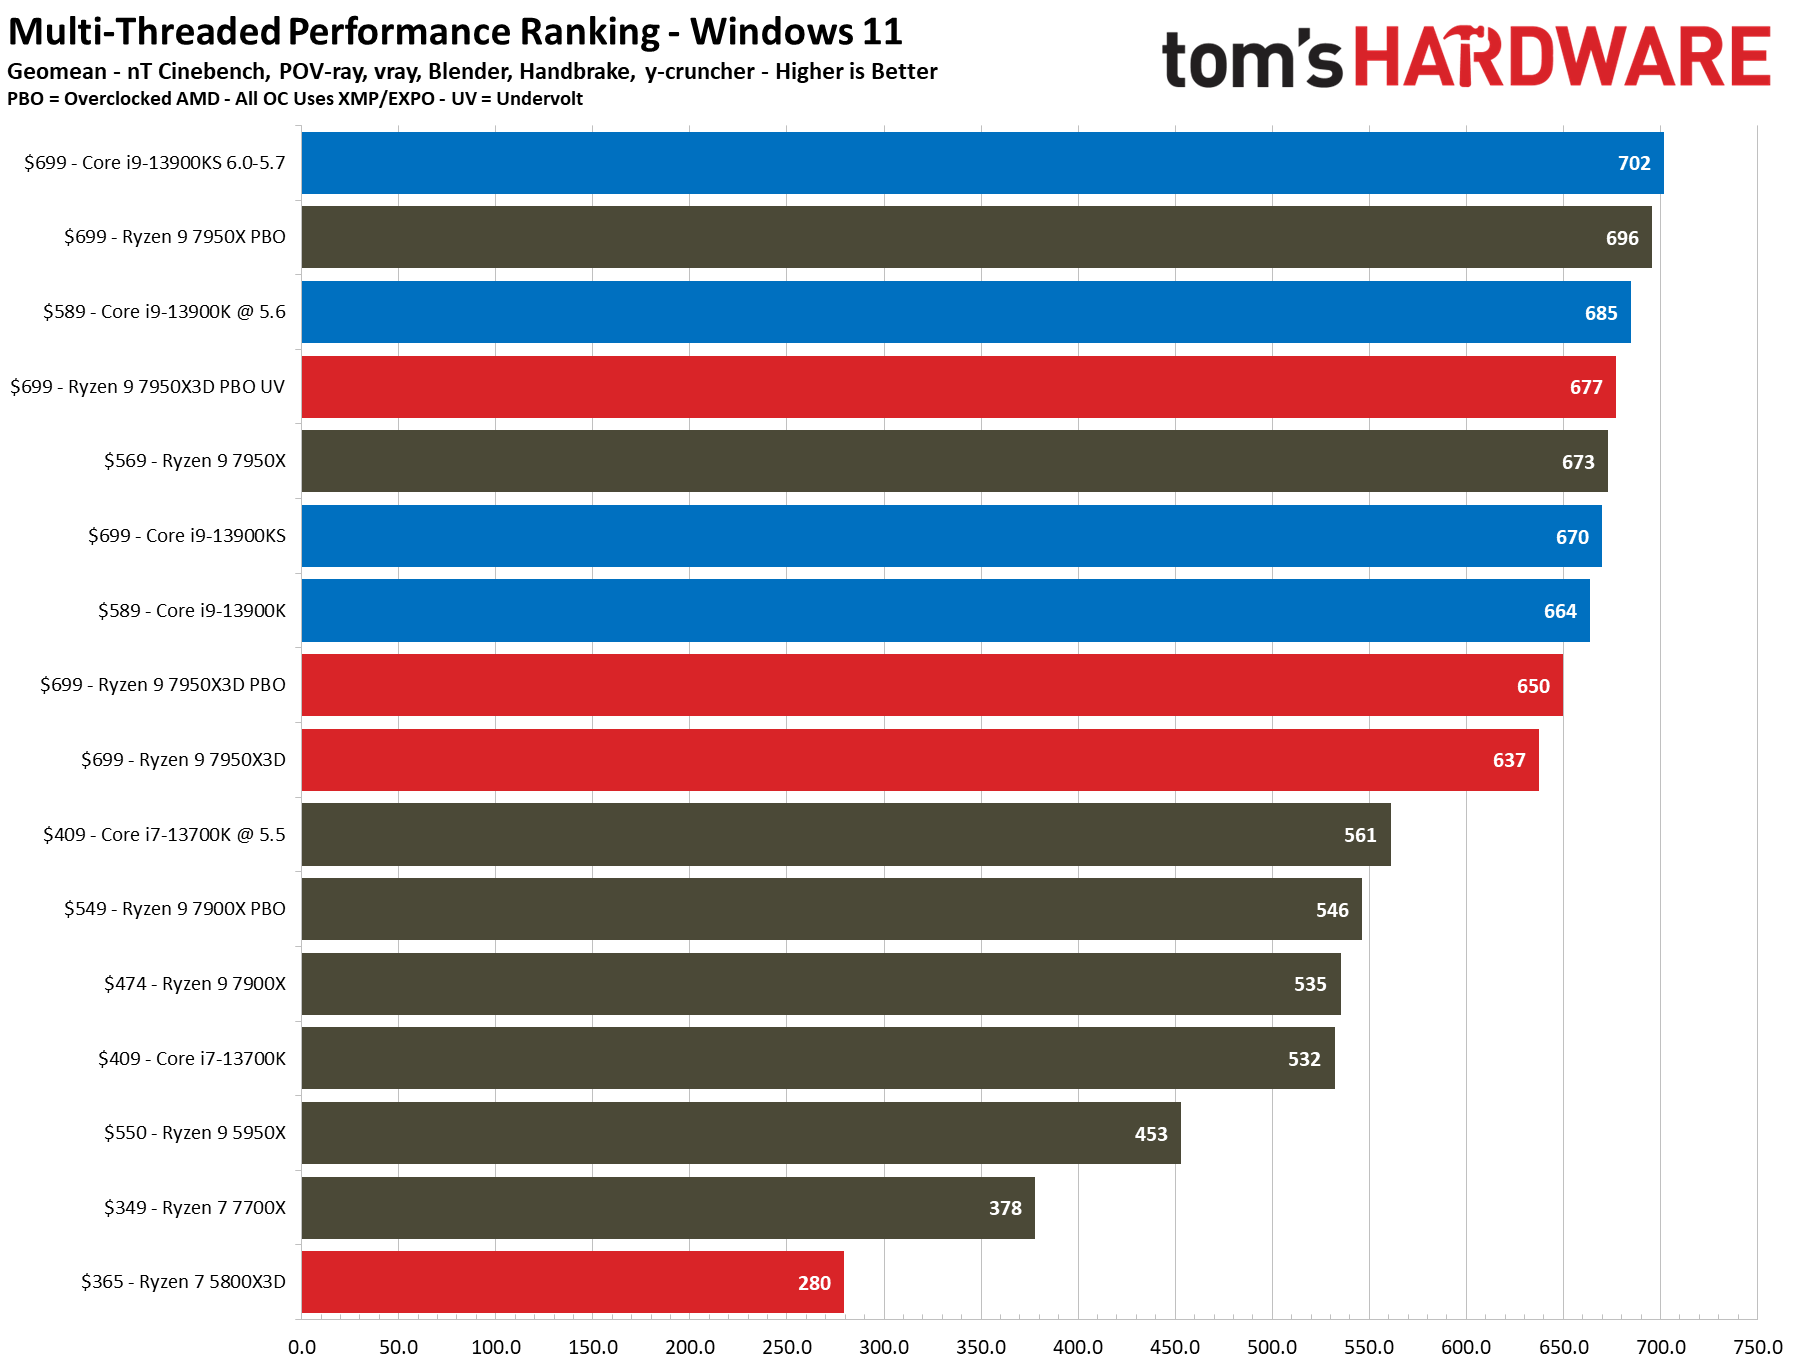
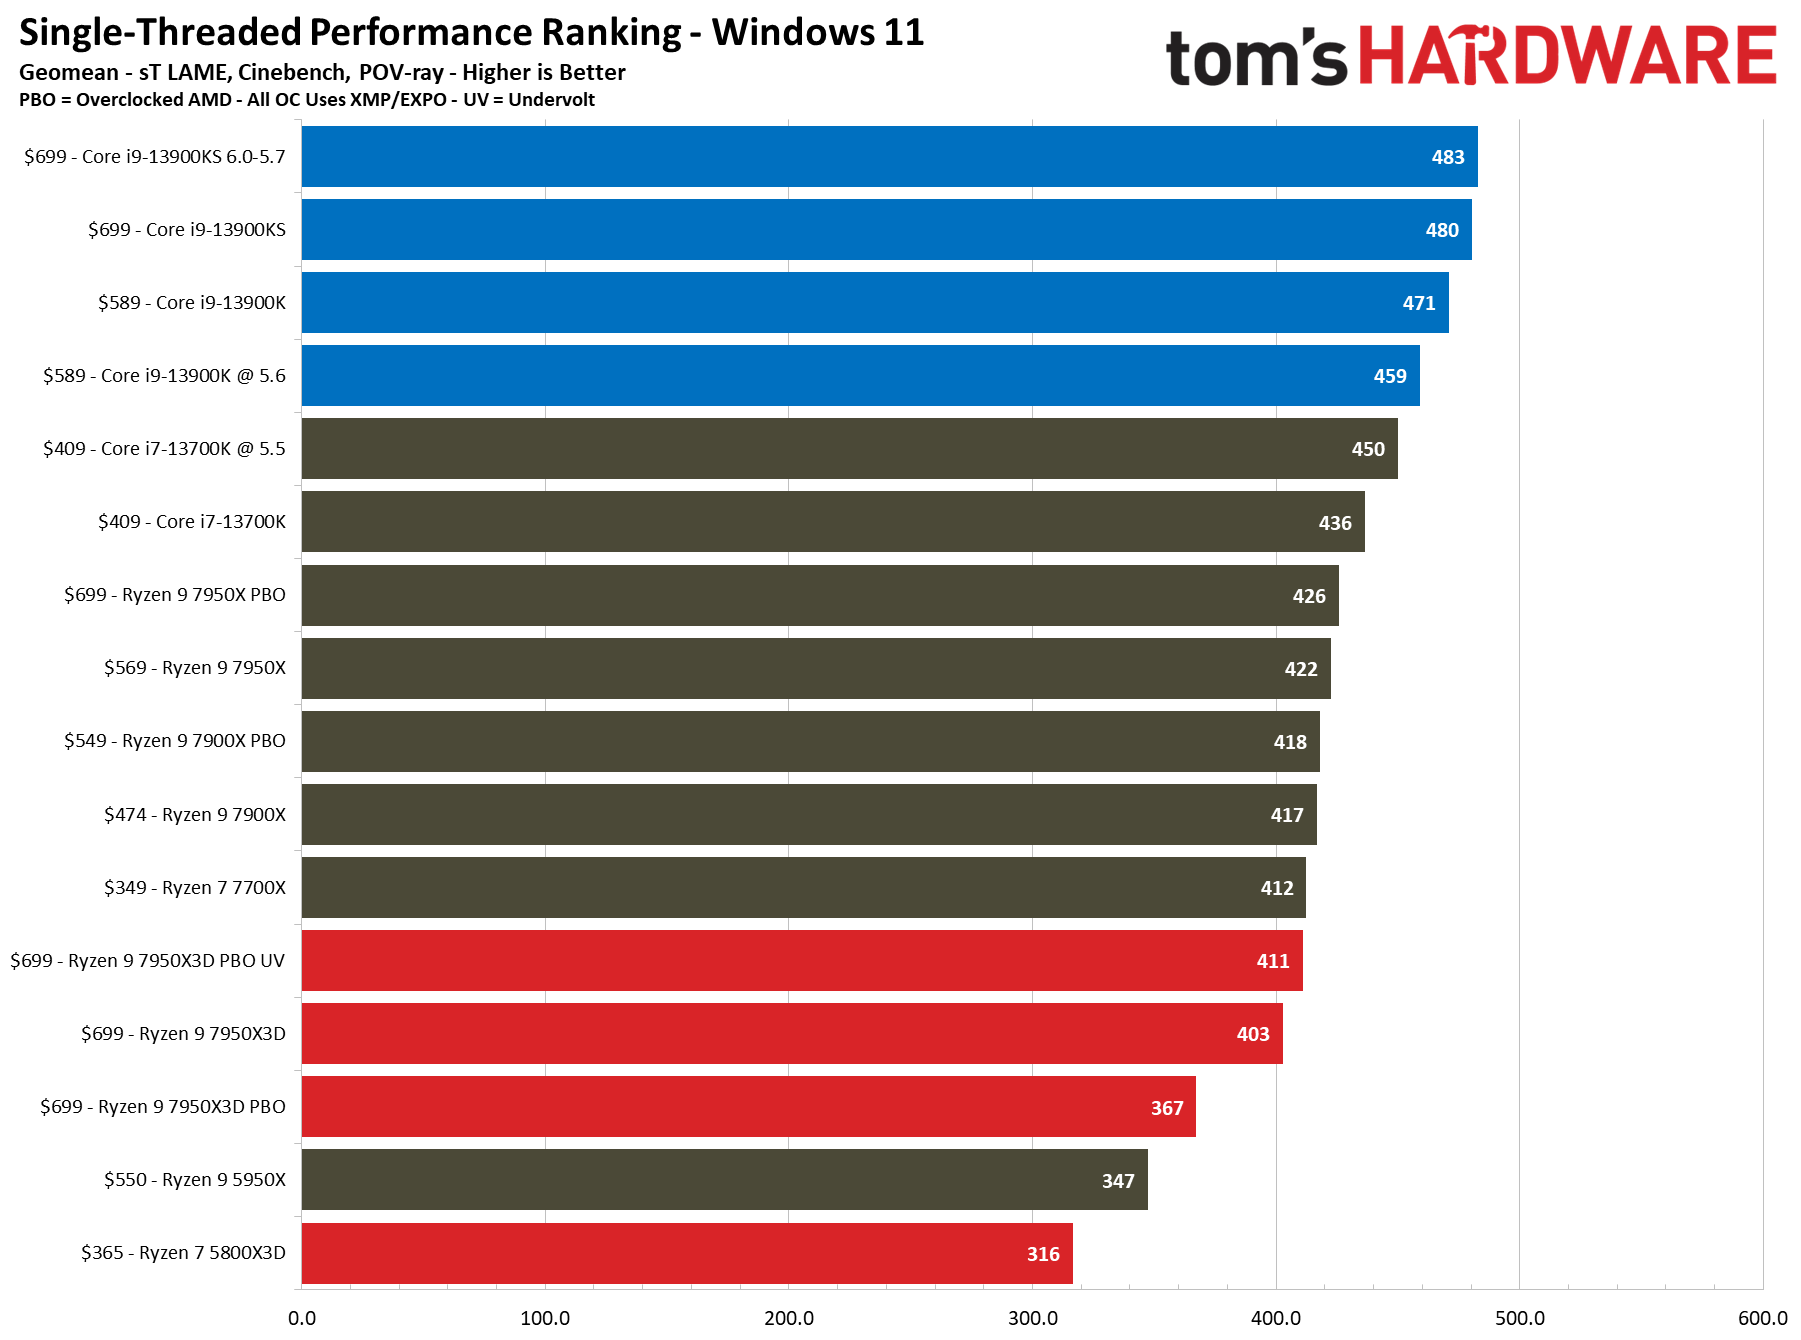
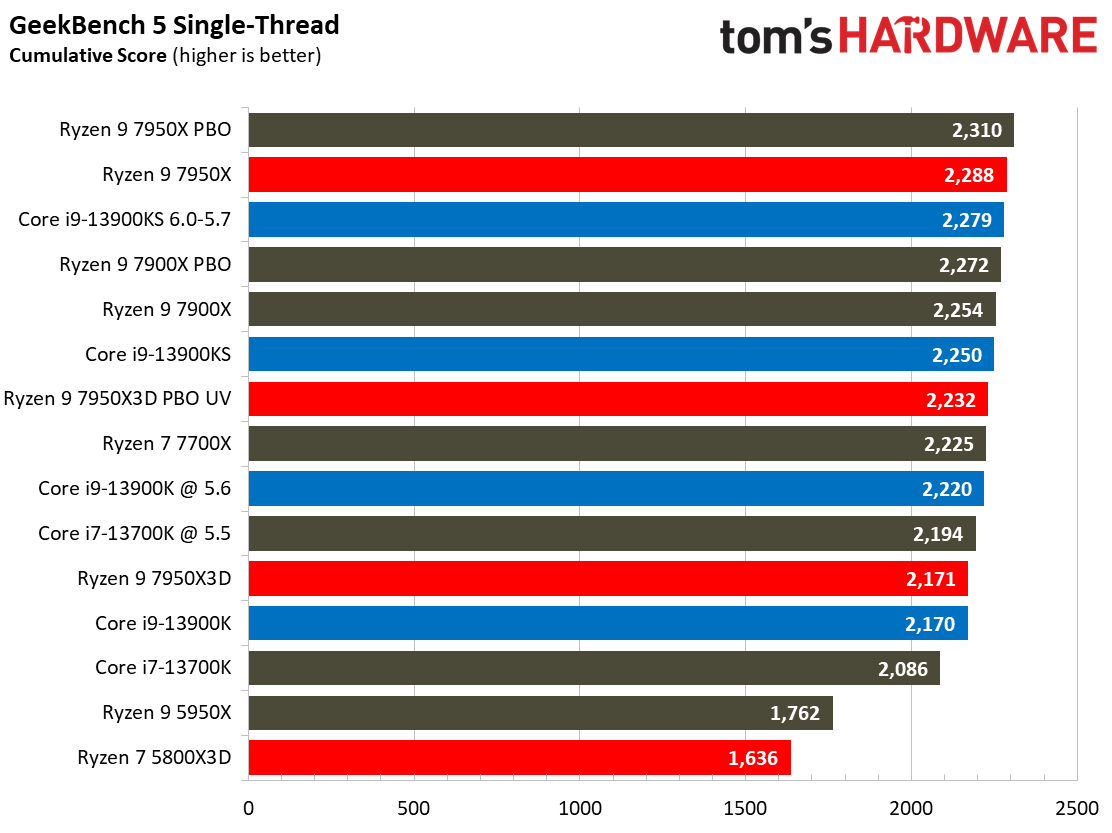
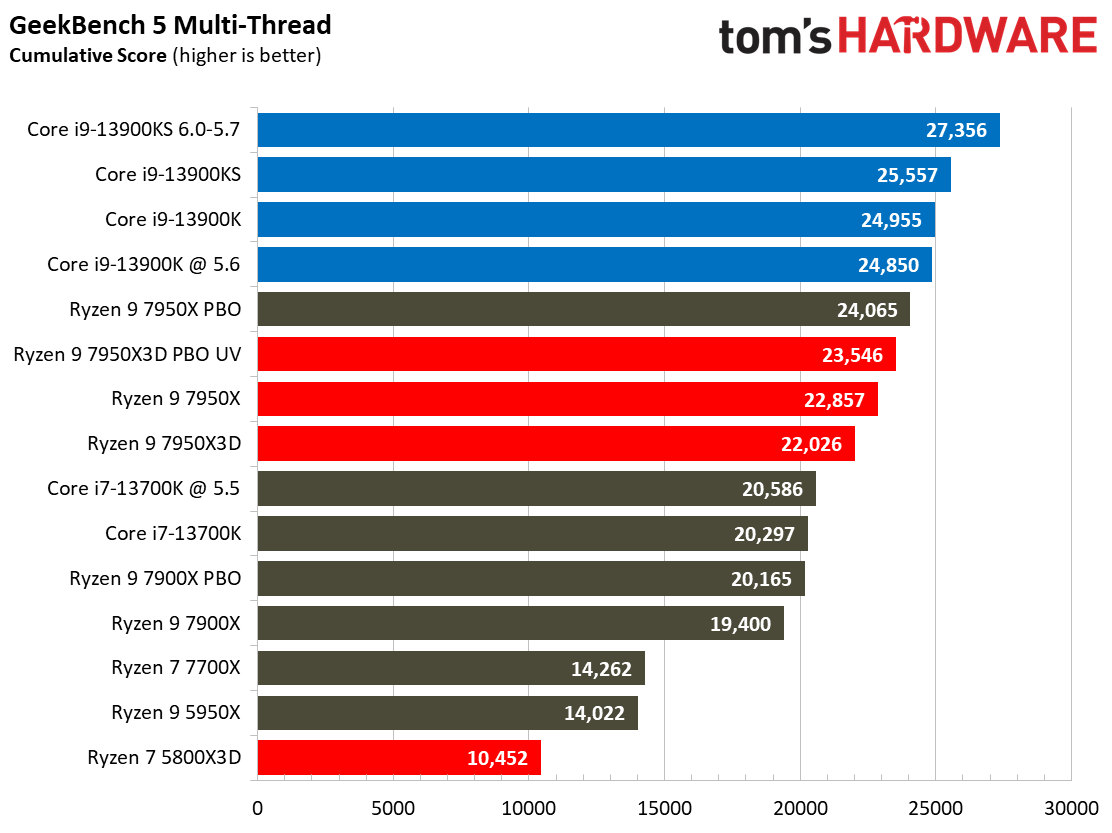
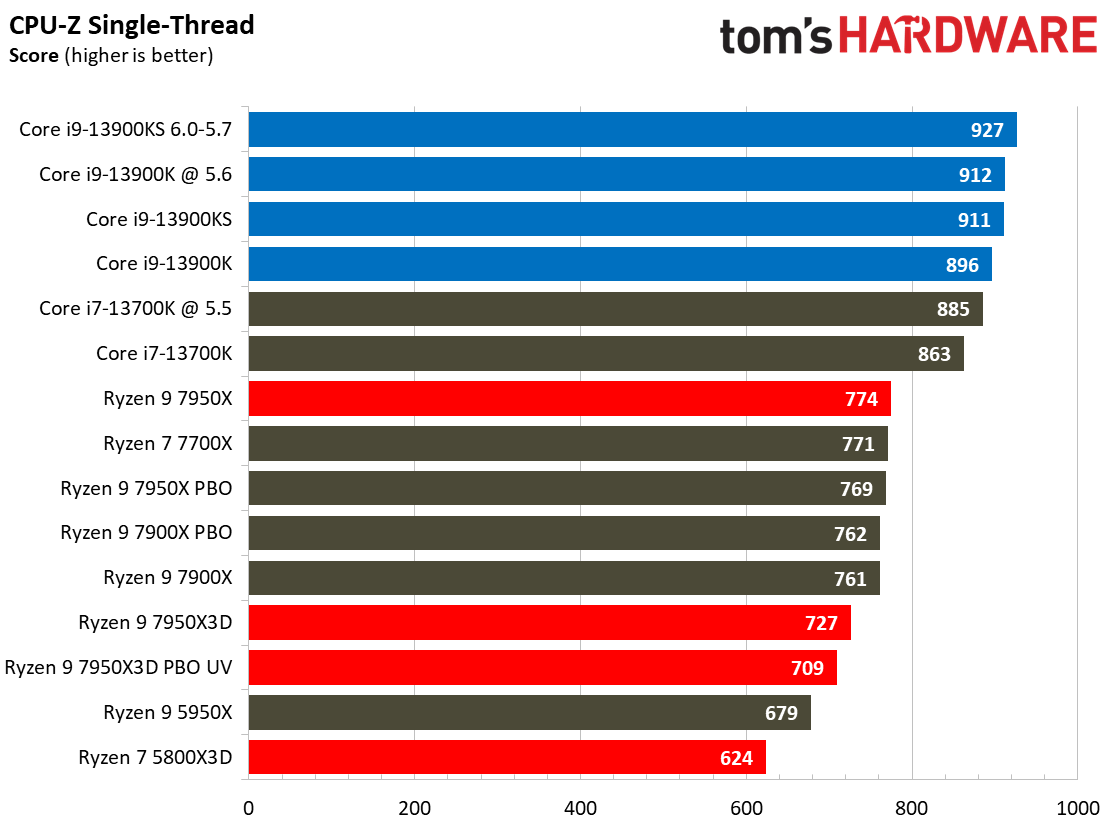
The first slides are simplified without the overclocking configs, while the remainder contains the full roster of tested configurations. We boil down productivity application performance into two broad categories: single- and multi-threaded. These slides show the geometric mean of performance in several of our most important tests in each category, but be sure to look at the individual benchmark results below.
We expect the Ryzen 9 7950X3D to lose some performance compared to the 7950X due to its lower power thresholds. We see that play out right away — the Ryzen 9 7950X is 6% faster than the 7950X3D in this cumulative measure of threaded applications, and 5% faster in single-threaded work. That’s comparable to the 5800X’s 7% advantage in single-threaded work over the previous-gen 5800X3D, but the loss in threaded work is more severe than the 1% loss we saw with the 5800X3D.
On paper, we’re looking at a 68W peak power reduction (42% less) for the 7950X3D compared to its vanilla 7950X counterpart. In contrast, the 5800X/3D maintained the same 105W TDP limit for both the 3D V-cache and non-V-Cache variants, though real-world measurements found that the 5800X3D consumed roughly 20% less power than the 5800X. Regardless, it’s obvious the 7950X3D’s proportionately larger power reduction has an impact here.
The Core i9-13900K is 17% faster than the standard Ryzen 9 7950X3D configuration in single-threaded work and 4% faster in threaded applications. We have two overclocked configs here for the 7950X3D — the auto-overclocked PBO, and PBO combined with undervolting (PBO UV). Notably, the PBO UV config narrows the 13900K’s lead in single-threaded work to 11% and reduces the disparity in threaded work to a mere 1%. That’s incredible, given the 7950X3D’s much lower power consumption level (you can see the 7950X3D’s incredible power efficiency metrics on the power page). Regardless of whether or not the chip is undervolted, the 7950X3D consumes far less power and will generate much less heat than the 13900K, but that doesn’t come with a huge performance loss.
The 8-core 5800X3D definitely isn’t the best comparison to the 16-core 7950X3D. Still, it does highlight just how much AMD has improved the performance of its X3D chips by bringing the tech to higher core count chips with a newer architecture — the 7950X3D is 28% faster in single-threaded and 127% faster in multi-threaded work than the Ryzen 7 5800X3D.
Undervolting the 7950X3D results in much better results, particularly in single-threaded apps, than we see with the auto-overclocking PBO alone. As such, we’ll use the undervolted configuration instead of PBO for the breakout tests below.
| Tom's Hardware | Multi-Thread | Single-Thread |
| $569 — Ryzen 9 7950X | 100% | 87.9% |
| $699 — Core i9-13900KS | 99.5% | 100% |
| $589 — Core i9-13900K | 98.6% | 98.0% |
| $699 — Ryzen 9 7950X3D | 94.7% | 83.8% |
| $409 — Core i7-13700K | 79.1% | 90.8% |
| $358 — Ryzen 7 5800X3D | 41.5% | 65.9% |
Rendering Benchmarks on AMD Ryzen 9 7950X3D
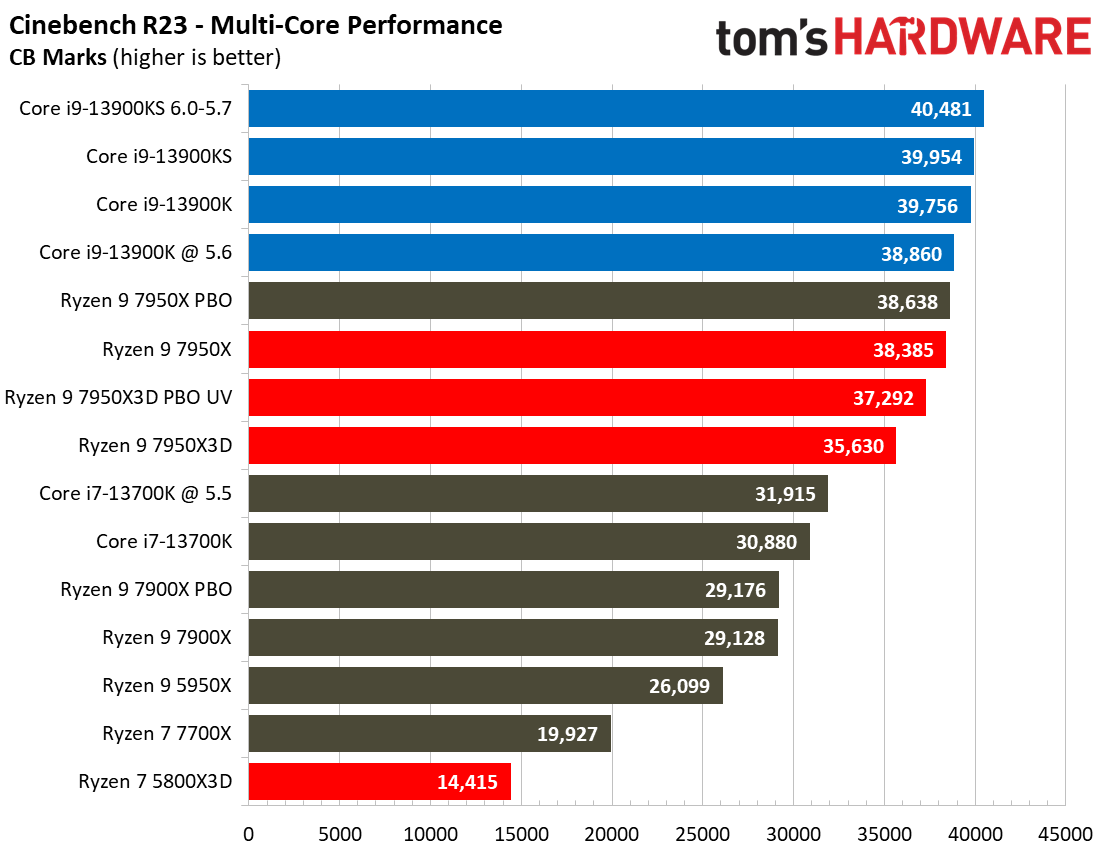
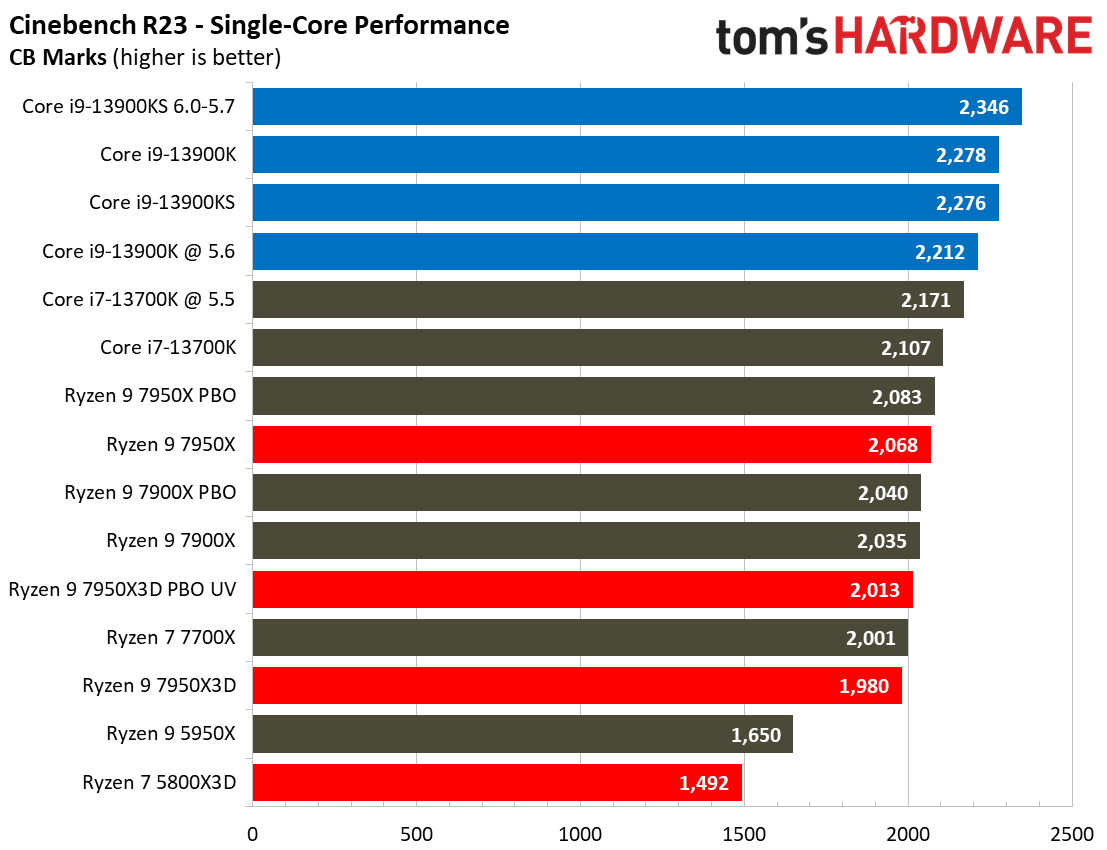
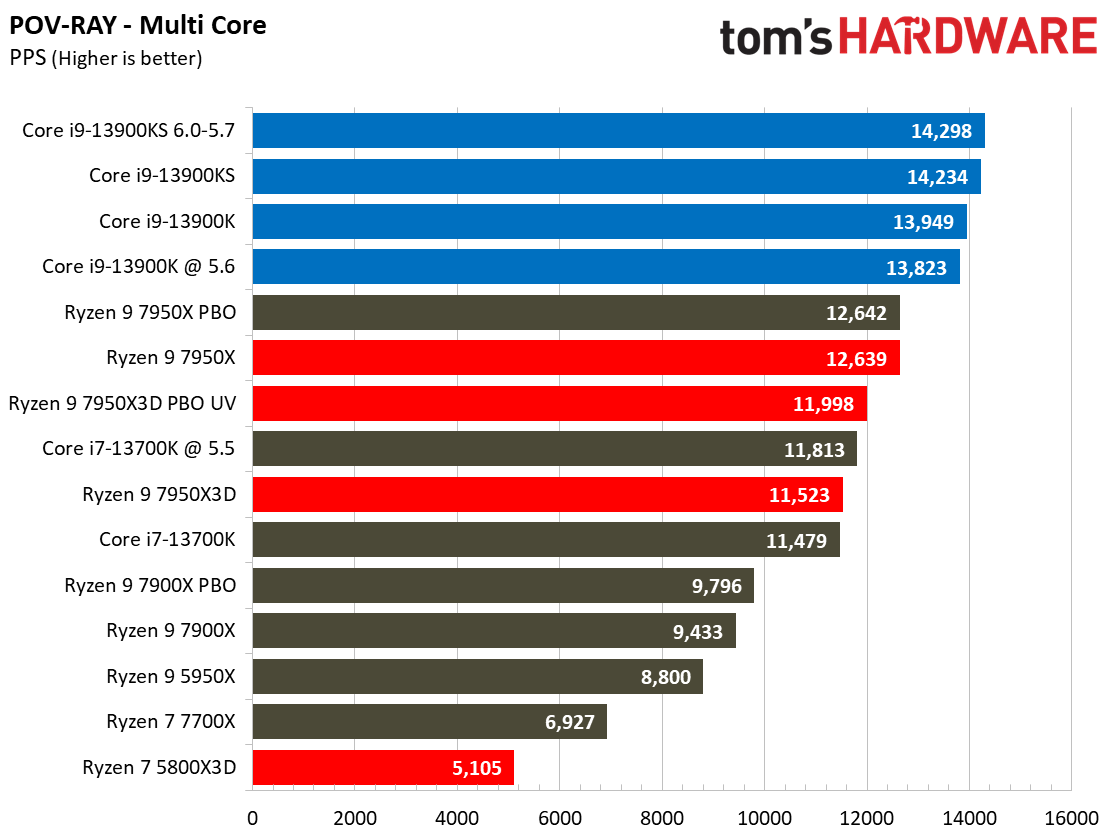
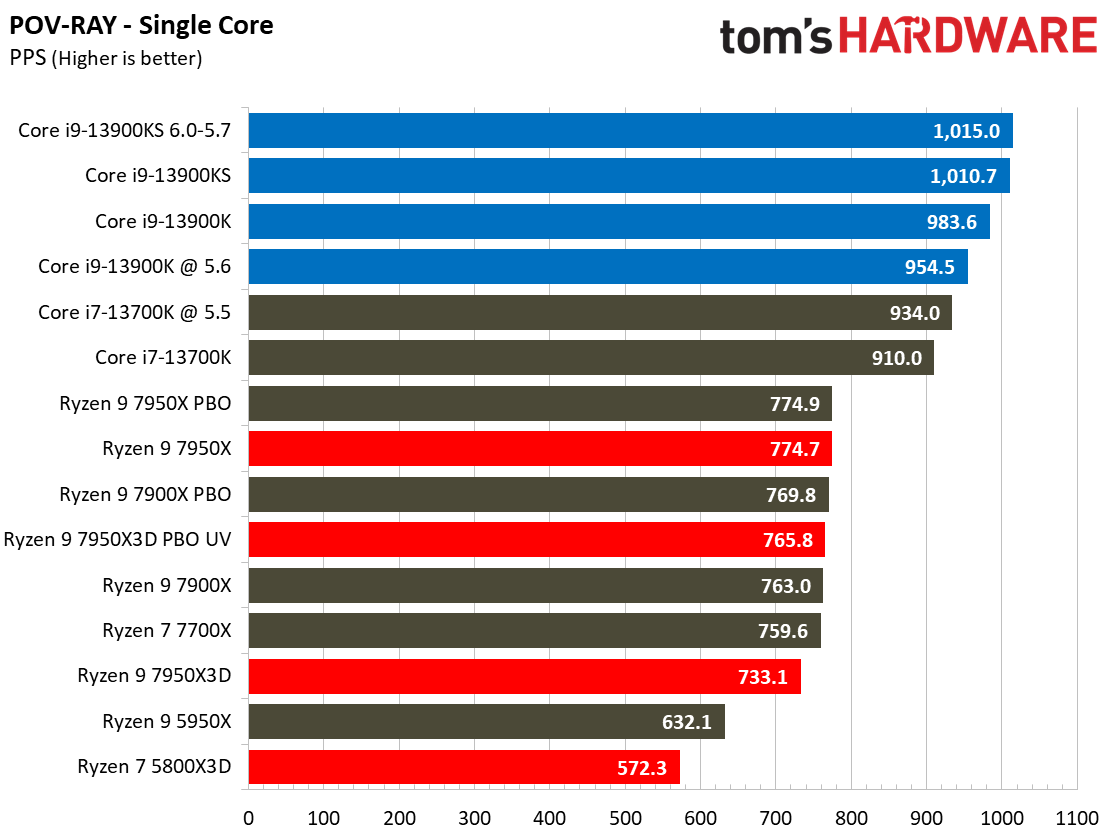
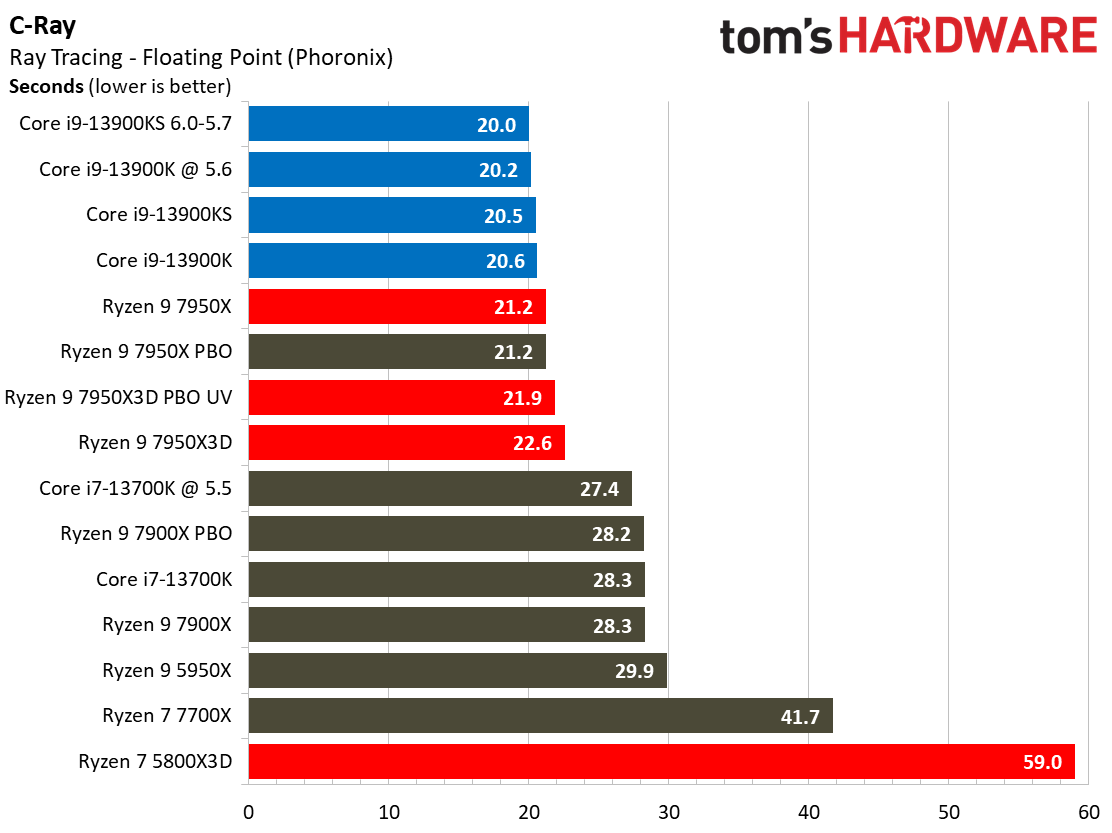
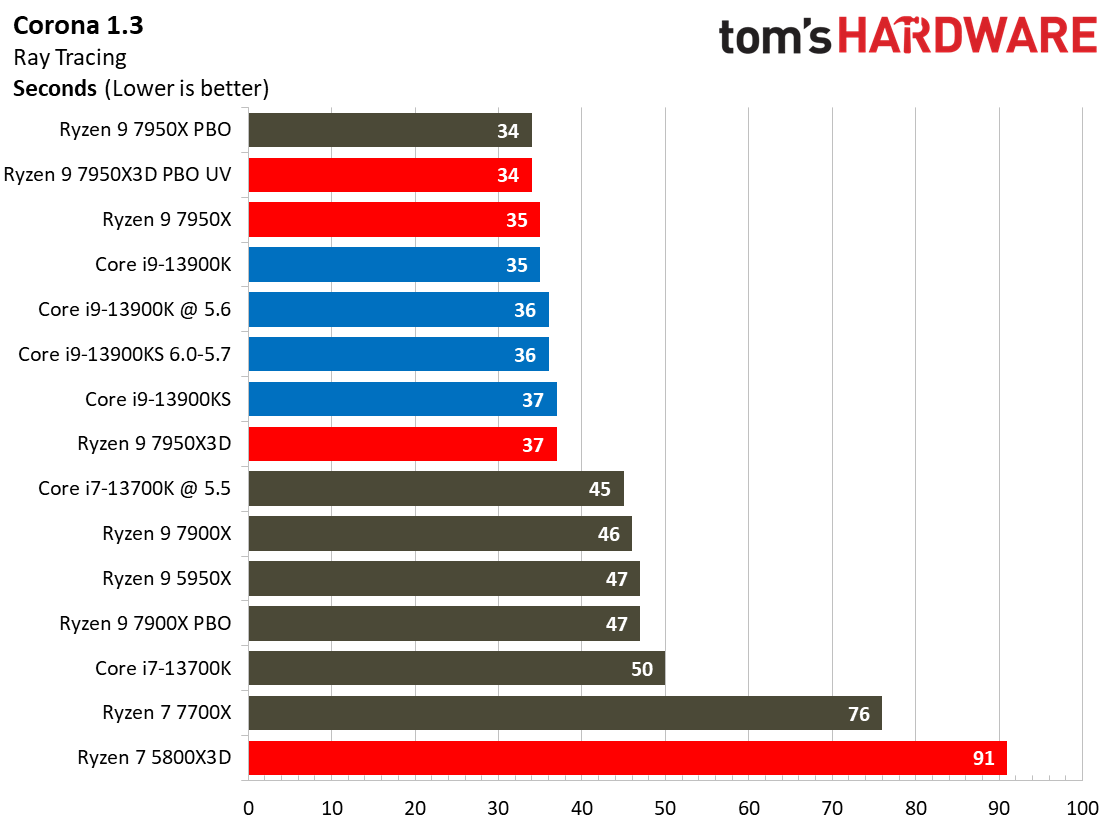
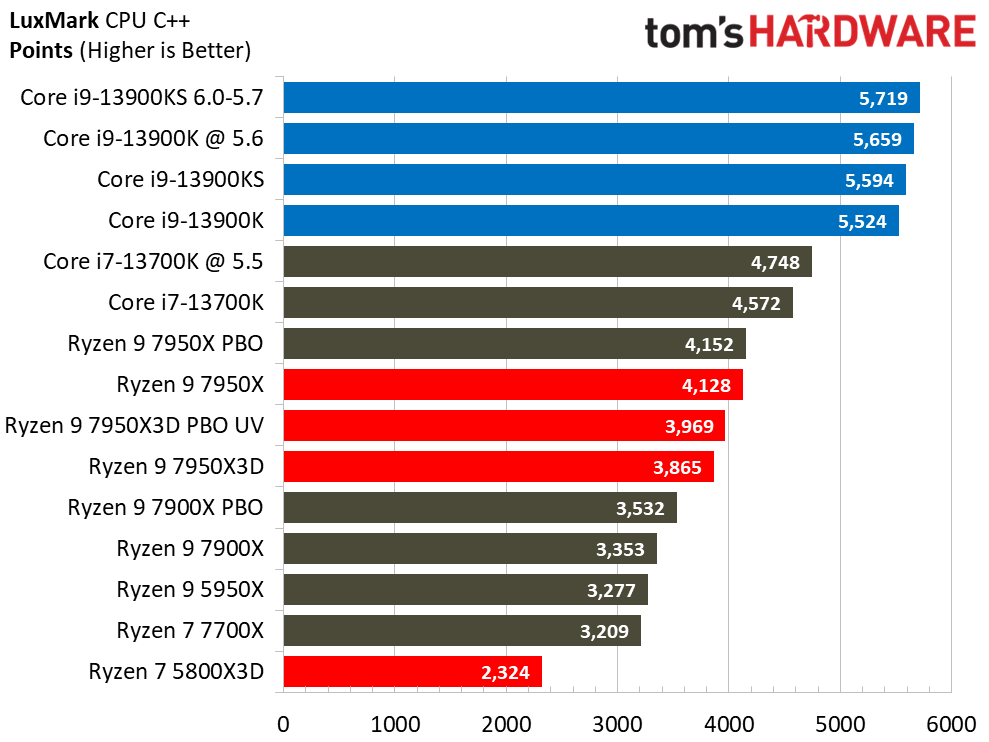
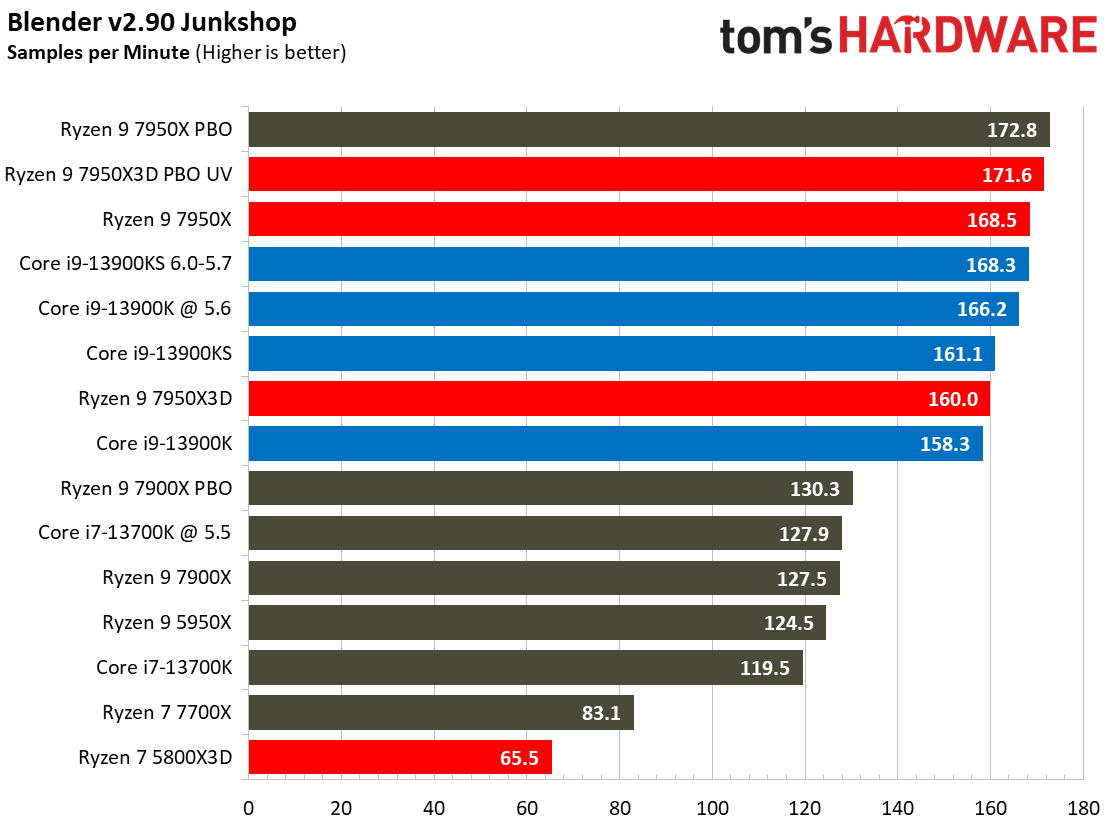
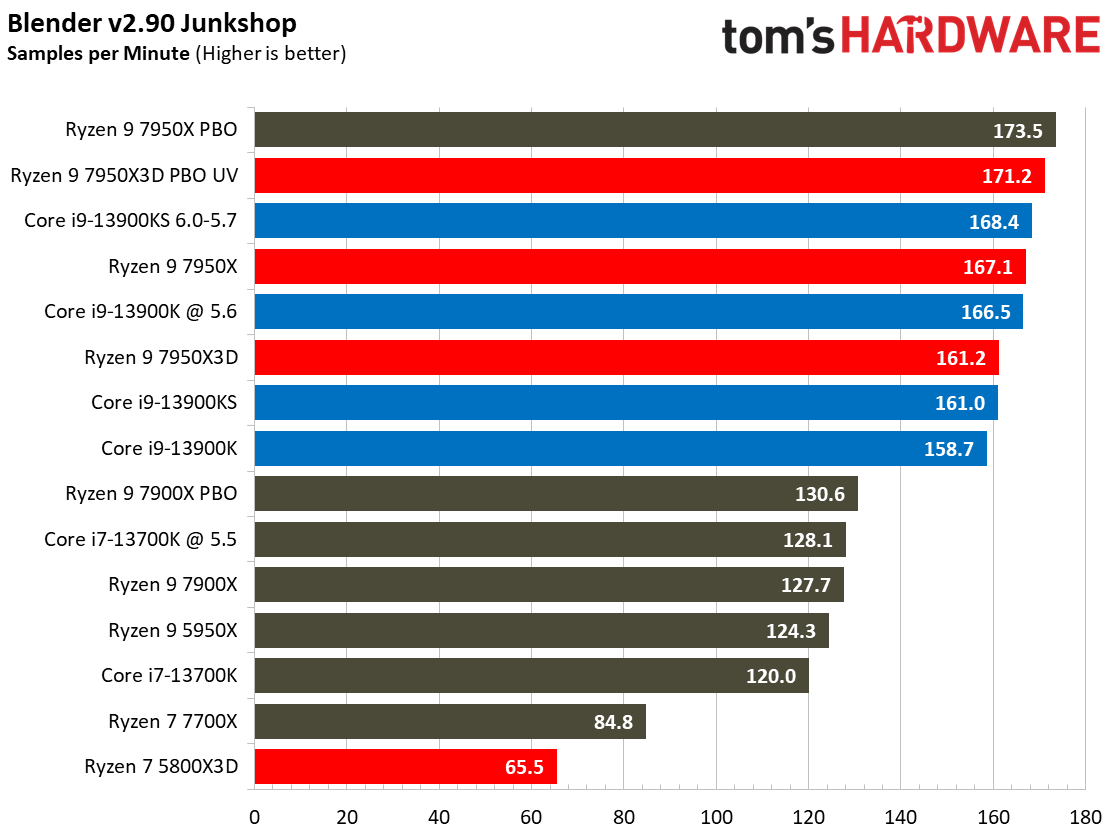
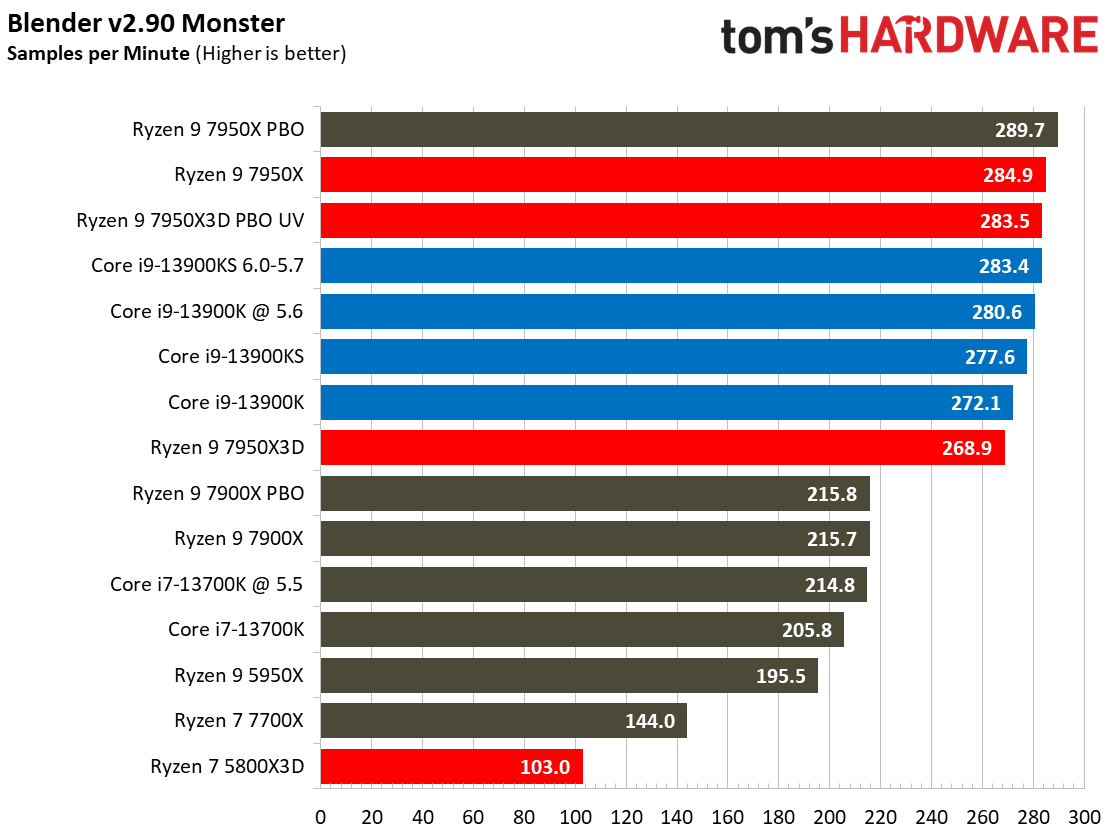
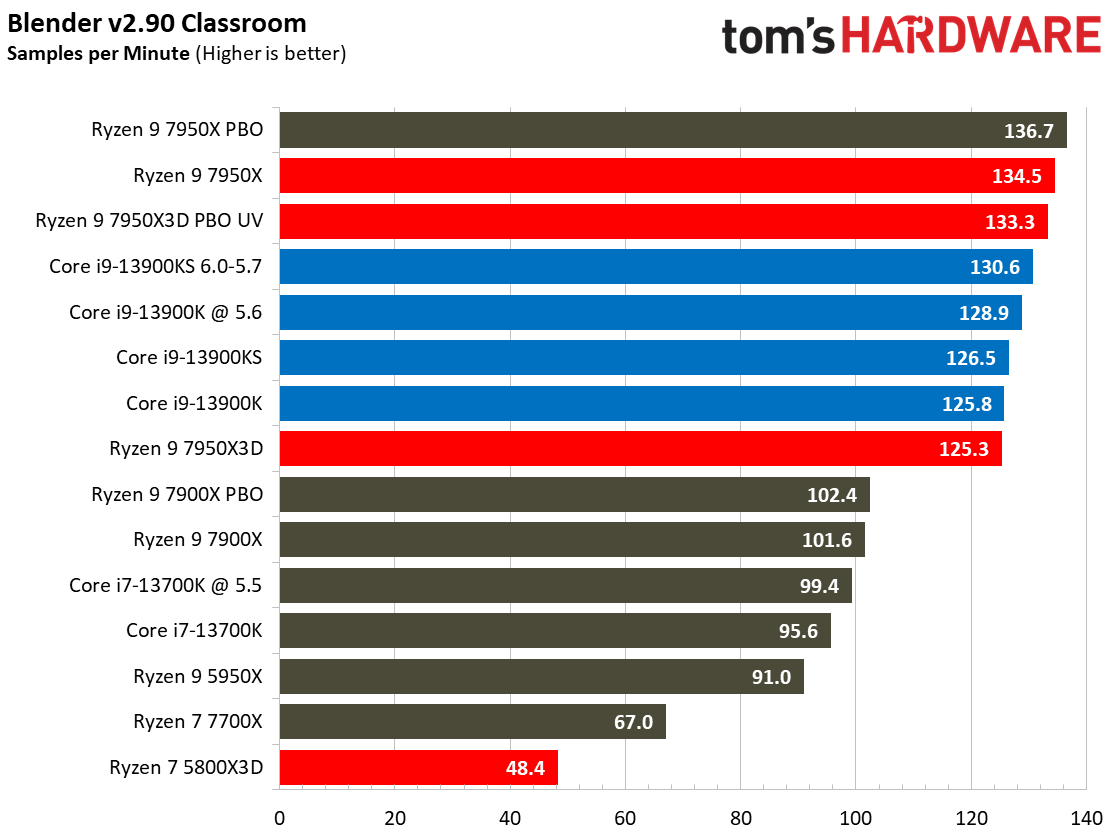
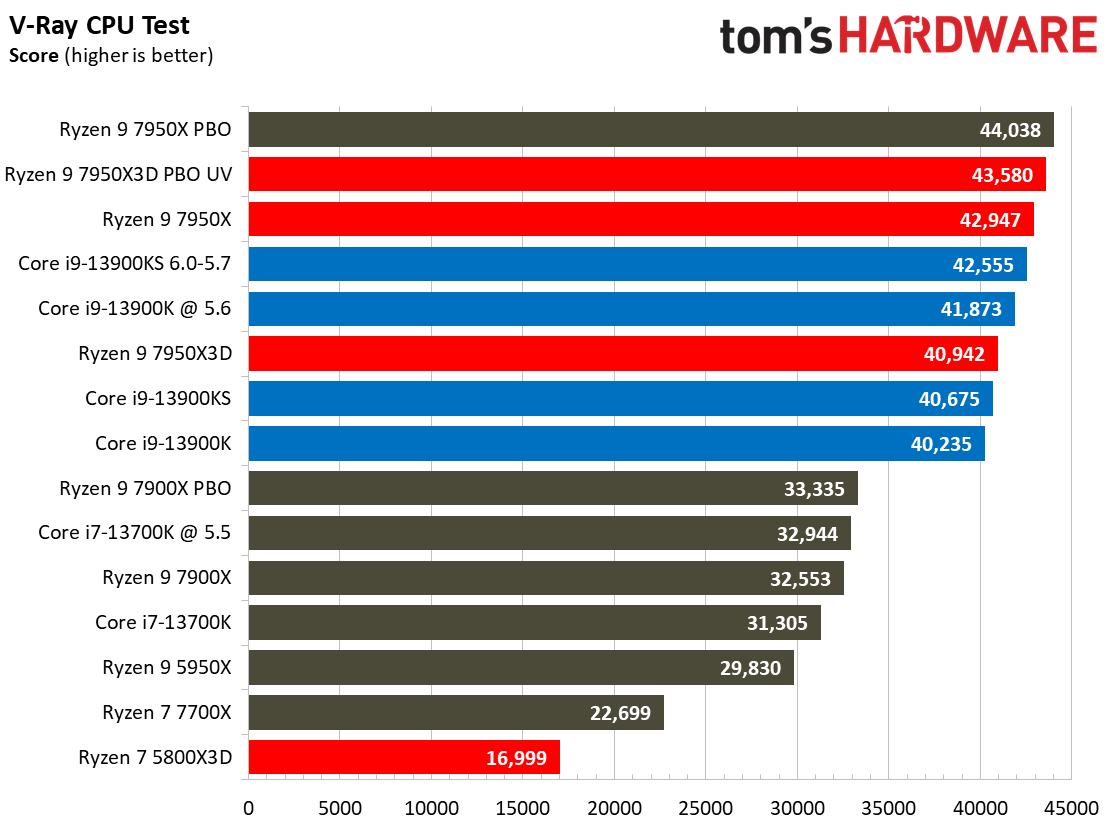
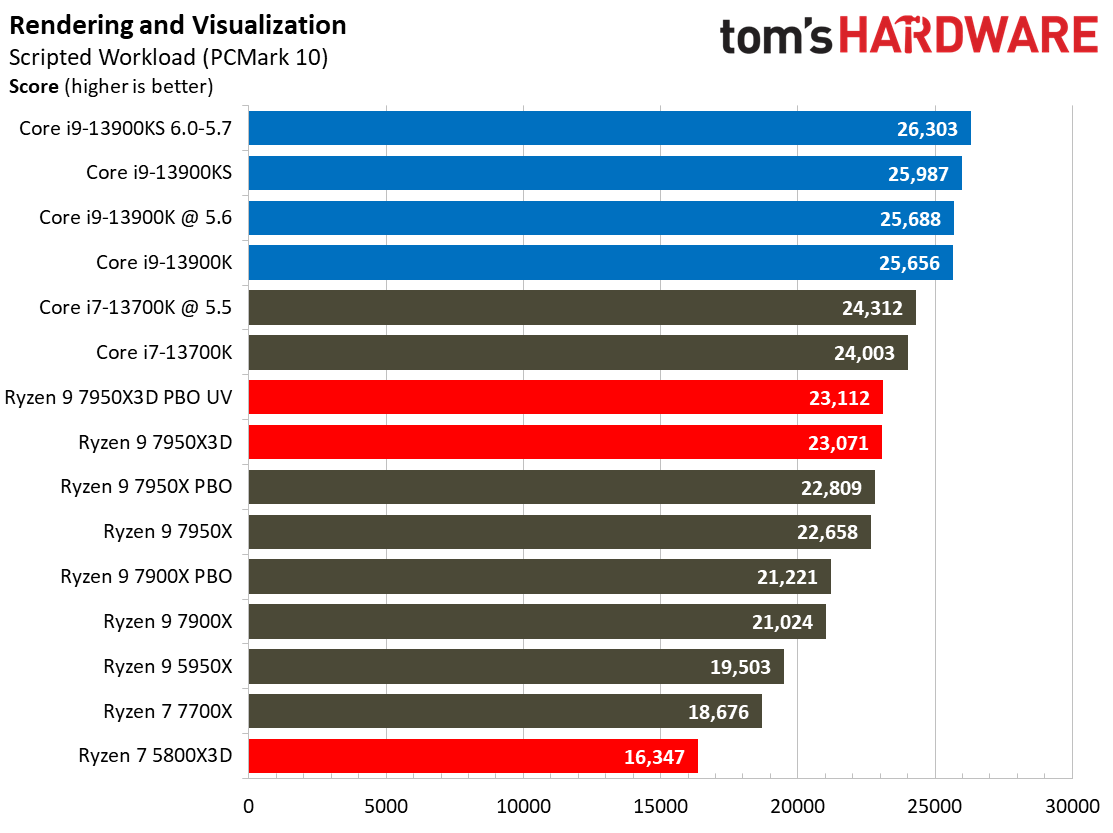
The Ryzen 9 7950X3D is significantly slower in heavily-threaded workloads than the vanilla 7950X, an unavoidable byproduct of its lower power thresholds. However, the chip still holds its own against Intel’s finest in several benchmarks, like Blender, Corona, C-Ray, and V-Ray. Other benchmarks aren’t as forgiving, like the single- and multi-threaded Cinebench and POV-Ray benchmarks, where the Intel chips take big leads.
Engaging PBO and undervolting the chip helps regain ground in a few of these benchmarks, particularly in single-threaded work. It even gives the 7950X3D the lead over the pricey 13900KS in Blender, Corona, and V-Ray. Regardless, these aren’t the clear leads we’ve seen in the past from AMD’s heavily-threaded chips, so you’ll need to be aware of the tradeoffs.
Encoding Benchmarks on AMD Ryzen 9 7950X3D
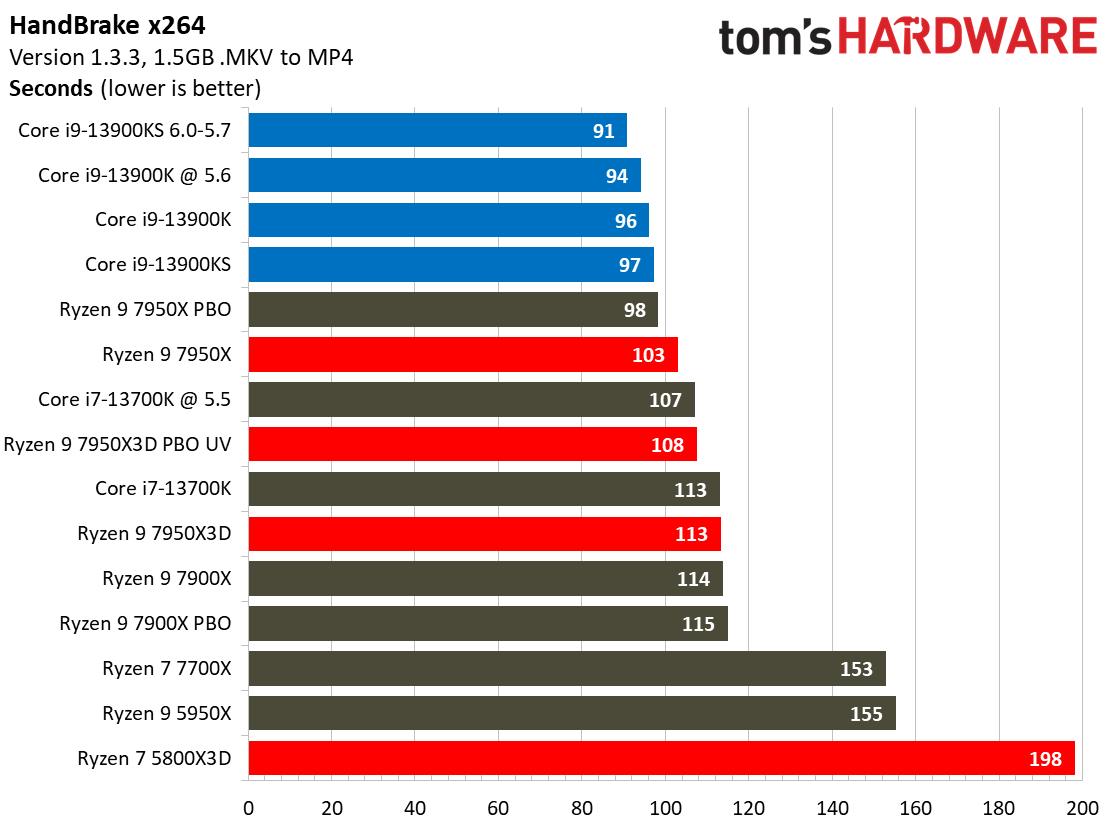
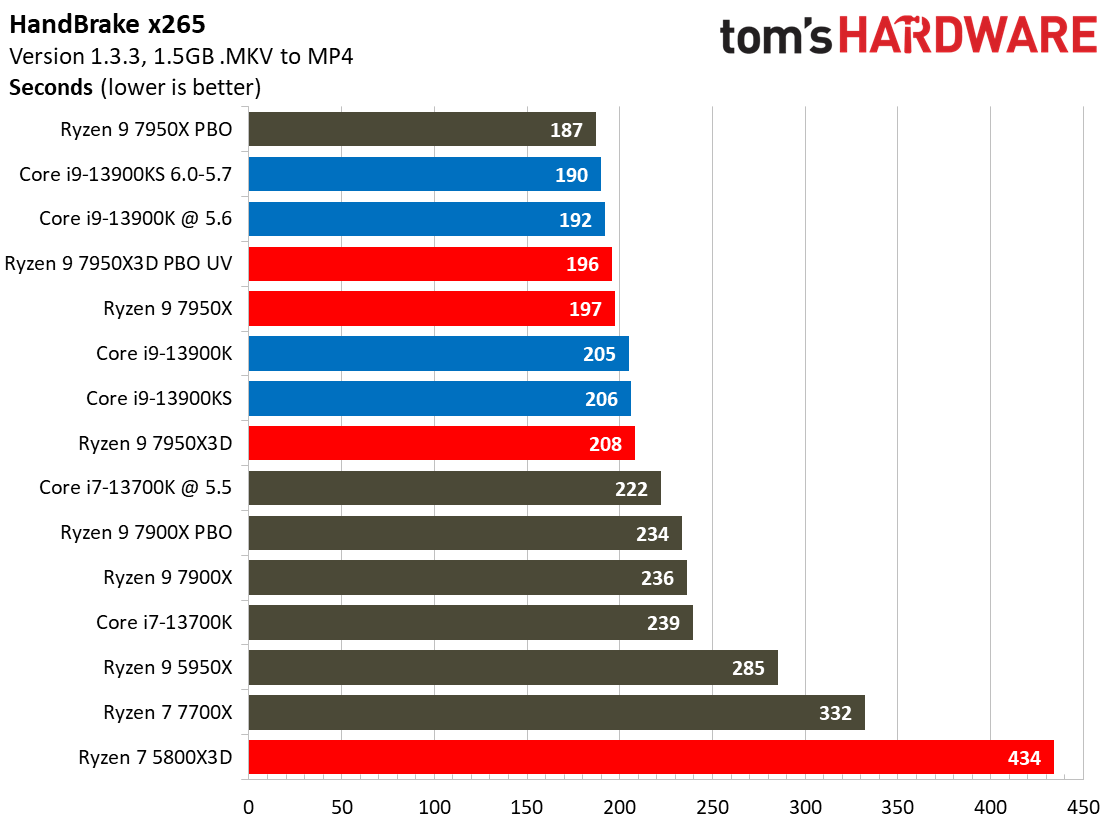
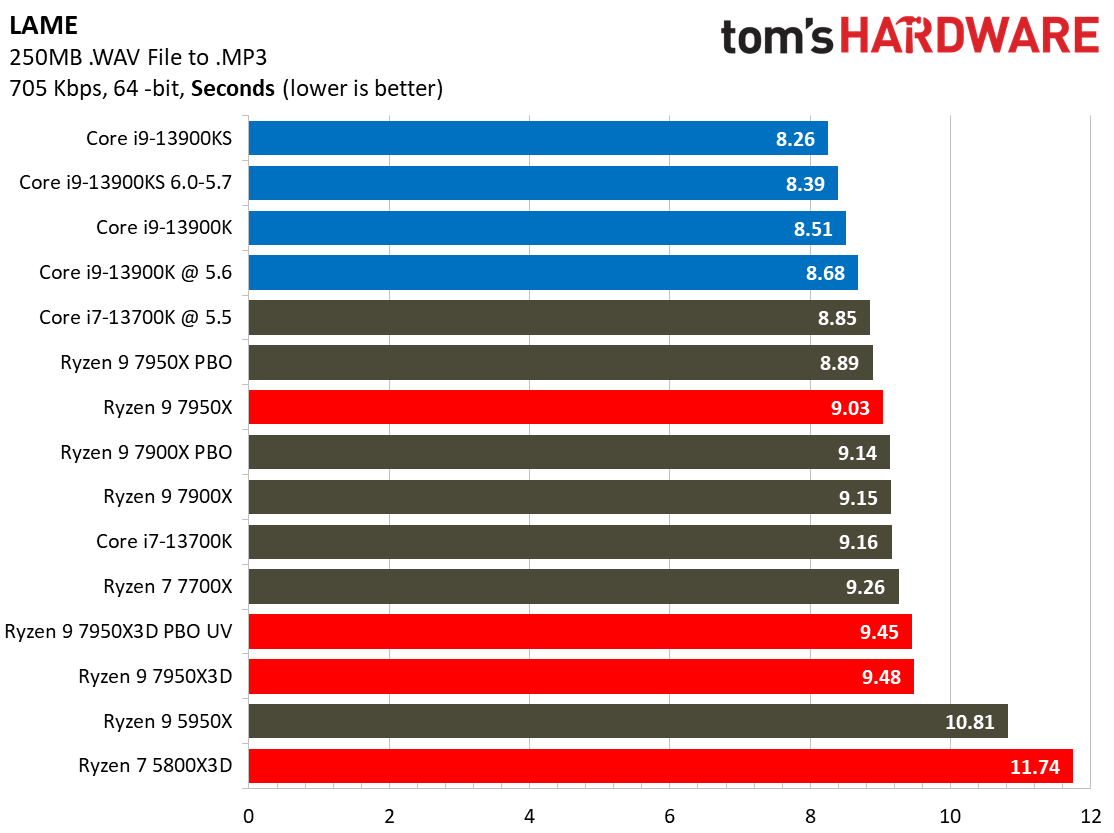
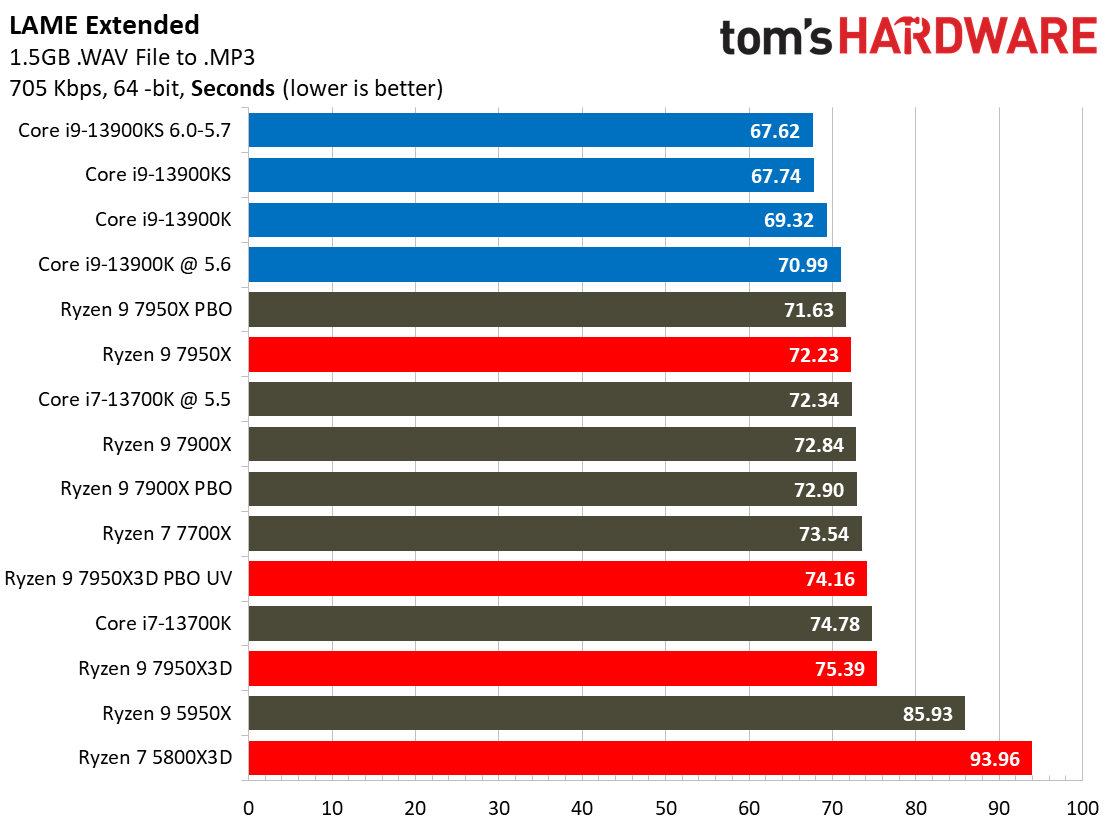
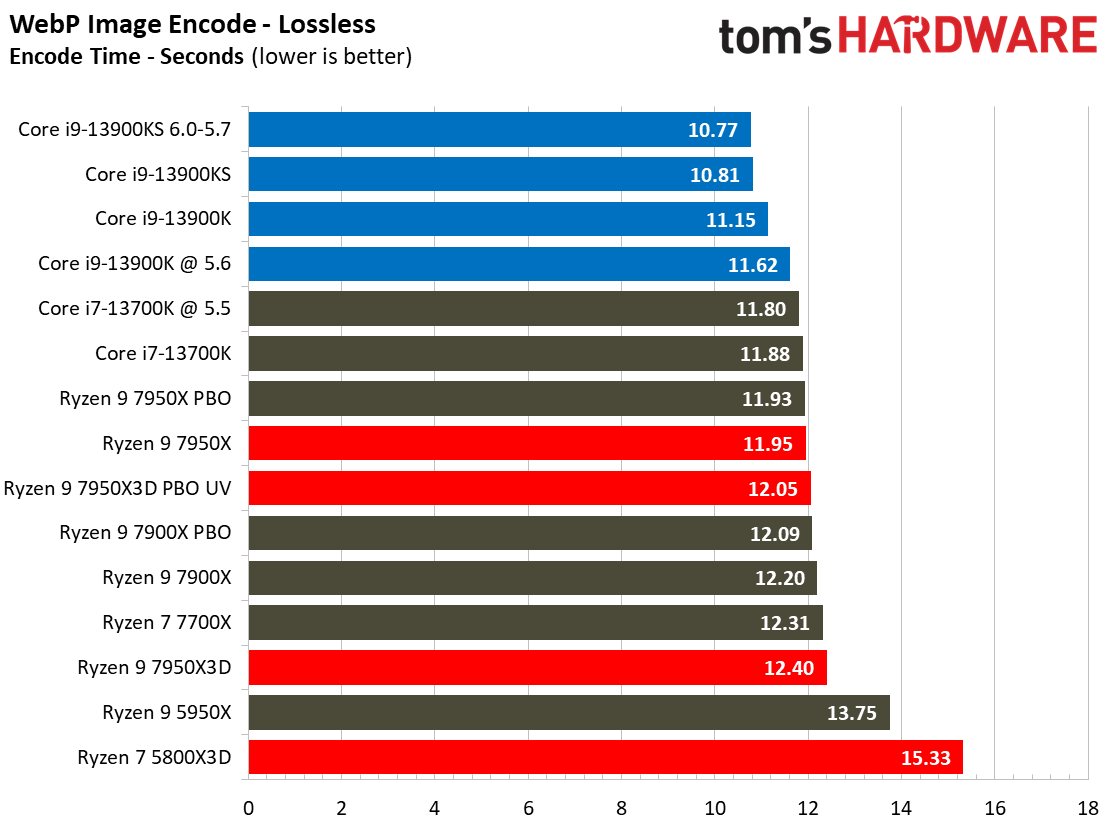
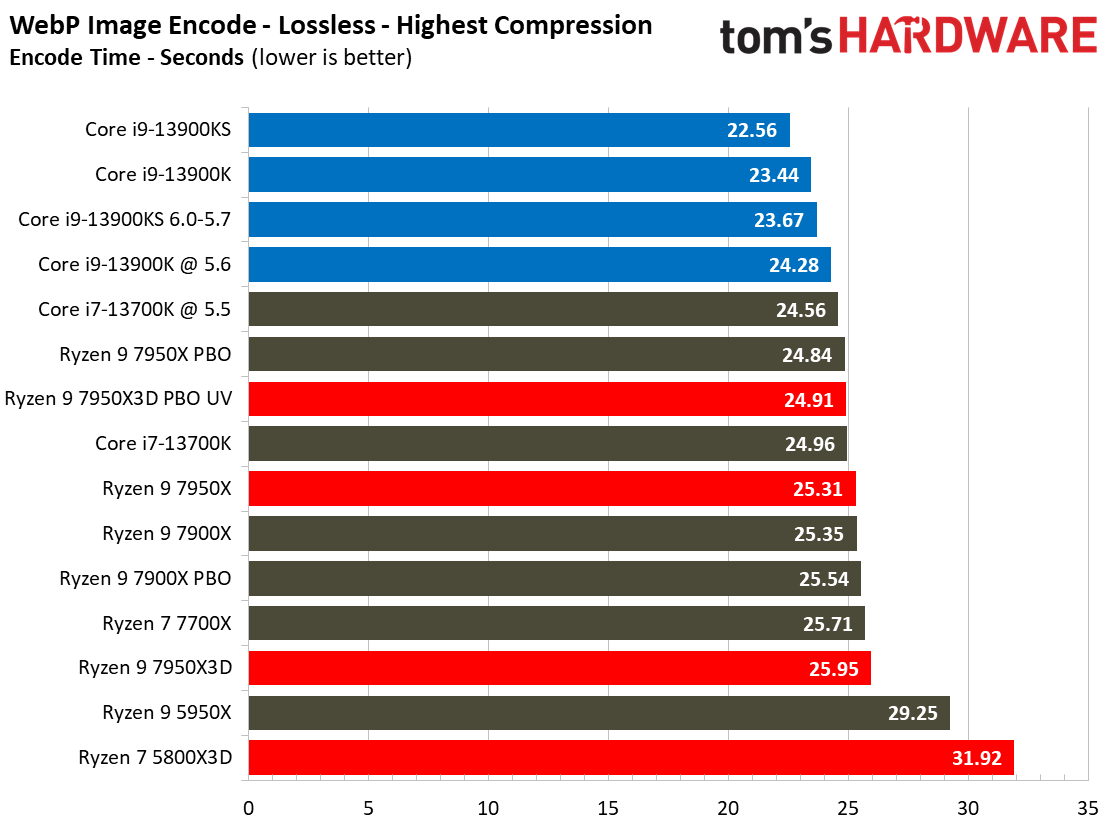
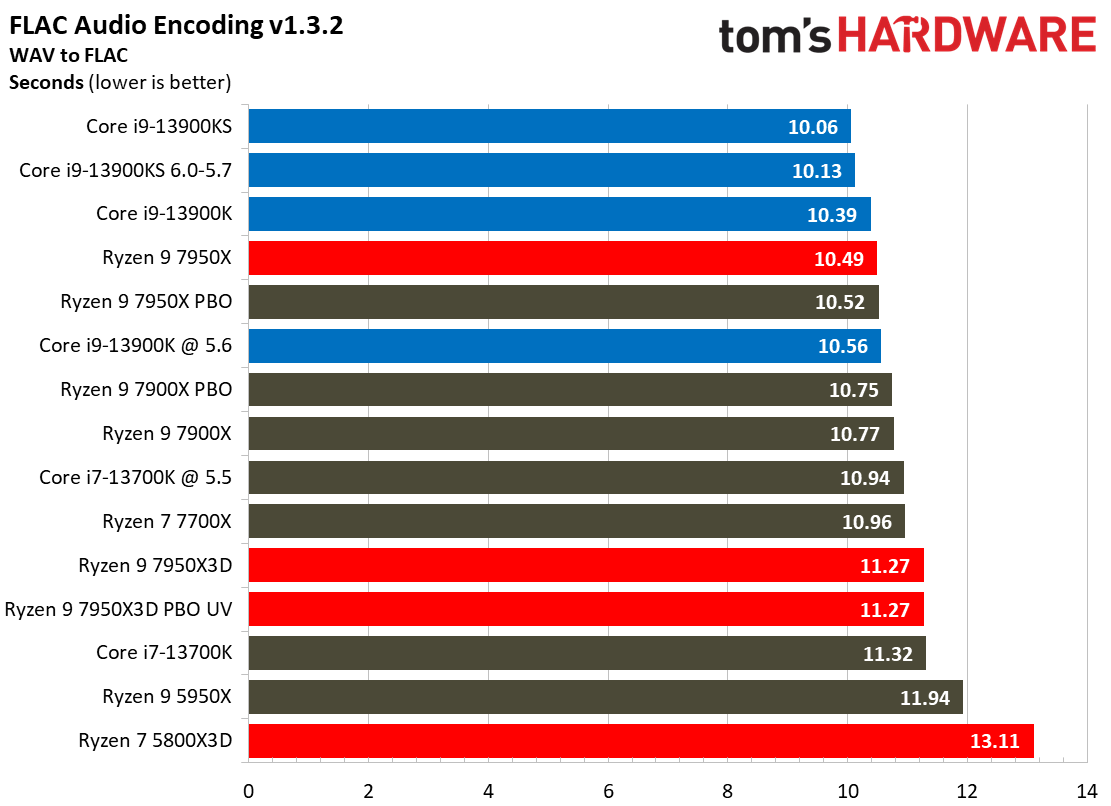
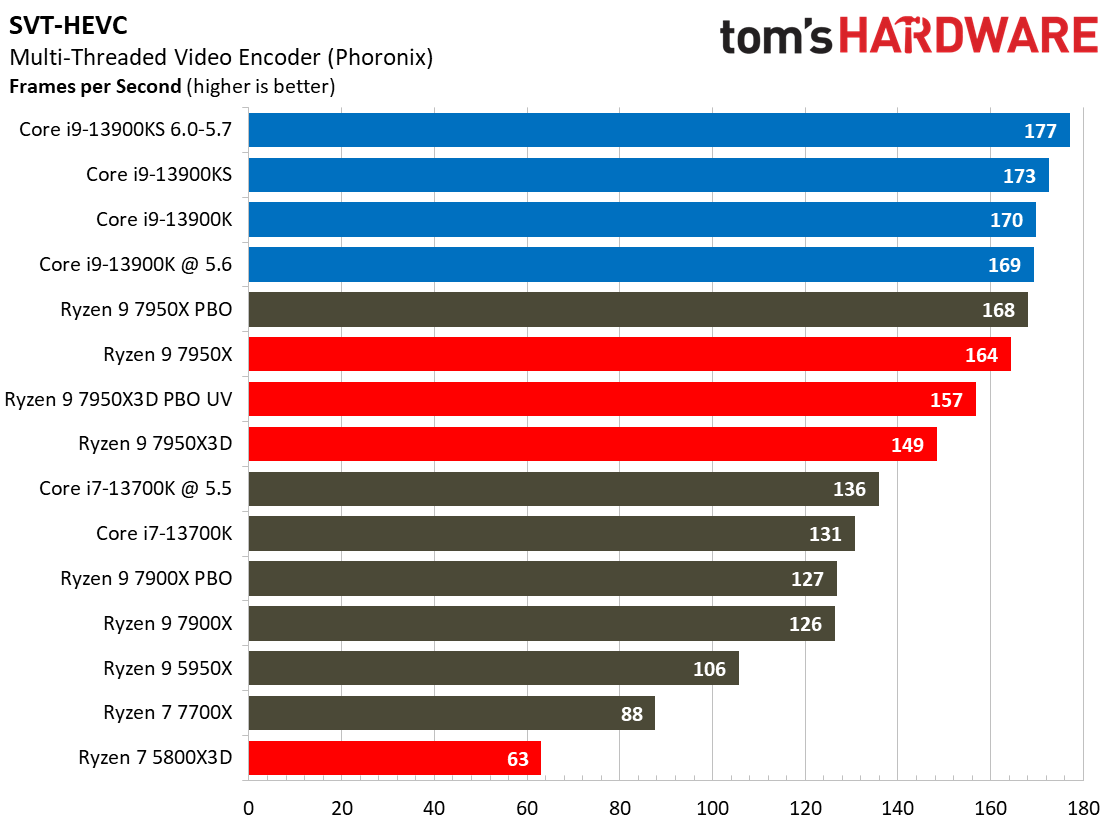
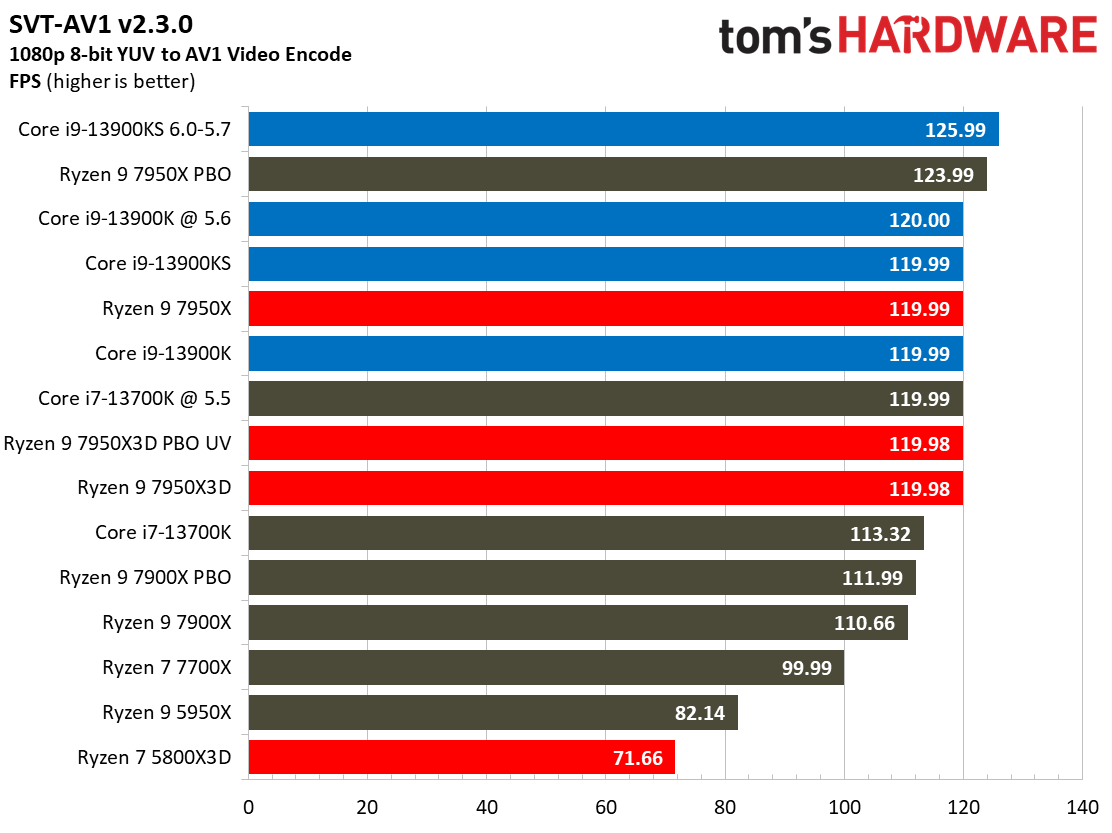
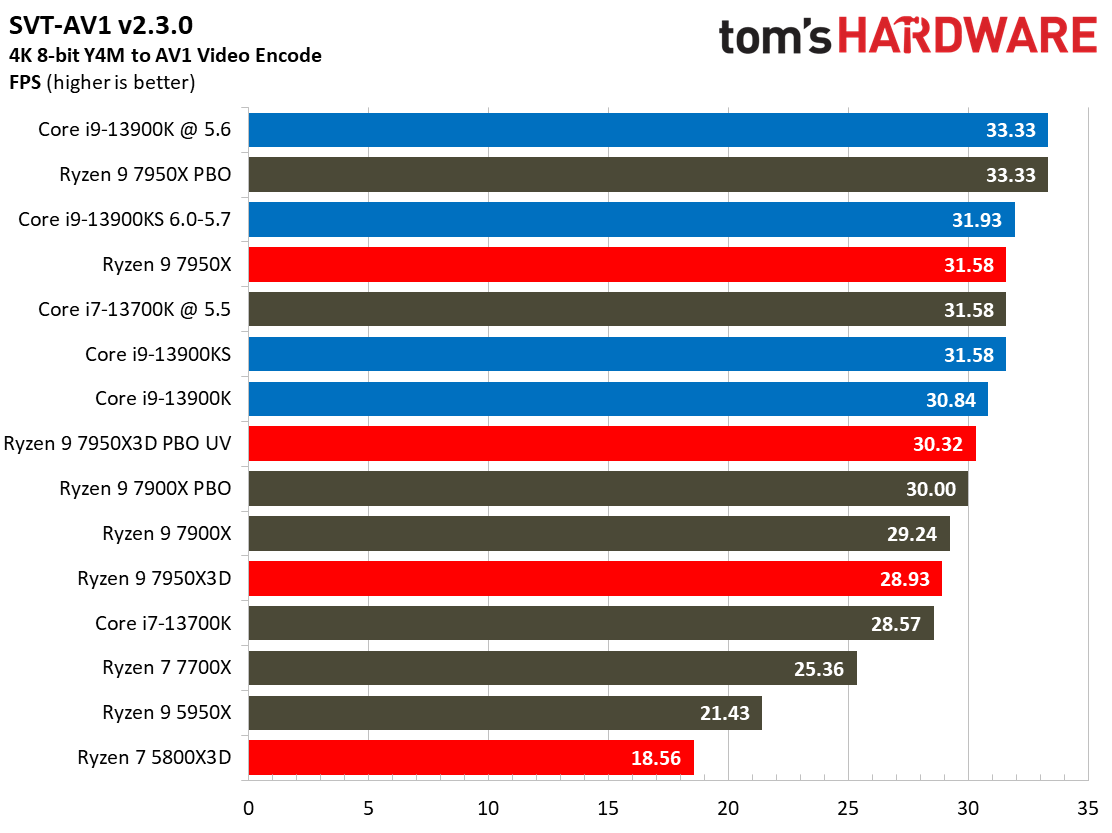
Most encoders tend to be either heavily threaded or almost exclusively single-threaded — it takes an agile chip to master both disciplines. Handbrake, SVT-HEVC, and SVT-AV1 serve as our threaded encoders, while LAME, FLAC, and WebP are indicative of how the chips handle lightly-threaded engines.
It isn’t surprising to find the Ryzen 9 7950X3D trailing in the lightly-threaded applications — the Intel chips have much higher peak boost clock rates. The 7950X3D is more competitive in the threaded benchmarks, but it doesn’t score any convincing wins.
Adobe, Web Browsing, Office, and Productivity on AMD Ryzen 9 7950X3D
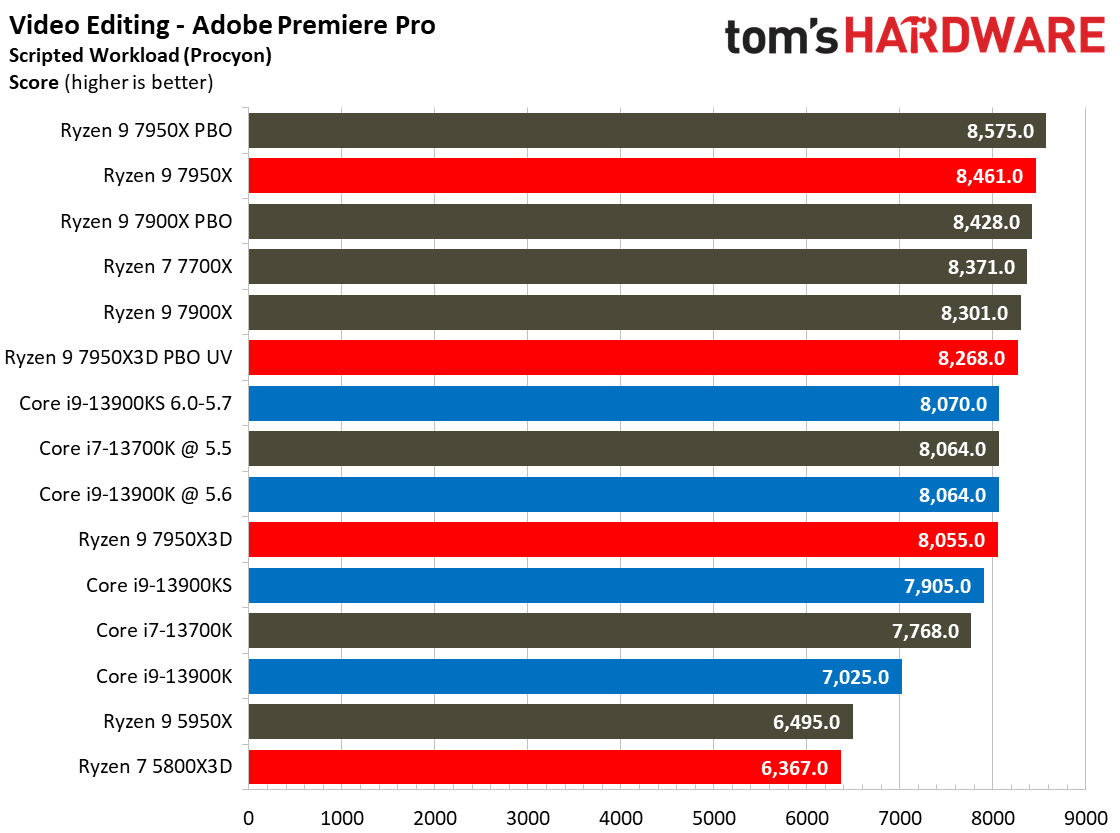
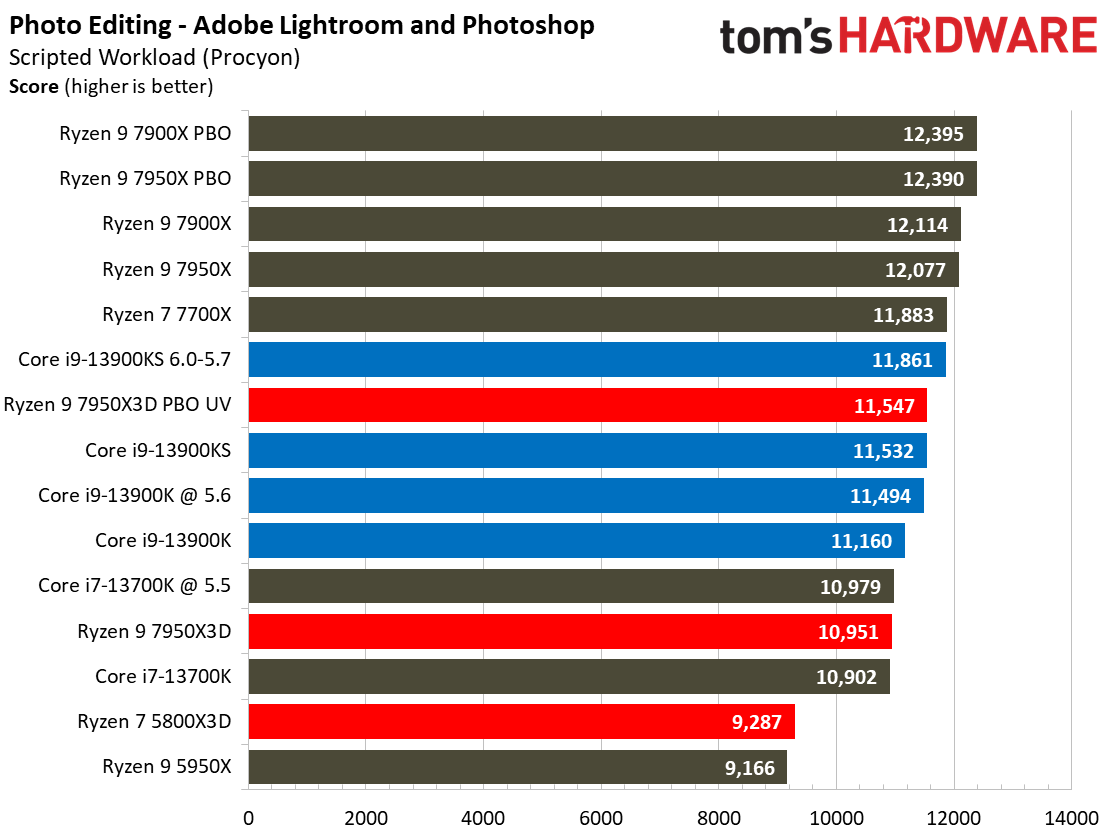
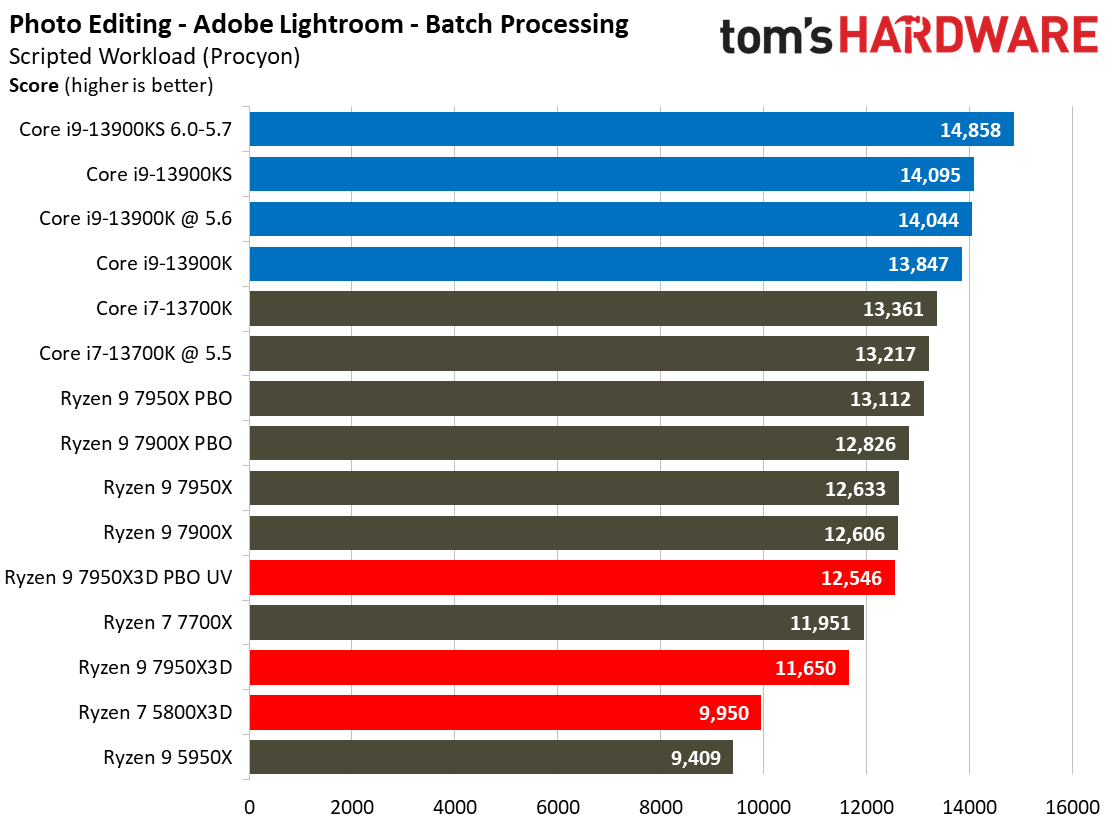
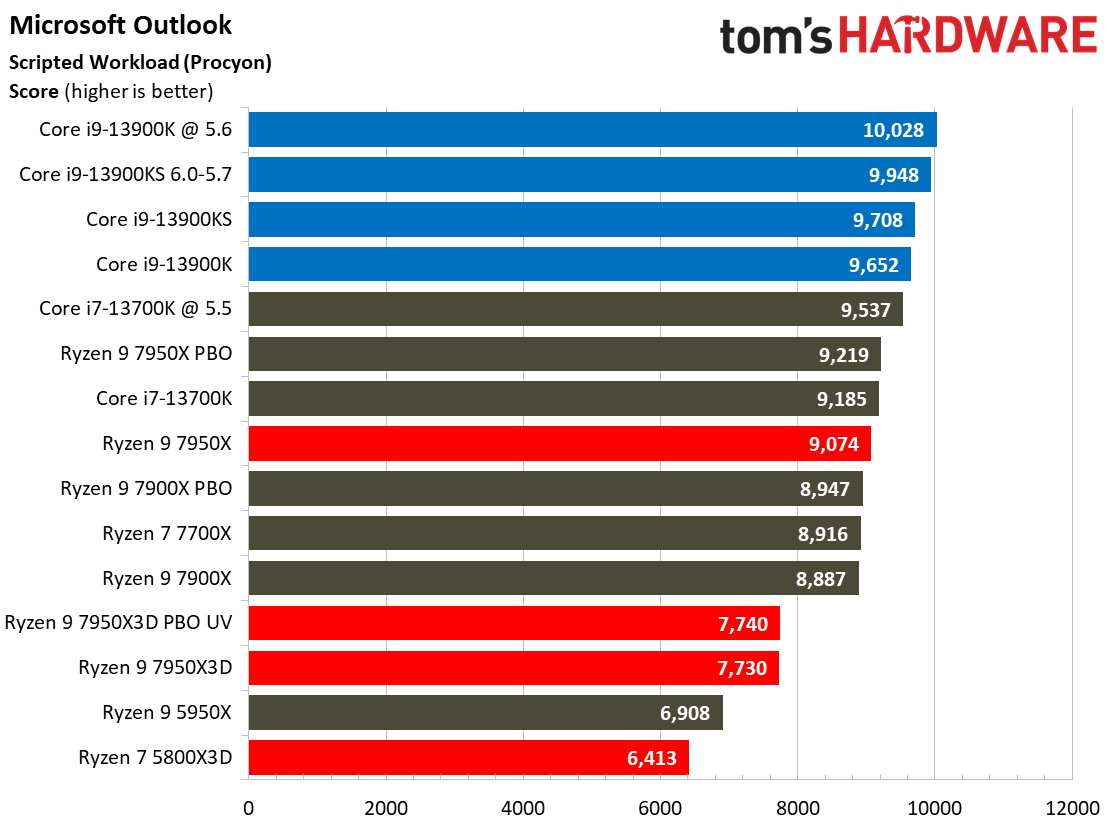
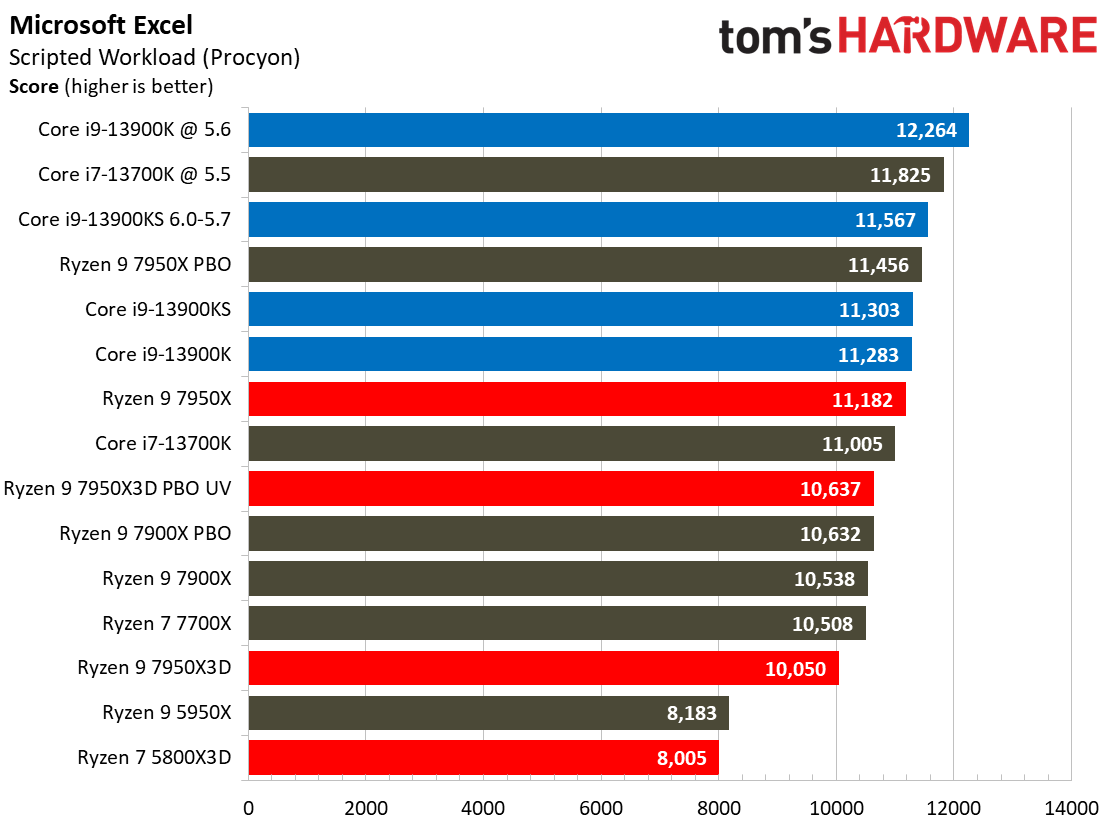
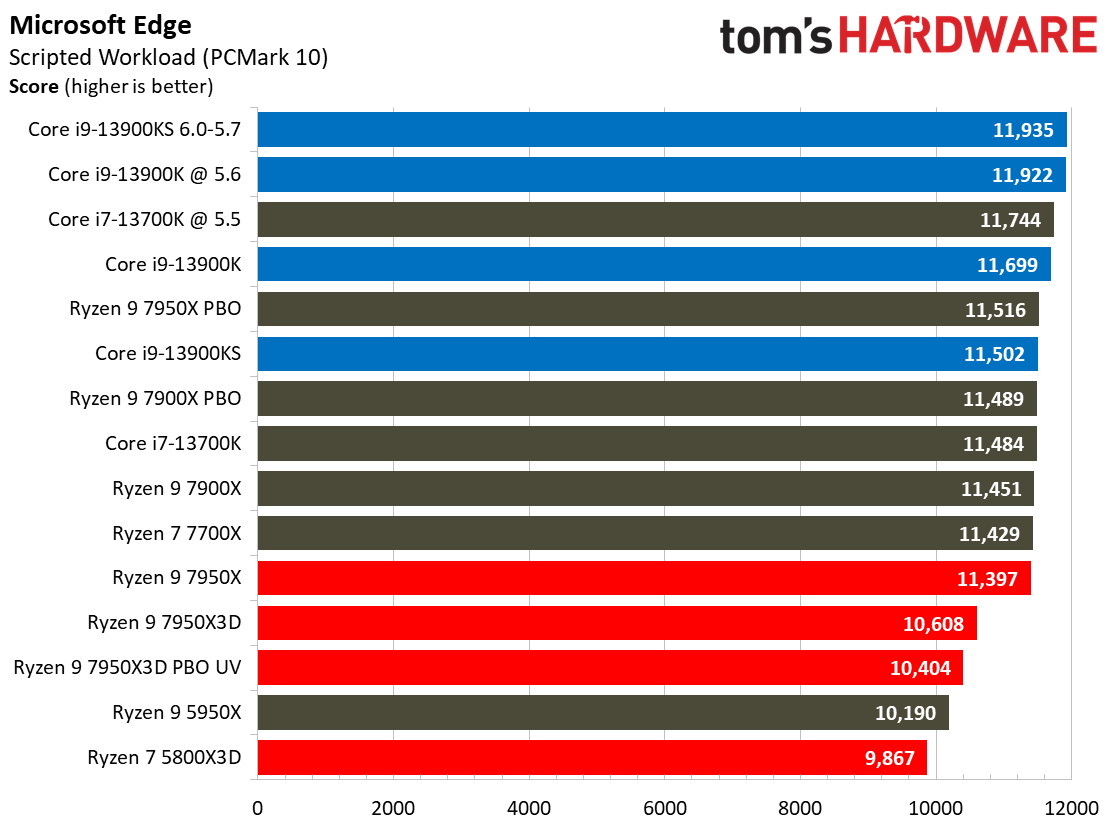
The Ryzen 9 7950X3D scores a needed win in the Adobe Premier Pro and is competitive in the Lightroom and Photoshop benchmark but trails in the rest of these benchmarks.
Compilation, Compression, AI Chess Engines, AVX-512 Performance on AMD Ryzen 9 7950X3D
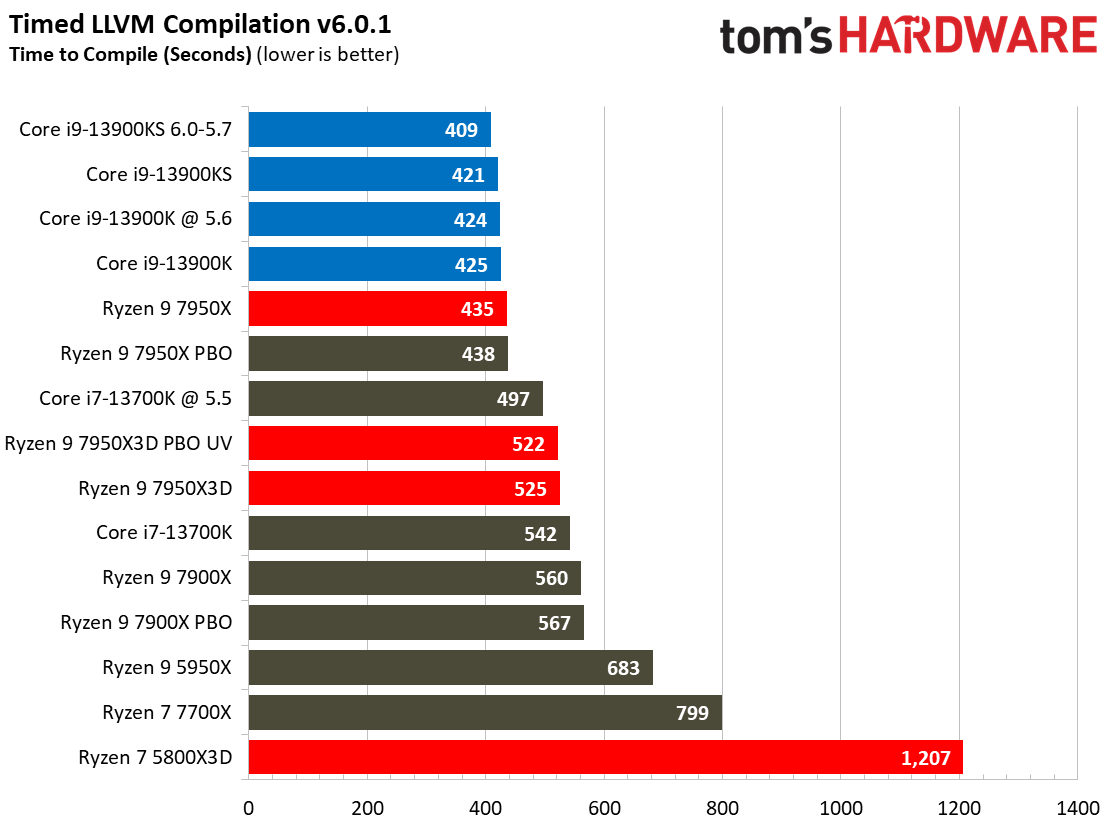
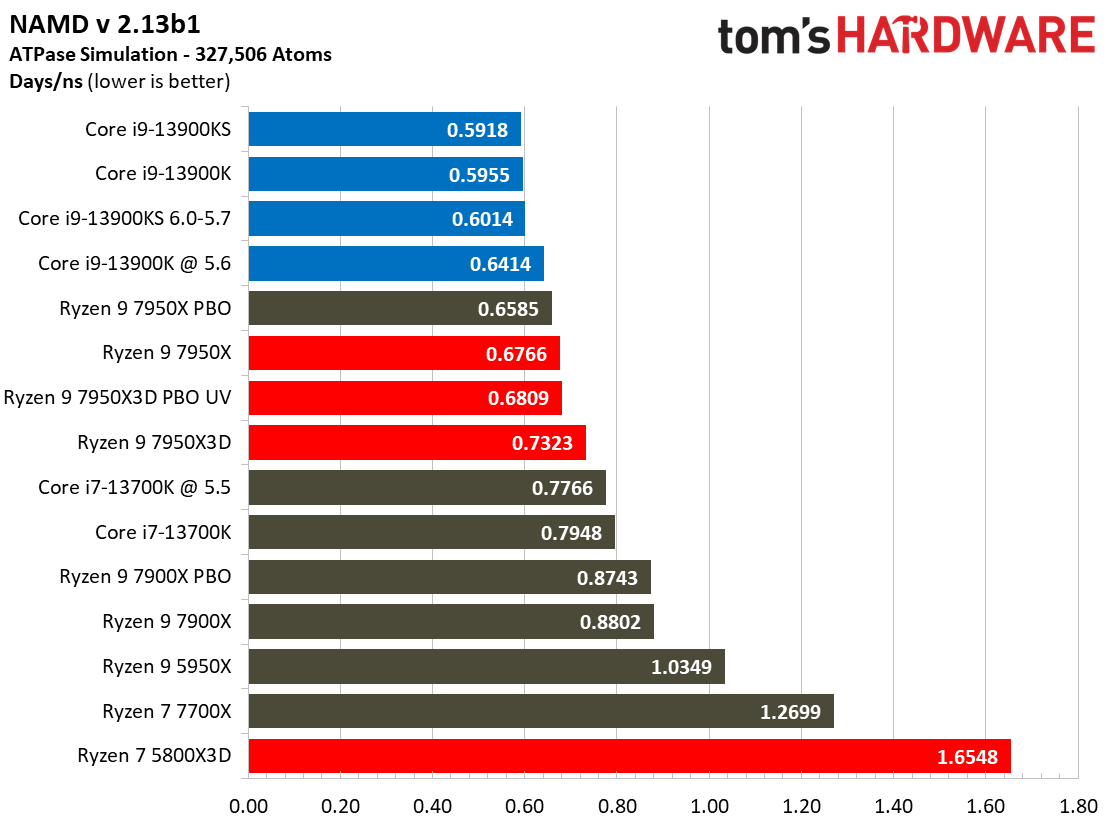
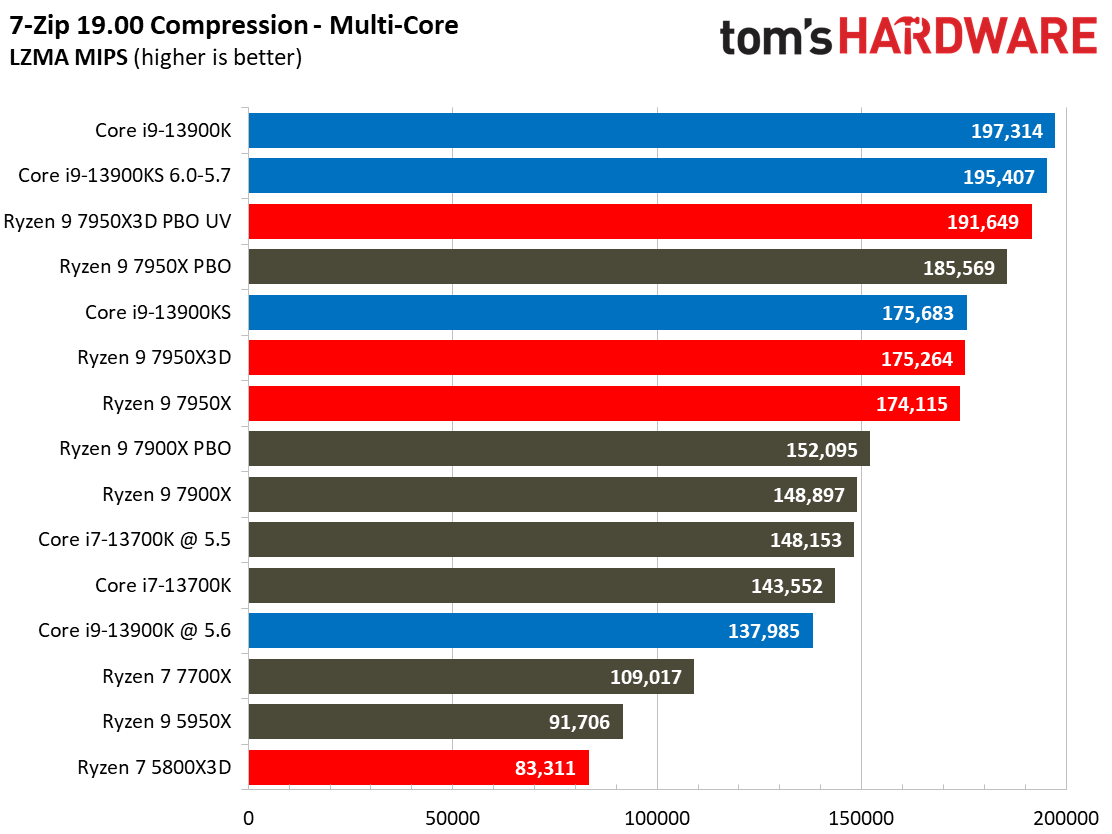
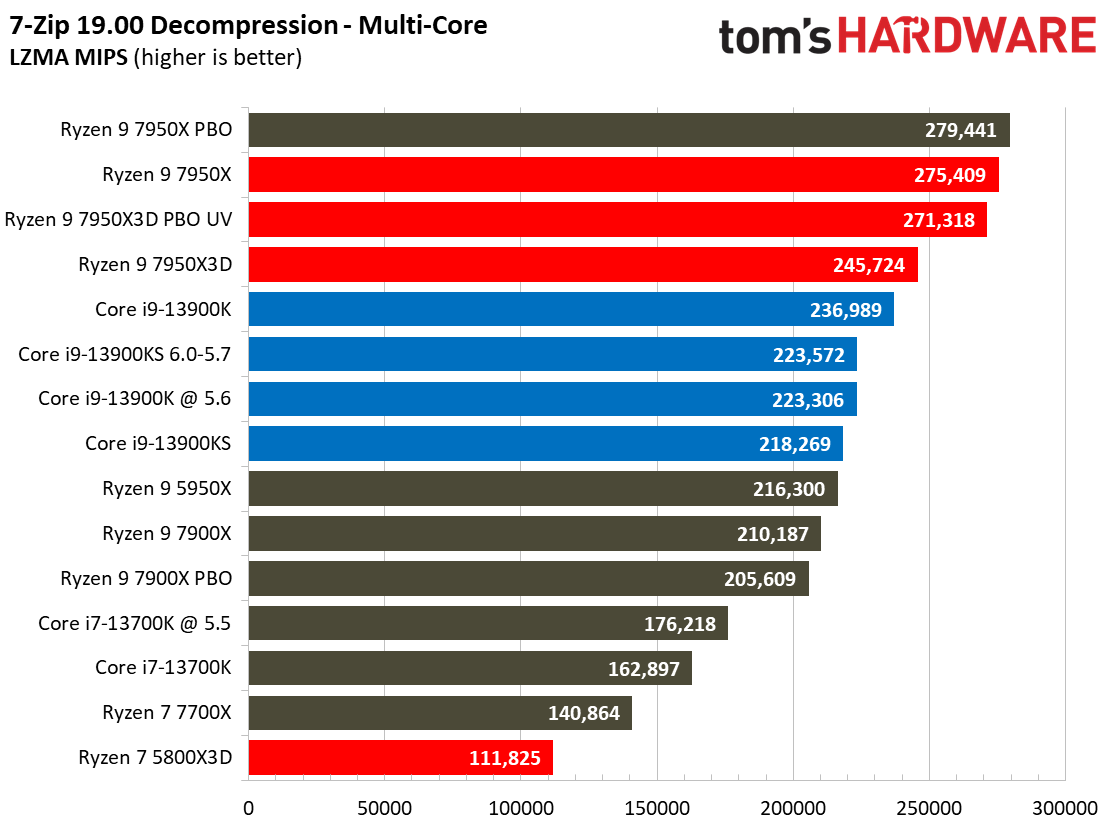
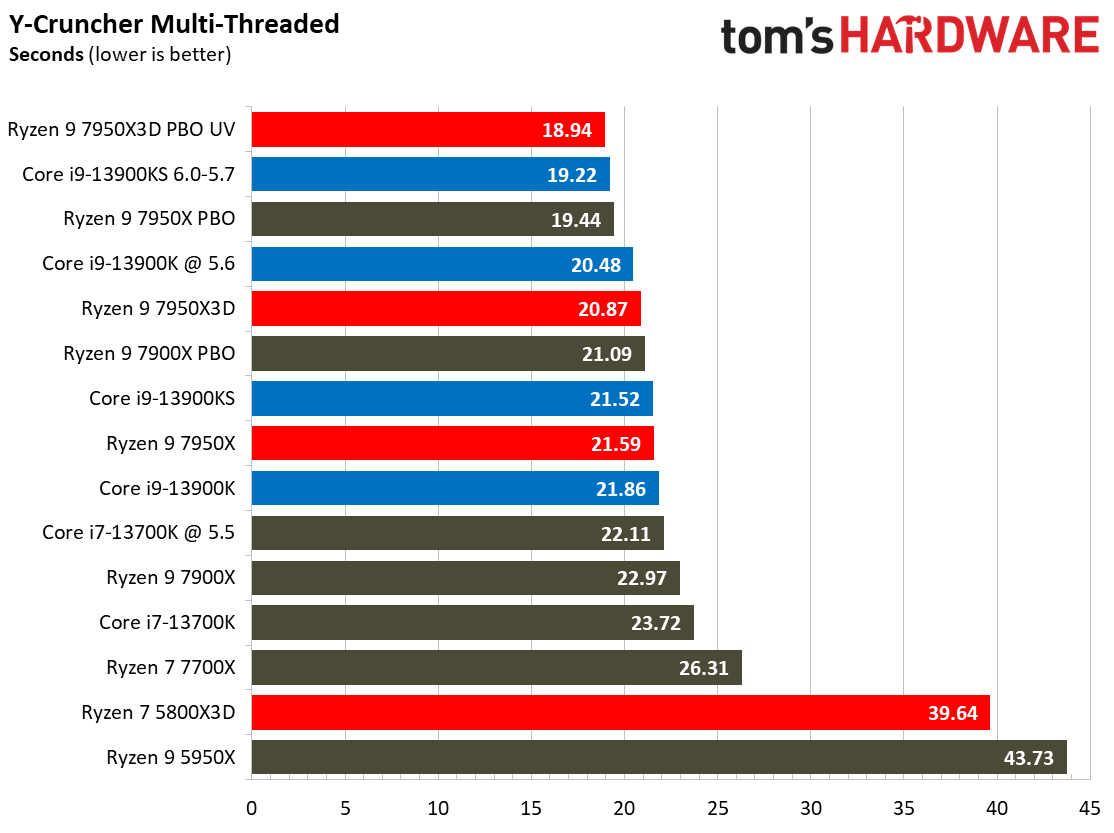
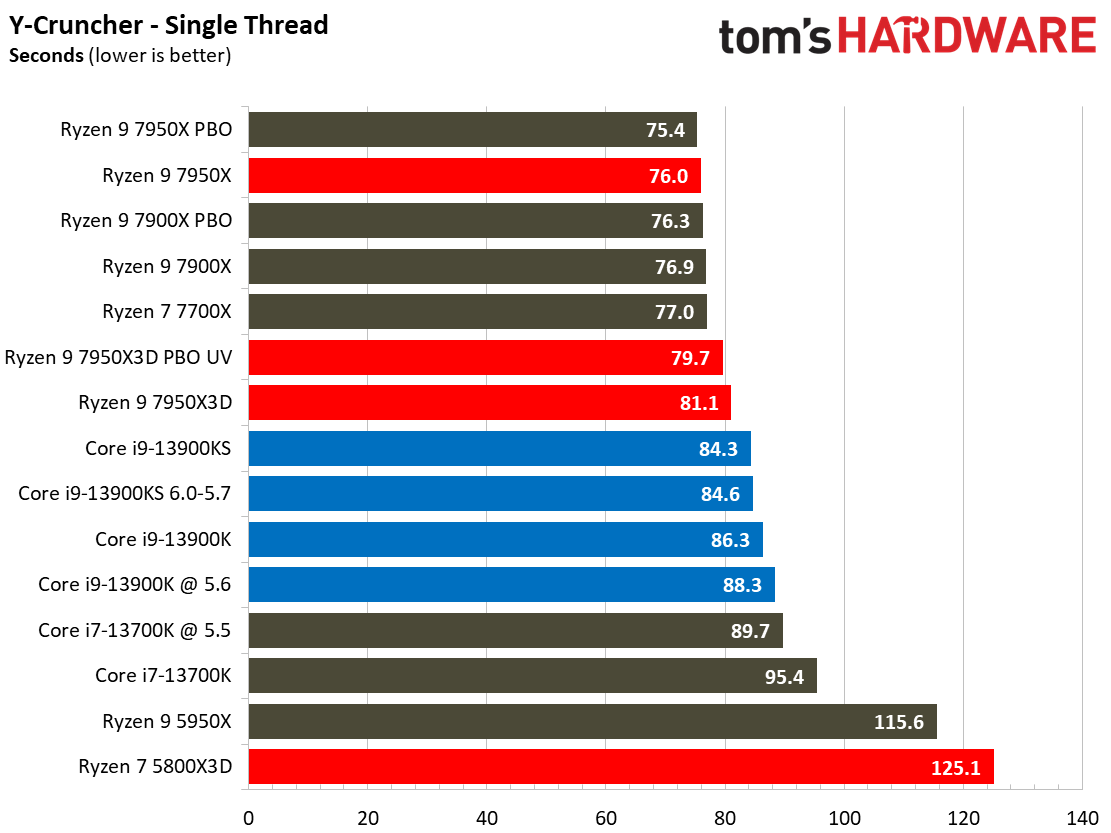
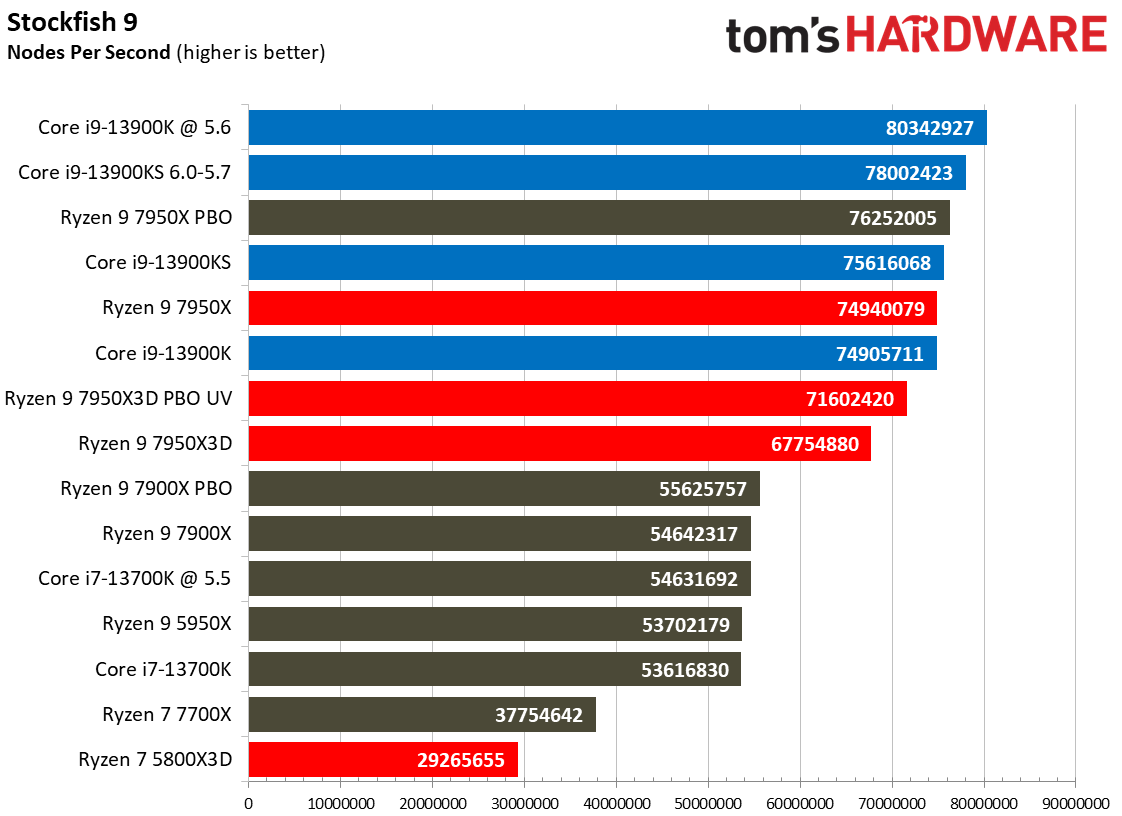
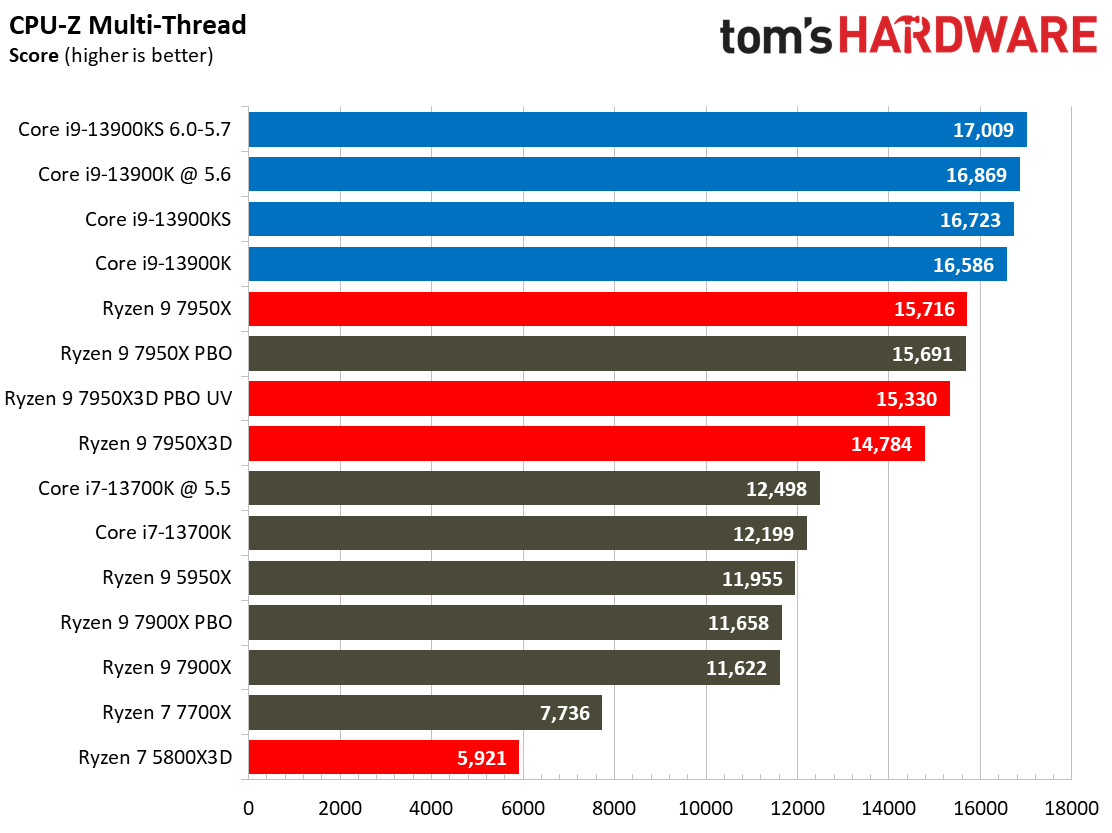
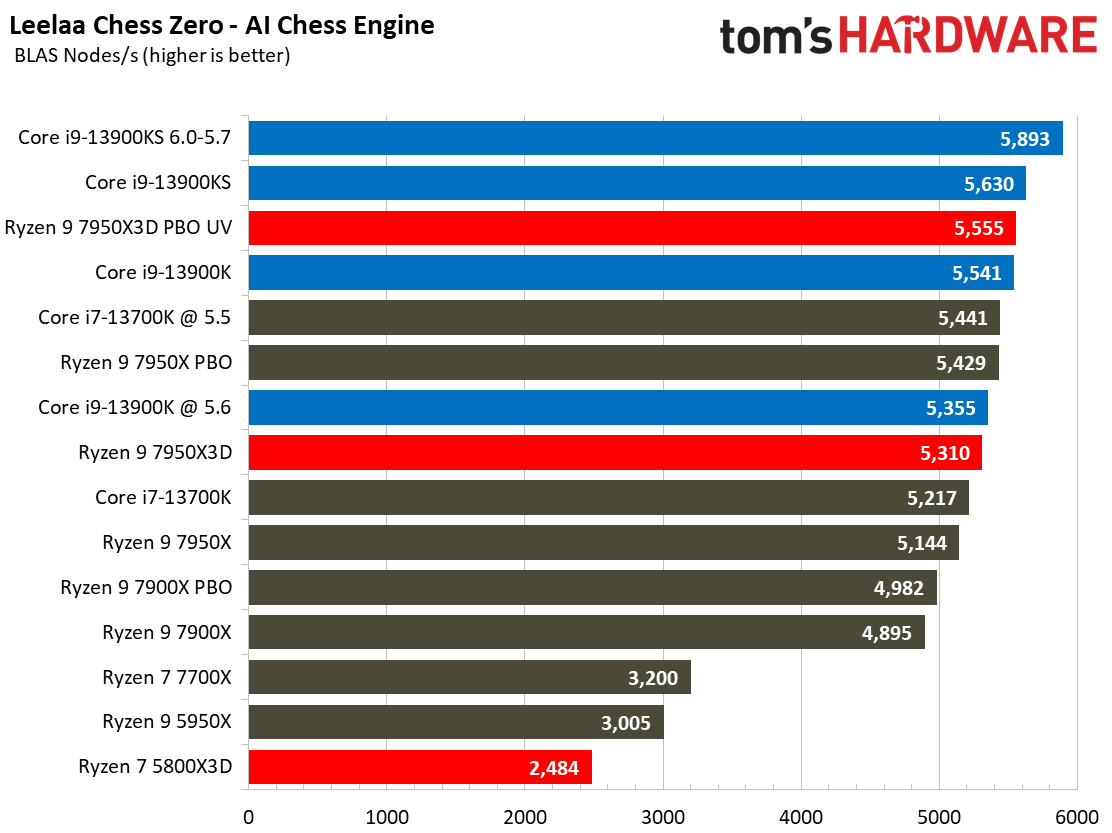
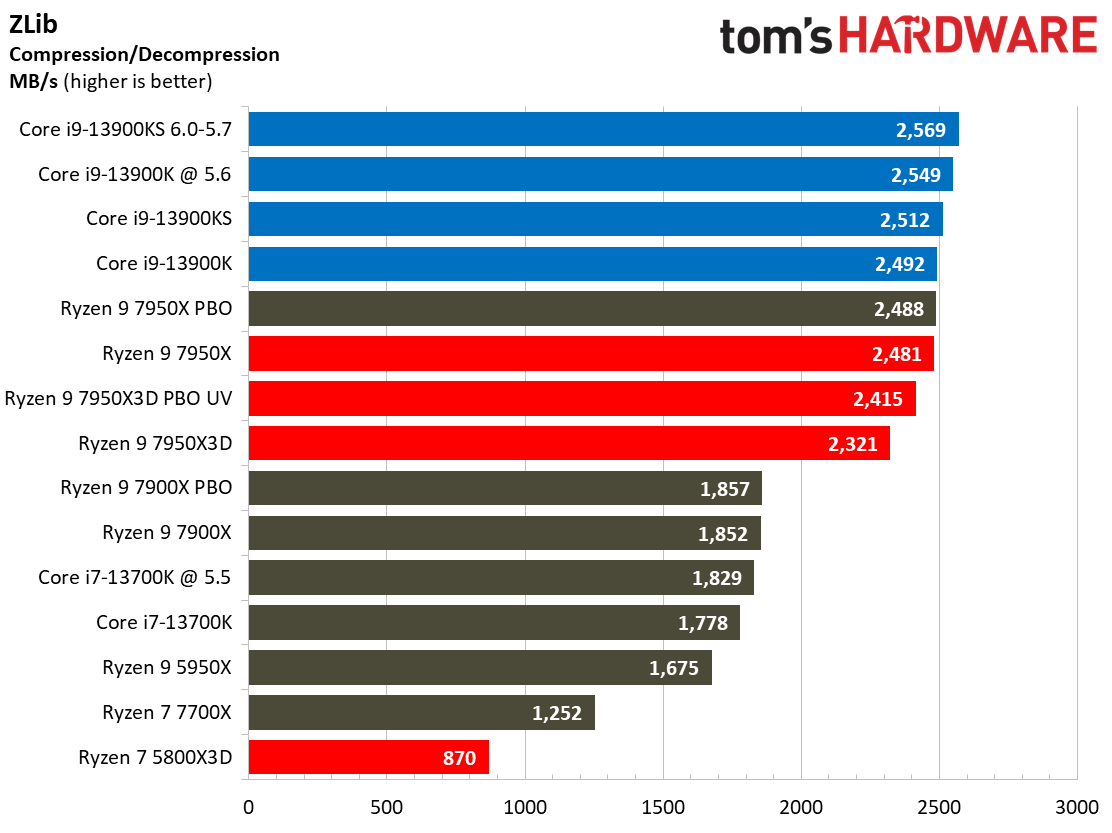
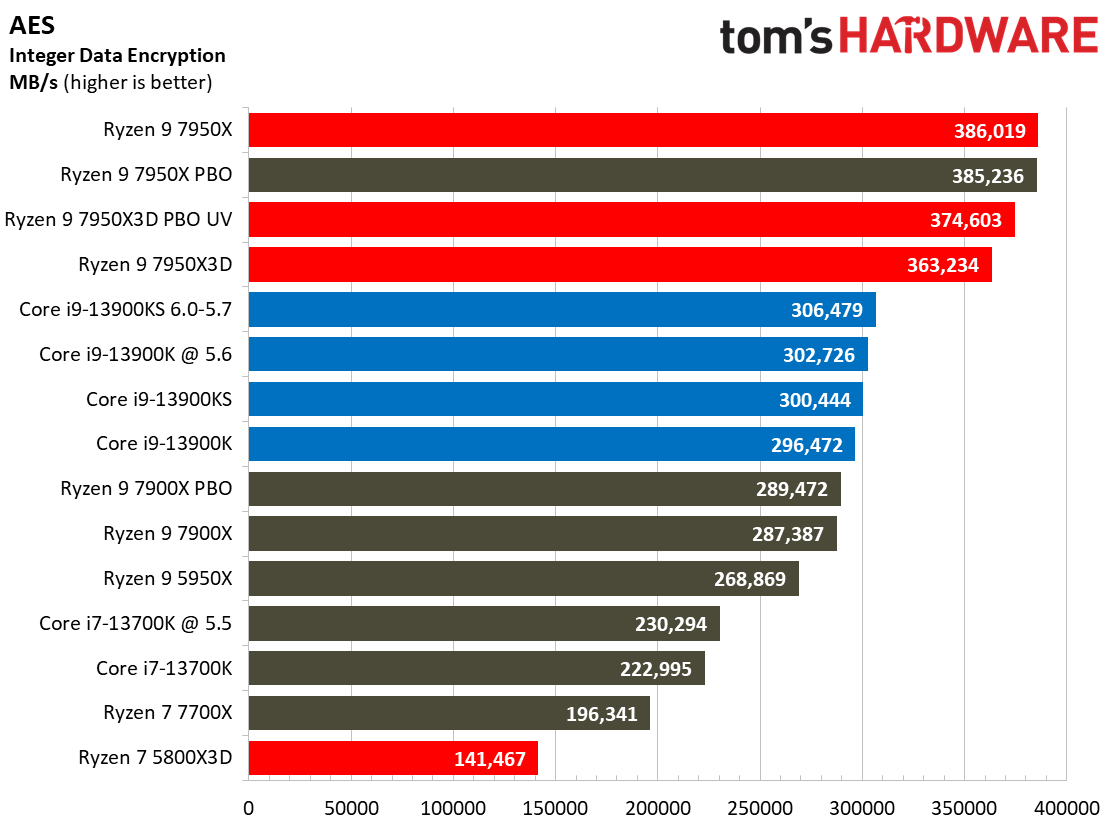
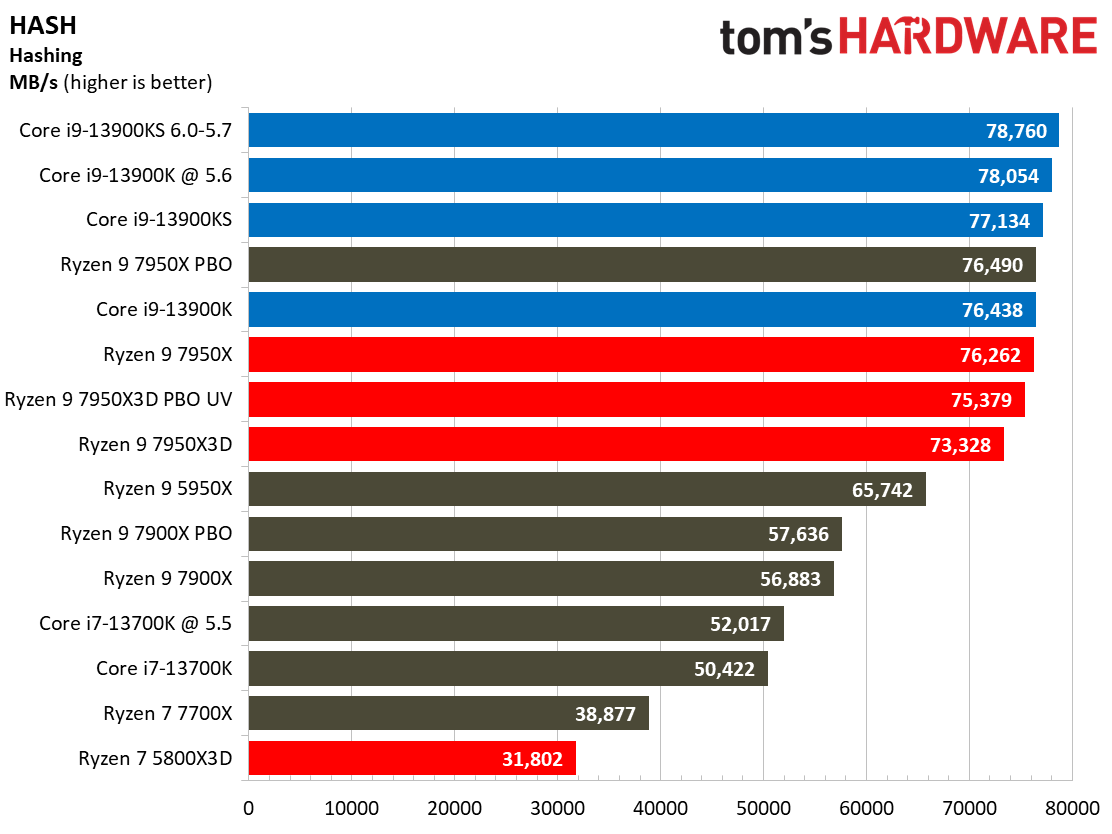
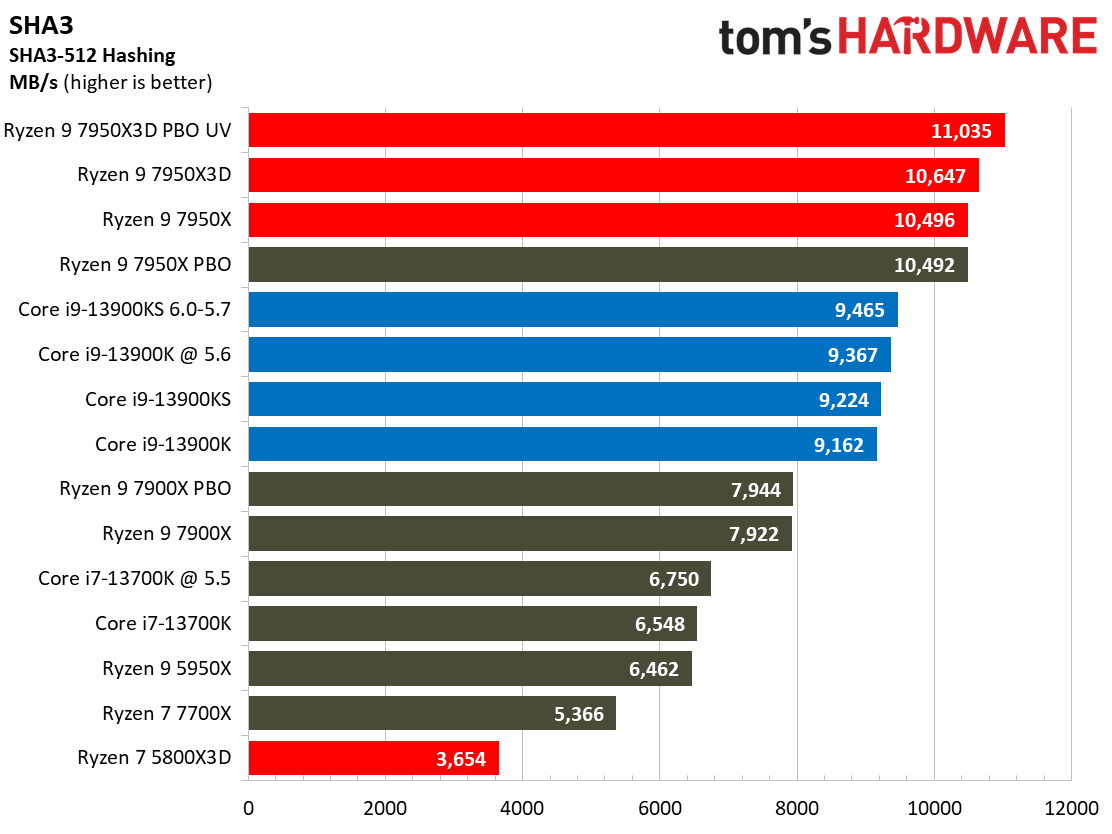
This selection of tests runs the gamut from the exceedingly branchy code in the LLVM compilation workload to the massively parallel molecular dynamics simulation code in NAMD to encryption and compression/decompression performance.
The demanding Y-cruncher benchmark computes Pi with the AVX instruction set and has optimizations for both Intel and AMD’s architectures. The Ryzen 9 7950X3D takes a comfortable lead in the single-threaded workload due to its support for AVX-512, a luxury the Raptor Lake chips don’t enjoy due to the hybrid x86 architecture. However, Intel narrows the contest when we flip to the threaded y-cruncher benchmark, primarily because it has higher memory throughput when all cores are active.
The Ryzen 9 7950X3D trails in many of these workloads, though it is impressive in the AES and SHA3 workloads. Meanwhile, the Intel chips score convincing wins in the LLVM and NAMD workloads.
Get Tom's Hardware's best news and in-depth reviews, straight to your inbox.
- MORE: Best CPU for gaming
- MORE: CPU Benchmark Hierarchy
- MORE: Intel vs AMD
- MORE: How to Overclock a CPU
Current page: AMD Ryzen 9 7950X3D Productivity Benchmarks
Prev Page AMD Ryzen 9 7950X3D Gaming Benchmarks Next Page Taking a Bite Out of Raptor Lake
Paul Alcorn is the Editor-in-Chief for Tom's Hardware US. He also writes news and reviews on CPUs, storage, and enterprise hardware.
-
PlaneInTheSky ReplySteep pricing
The cons just weigh too heavy for me to even consider the CPU or the AM5 platform.
No support for DDR4 memory
Reduced performance in some productivity apps
I already have DDR4. AMD expects me to just throw this into the trash and buy expensive new DDR5 for a 1% difference in performance. It even bothers me from an e-waste perspective, let alone the financial cost.
The fact performance of X3D CPU is all over the place bothers me too. Yes it's fast in -some- games, but then you get less overall performance in several important applications. If I just used my PC for gaming, I would have bought a console, I don't like the idea of having to make a trade-off with X3D CPU.
Another thing is, and this is not AMD specific but PC specific. The biggest issue with gaming on PC has been stuttering because shaders need to be runtime compiled on PC. This CPU will not solve this. When PC gaming becomes a meme, #stutterstruggle, I don't think many people are going to be willing to invest in $600+ CPU. Solve this problem, PC gaming is currently in shambles. -
cknobman Every single media outlet beating the "DDR5 cost" dead horse over and over again.Reply
When talking about ultimate gaming performance, which these 3D chips are designed for, saying the platform cost of DDR5 is a negative is stupid.
DDR4 is a dead end and should only be considered for budget builds and upgrades on older systems at this point.
Just let the "platform cost" argument go, otherwise test Intel with DDR4 and make proper comparisons showing what you get going with older and slower technology. -
PEnns Wow, AMD is for once forcing users to upgrade to new hardware.......and DDR5! How horrible!!Reply
I heard that lame story so many times before, Intel does it every 2-3 years!!! -
drivinfast247 Reply
I don't think they're targeting you specifically. No need to upgrade if not needed. Don't forget there's other people whom may be building their first PC or upgrading from a very old platform and the performance increase will be astronomical.PlaneInTheSky said:The cons just weigh too heavy for me to even consider the CPU or the AM5 platform.
I already have DDR4. AMD expects me to just throw this into the trash and buy expensive new DDR5 for a 1% difference in performance. It even bothers me from an e-waste perspective, let alone the financial cost.
The fact performance of X3D CPU is all over the place bothers me too. Yes it's fast in -some- games, but then you get less overall performance in several important applications. If I just used my PC for gaming, I would have bought a console, I don't like the idea of having to make a trade-off with X3D CPU.
Another thing is, and this is not AMD specific but PC specific. The biggest issue with gaming on PC has been stuttering because shaders need to be runtime compiled on PC. This CPU will not solve this. When PC gaming becomes a meme, #stutterstruggle, I don't think many people are going to be willing to invest in $600+ CPU. Solve this problem, PC gaming is currently in shambles.
Curious as to what games are struggling to run on PC and also what PCs are struggling to run games? Also, are those affected games also having issues on consoles?
My PC runs every game that I play without issues. And with the recent GPU upgrade I'll be happy for another year or so and will upgrade when needed. -
Elusive Ruse Reply
Ah cut the crap will you?PlaneInTheSky said:The cons just weigh too heavy for me to even consider the CPU or the AM5 platform.
I already have DDR4. AMD expects me to just throw this into the trash and buy expensive new DDR5 for a 1% difference in performance. It even bothers me from an e-waste perspective, let alone the financial cost.
The fact performance of X3D CPU is all over the place bothers me too. Yes it's fast in -some- games, but then you get less overall performance in several important applications. If I just used my PC for gaming, I would have bought a console, I don't like the idea of having to make a trade-off with X3D CPU.
Another thing is, and this is not AMD specific but PC specific. The biggest issue with gaming on PC has been stuttering because shaders need to be runtime compiled on PC. This CPU will not solve this. When PC gaming becomes a meme, #stutterstruggle, I don't think many people are going to be willing to invest in $600+ CPU. Solve this problem, PC gaming is currently in shambles.
You have no intention of upgrading to anything, you have admitted it before. All you do here is dump on new tech because for some reason you cannot deal with change. You have an axe to grind when it comes to AMD and anything that puts your fossil of a setup into perspective.PlaneInTheSky said:My PC from 14 years ago still browses the internet just fine. It still does Spotify, Netflix, indie gaming, etc.
At some point your average PC became "good enough" for most tasks.
This is starting to happen with PC gaming too. While AAA developers still bother to spend years making "uber graphics", most developers have long stopped with this rat race because better graphics rarely translates to better sales.
-
Elusive Ruse Reply
Especially considering that Intel's 13th gen would take a massive performance plunge if paired with DDR4.cknobman said:Every single media outlet beating the "DDR5 cost" dead horse over and over again.
When talking about ultimate gaming performance, which these 3D chips are designed for, saying the platform cost of DDR5 is a negative is stupid.
DDR4 is a dead end and should only be considered for budget builds and upgrades on older systems at this point.
Just let the "platform cost" argument go, otherwise test Intel with DDR4 and make proper comparisons showing what you get going with older and slower technology.
It is intellectually disingenuous to put lack of DDR4 support as a con here, if only for the reason that it has already been established that AM5 doesn't support it. Is Tom's Hardware going to put "Lack of DDR4 support" as a con for every CPU that comes out from now on? -
lmcnabney Excellent article.Reply
I noted that Paul mentioned AMD's specification to use water-cooling on the X3D lineup. After noting the low power usage of these chips I am curious as to why. Has the chip been tested using a more typical air cooled tower fan (with both standard, PBO, and PBO-UV) to determine if water-cooling is even necessary? -
Elusive Ruse Reply
According to AMD, V-cache is sensitive to heat; that's why they decreased the TjMax to 89c and reduced the TDP as well. I assume that's also why they instructed reviewers to use water-cooling.lmcnabney said:Excellent article.
I noted that Paul mentioned AMD's specification to use water-cooling on the X3D lineup. After noting the low power usage of these chips I am curious as to why. Has the chip been tested using a more typical air cooled tower fan (with both standard, PBO, and PBO-UV) to determine if water-cooling is even necessary? -
Alvar "Miles" Udell 13% faster in games at 1920x1080 comparing stock to stock for 20% more money (or 25% if using the current discount)...that's proper gamer logic for sure.Reply
If anything it's an advertisement for the 5800x3d. 16% slower at 1920x1080 yet only 44% of the price, plus the platform cost is far cheaper and all you sacrifice is PCIe 5.0.
