ASRock FM2A78M-HD+ & FM2A78M-ITX+ Review
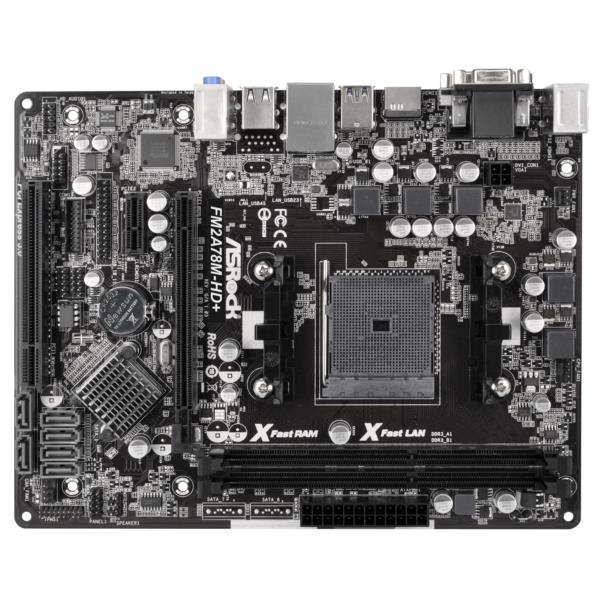
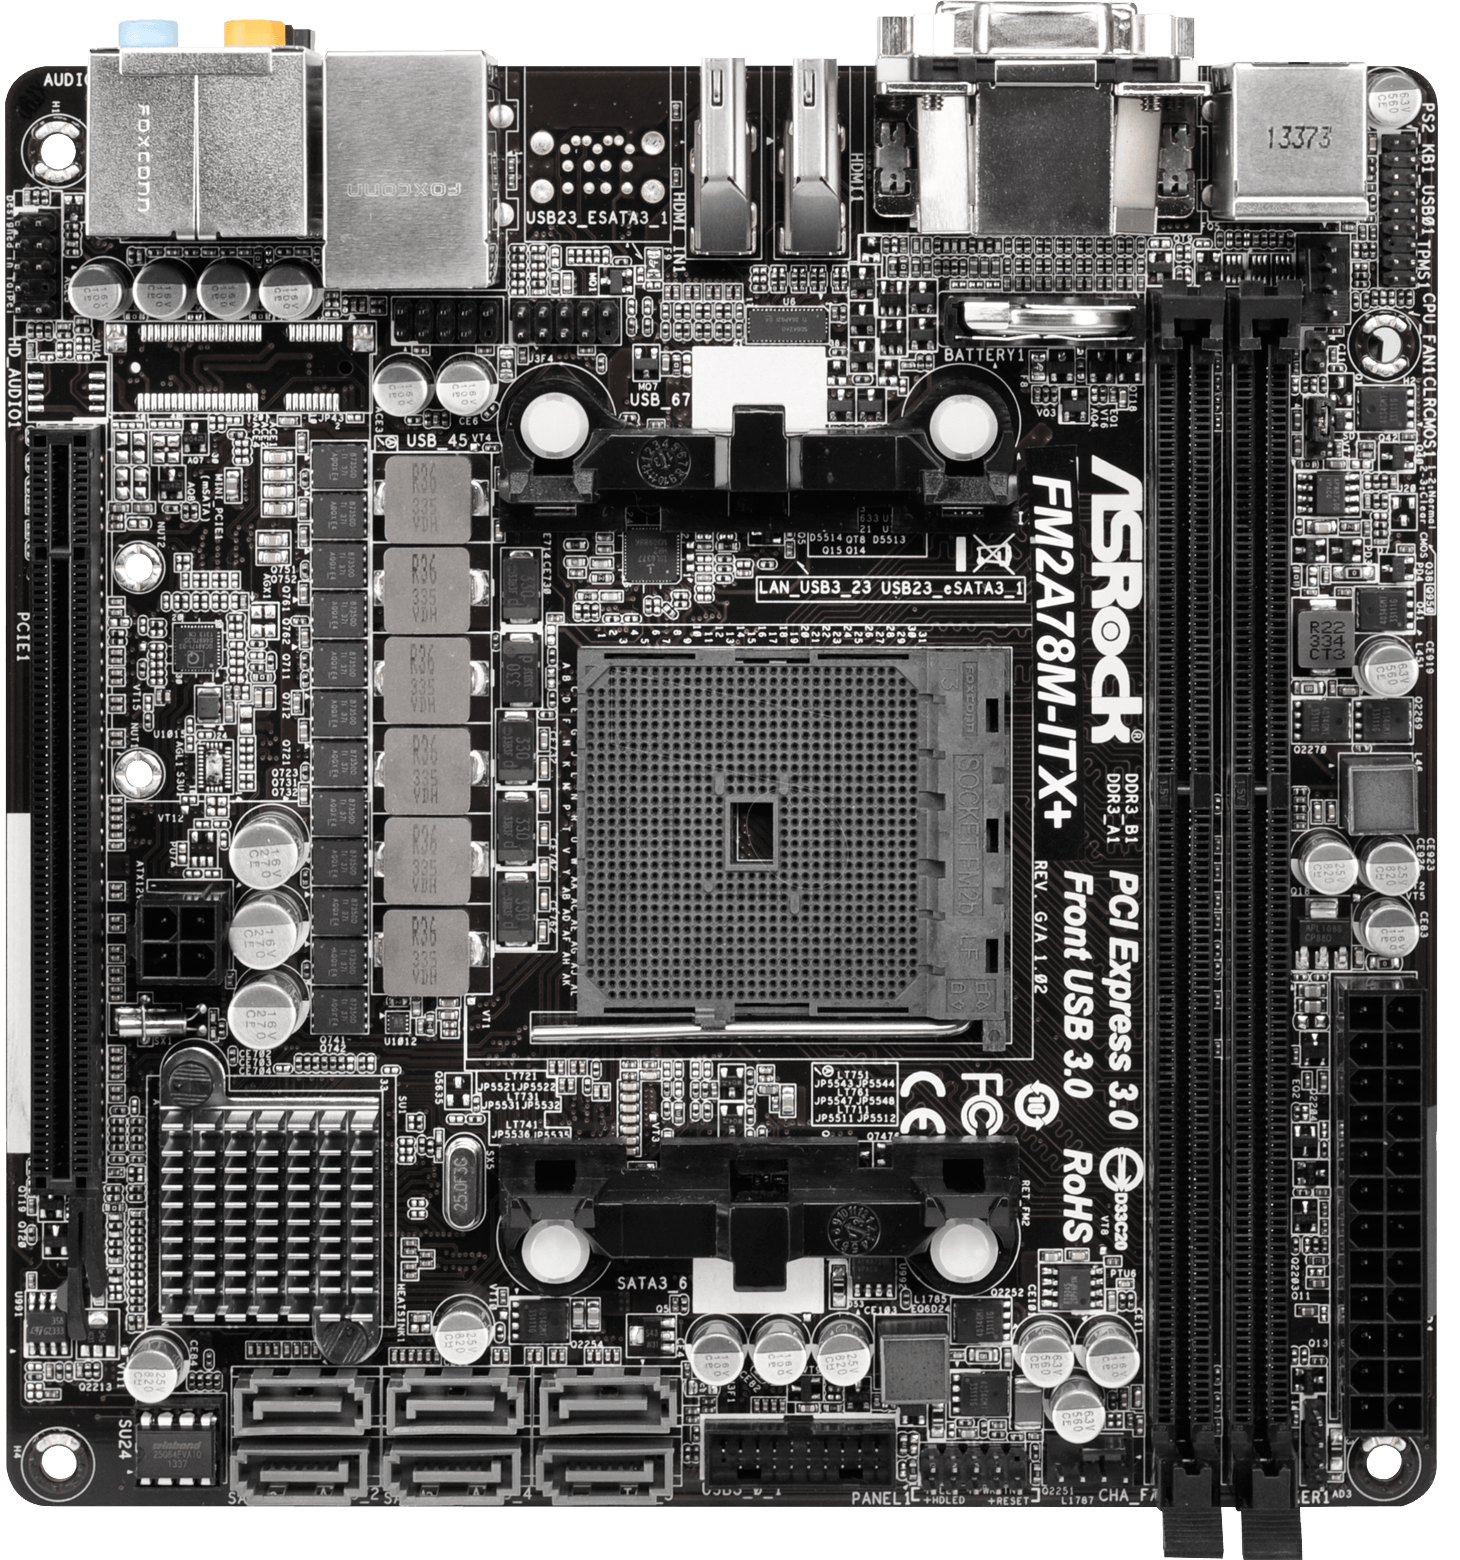
Today, we have a pair of AMD FM2+ boards from ASRock on the test bench: the FM2A78M-HD+ and the FM2A78M-ITX+.
Why you can trust Tom's Hardware
How We Test, Results, Power, Temperature & Overclocking
How We Test
Test System Components
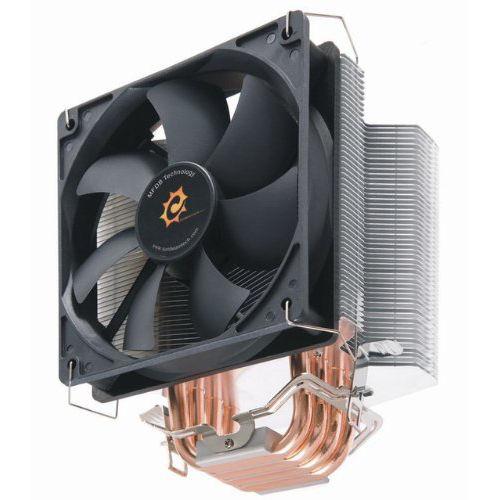
A Sunbeamtech cooler was utilized to provide maximum air cooling capacity across all A78 test platforms. Zalman's ZM-STG1 paste was used as the thermal compound for this test platform. Even though this cooler dwarfs both test systems, who ever said too much cooling was a bad thing?
Mushkin was kind enough to supply the motherboard review team with the same brand and part numbers for memory and solid-state disks to better compare system configurations between our Intel and AMD budget systems. This will better eliminate DRAM inconsistency when comparing memory controller performance.
Though this APU has enough graphics muscle to drive decent framerates at lower detail levels, the motherboard review team decided to put in a low-power GPU to help put both AMD and Intel budget systems on a "fair" playing field. For that, a Gigabyte GT 730 GPU was installed for graphics workloads so we can test system stability and repeatability across platforms. Both motherboards do support AMD Dual Graphics Technology, so you will be able to install an AMD GPU and set up Crossfire with the APU.
To power these test boards, we are utilizing the be-quiet! Straight Power 10 500W. Since it is 80 PLUS Gold-rated, this unit will prove to be more accurate at low-load conditions, and the modular connections help eliminate clutter on my test bench.
Software & Drivers
| Graphics | Nvidia |
|---|---|
| Chipset | AMD A78, A88X, and Intel H81 |
Benchmark Suite
Get Tom's Hardware's best news and in-depth reviews, straight to your inbox.
| PCMark 8 | Version: 2.3.293 Work, Home, and Creative Benchmarks |
|---|---|
| SiSoftware Sandra | Version: 2015.01.21.15 CPU Arithmetic, Multimedia, Cryptography File System Bandwidth Memory Bandwidth |
| Cinebench R15 | Version: R15.0 x64 CPU Single and Multi-Core |
| 3DMark | Cloud Gate Version: 1.1, Skydiver Version: 1.0 Test Set 1: Cloud Gate, 1920x1080, Default Preset Test Set 2: Skydiver, 1920x1080, Default Preset |
| Unigine Heaven 4.0 | Version 4.0, Built-in Benchmark DirectX 11, Low Detail, 1920x1080, No AA, No Tesselation |
| Unigine Valley 1.0 | Version 1.0, Built-in Benchmark DirectX 11, Low Detail, 1920x1080, No AA |
Test Results
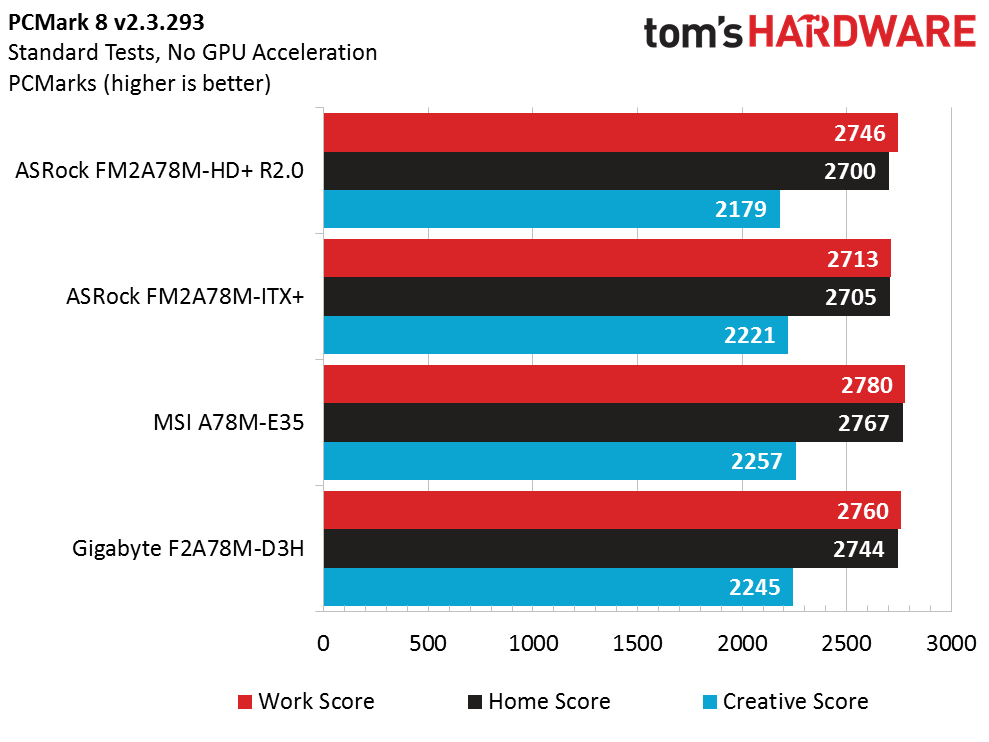
With tests of two other A78 boards evaluated using the same components under my belt, I'll be able to do an apples-to-apples comparison across all test conditions.
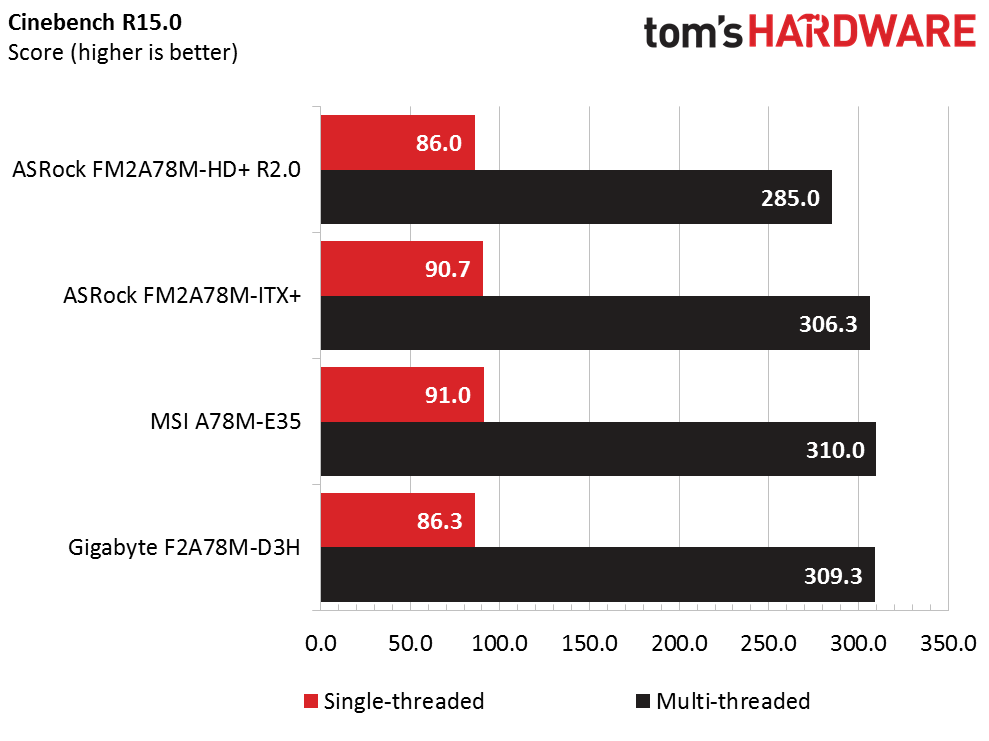
Across the board, both motherboards appear to show lower performance on all the canned synthetic scenarios. The HD+ shows up to two percent weaker performance when compared to the average, whereas the ITX+ seems to only struggle by up to 1.5 percent. These results are negligible, and any normal user will most likely not notice the difference.
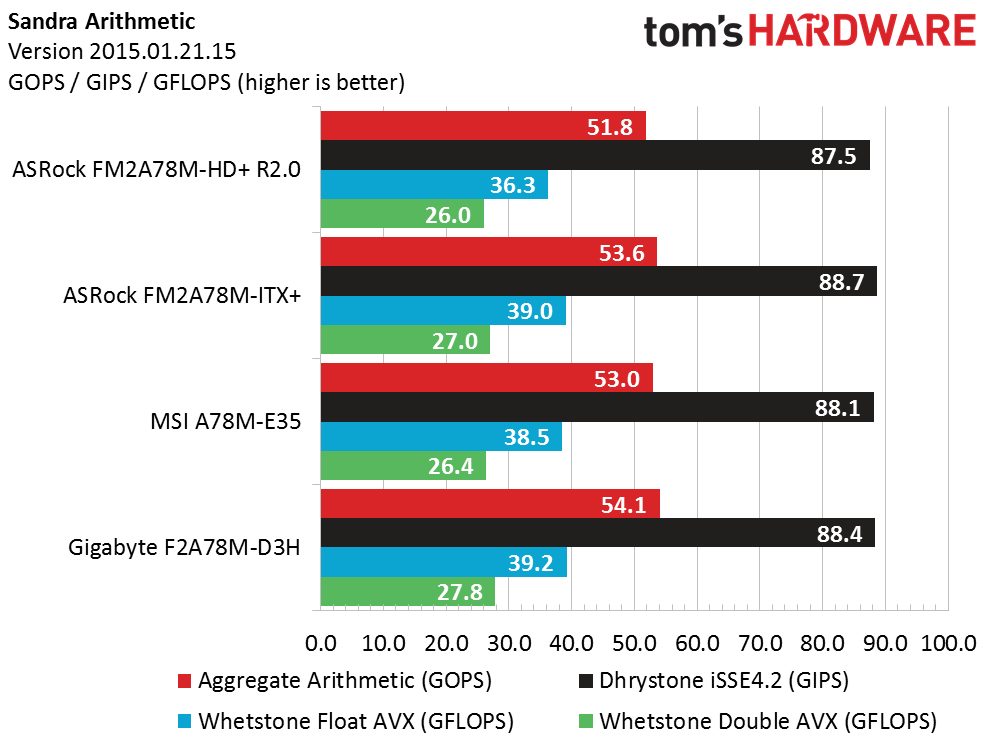
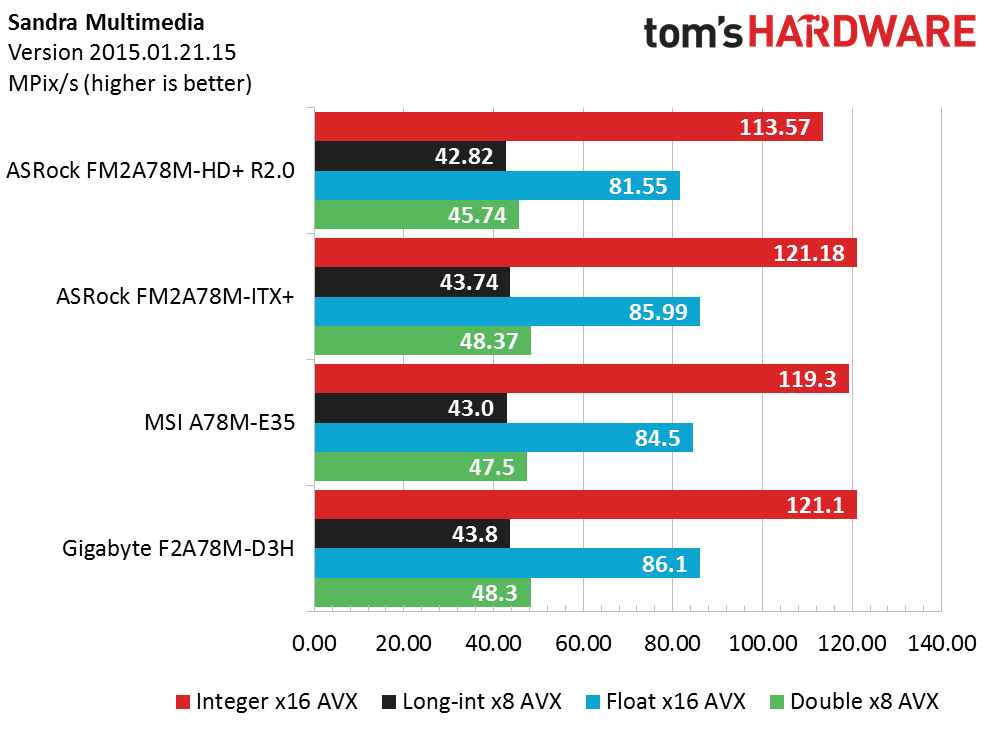
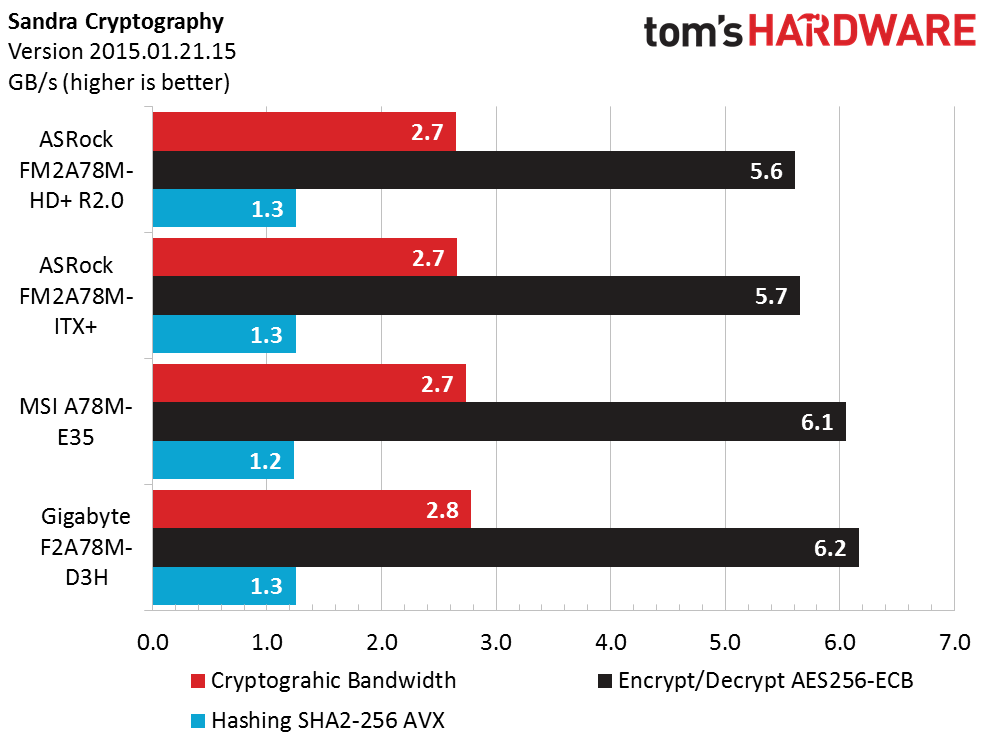
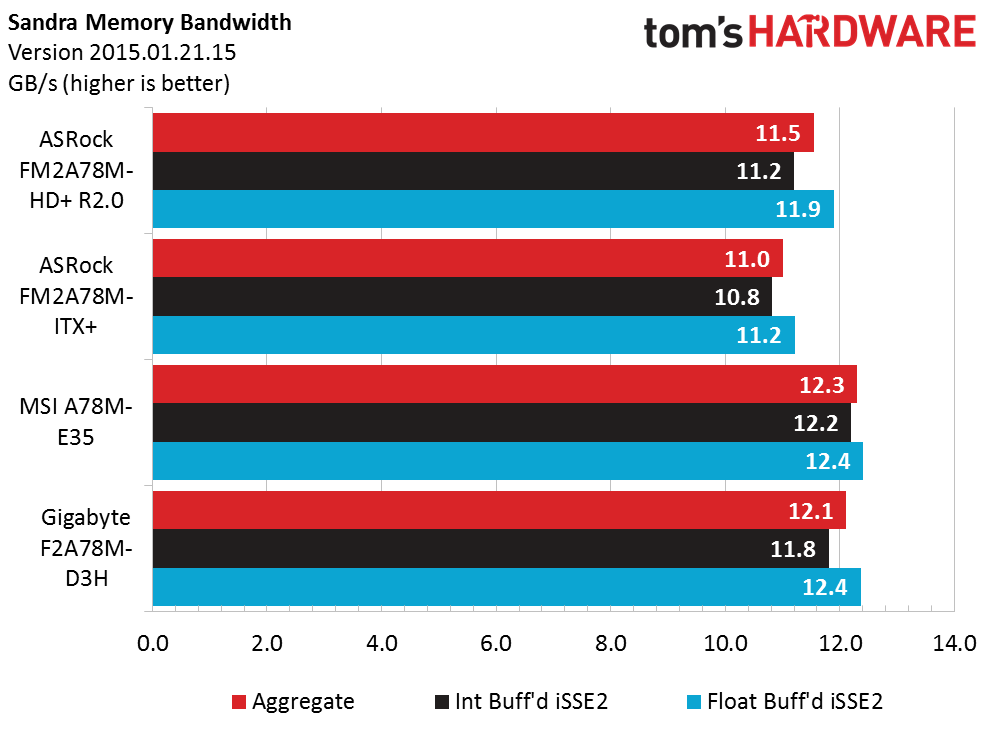
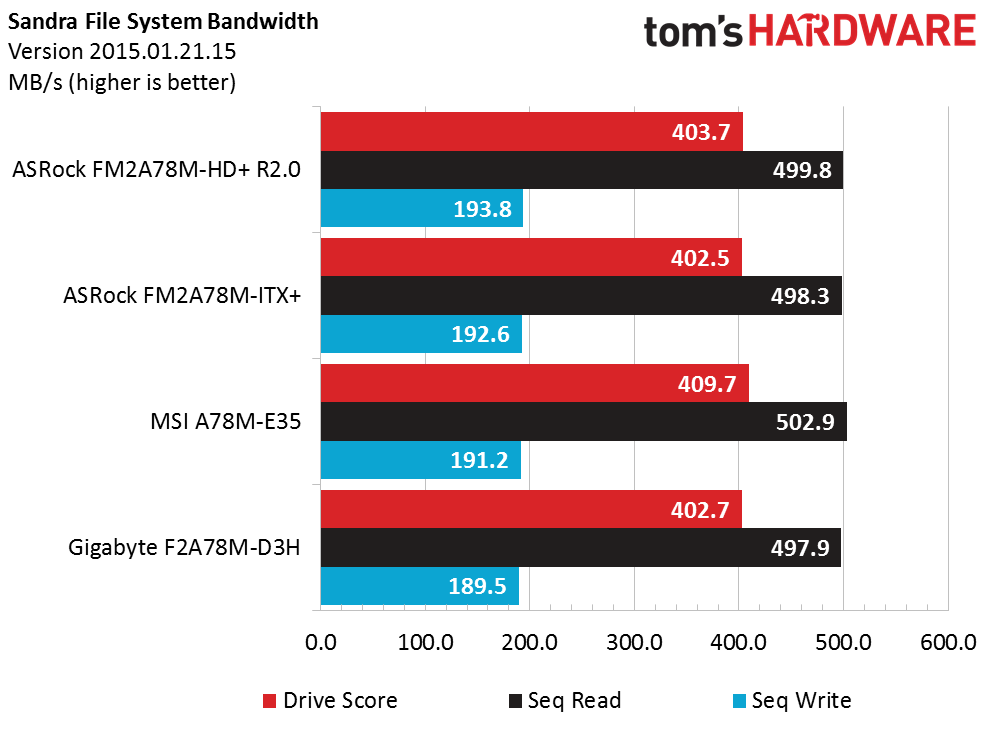
Similar performance is observed in the Sandra suite, however, the ITX+ does start to perform marginally better on some tests. The HD+ appears to show up to 3.5 percent lower performance when compared to the average across all the tests, with the multimedia suite showing the poorest results. The ITX+ trades blows with the Gigabyte board on the arithmetic and multimedia tests, but memory bandwidth appears to be a huge hit, scoring six percent below the average score. The MSI board performs right in line with the average across all the Sandra tests.
Again, the HD+ shows scores nearly six percent below the average score on the multi-threaded scenario, and the ITX+ performs admirably despite the small form-factor.
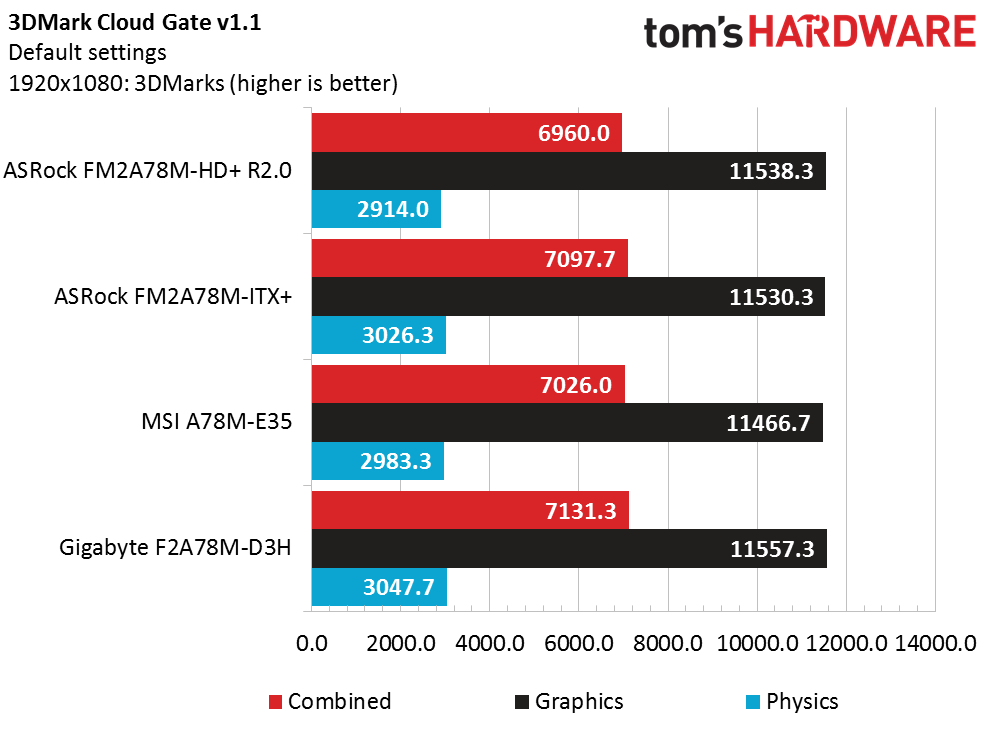
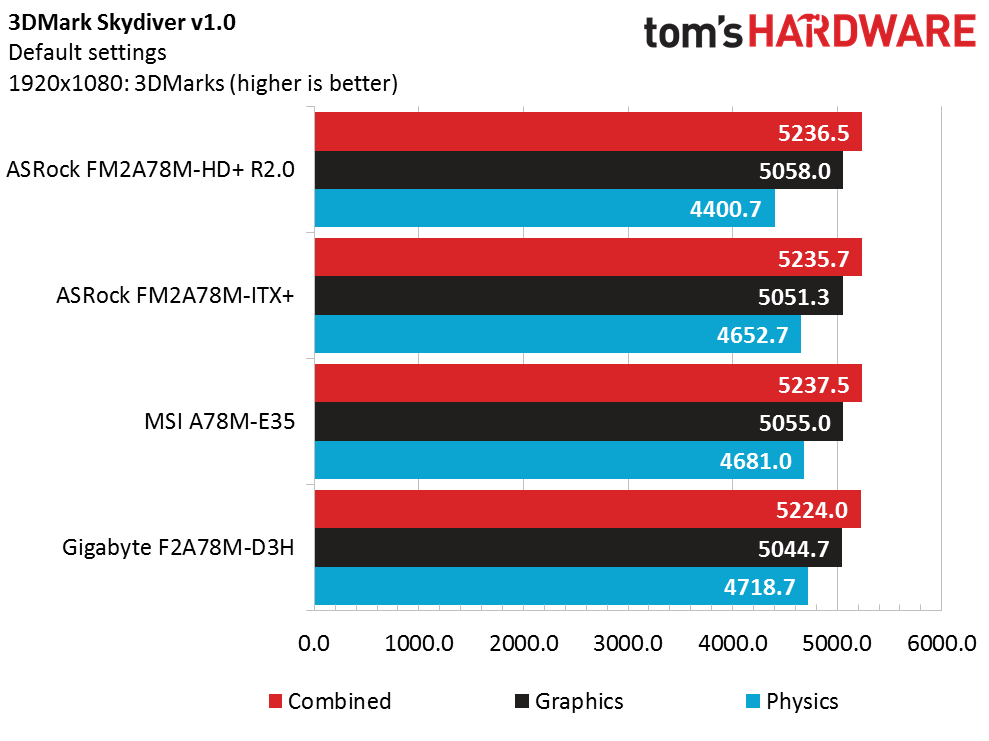
With less than two percentage points separating the top performer (Gigabyte F2A78M-D3) from the bottom performer (HD+), these tests show that synthetics can only tell part of the story. However, the trend of the HD+ lagging is consistent, and it'll need something to help level the playing field.
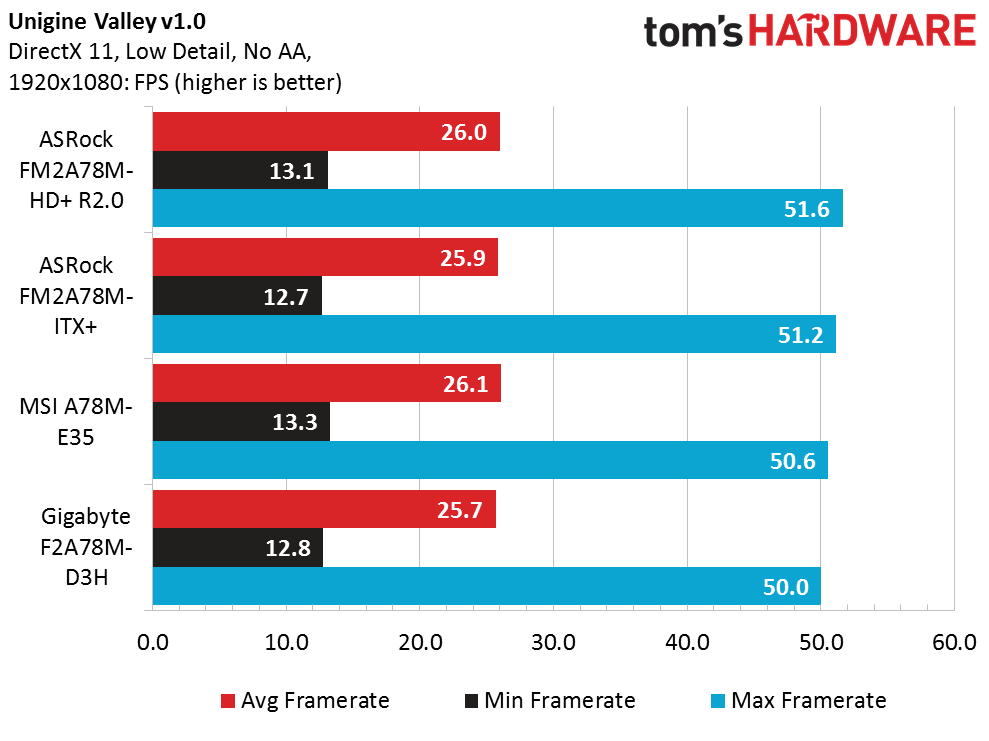
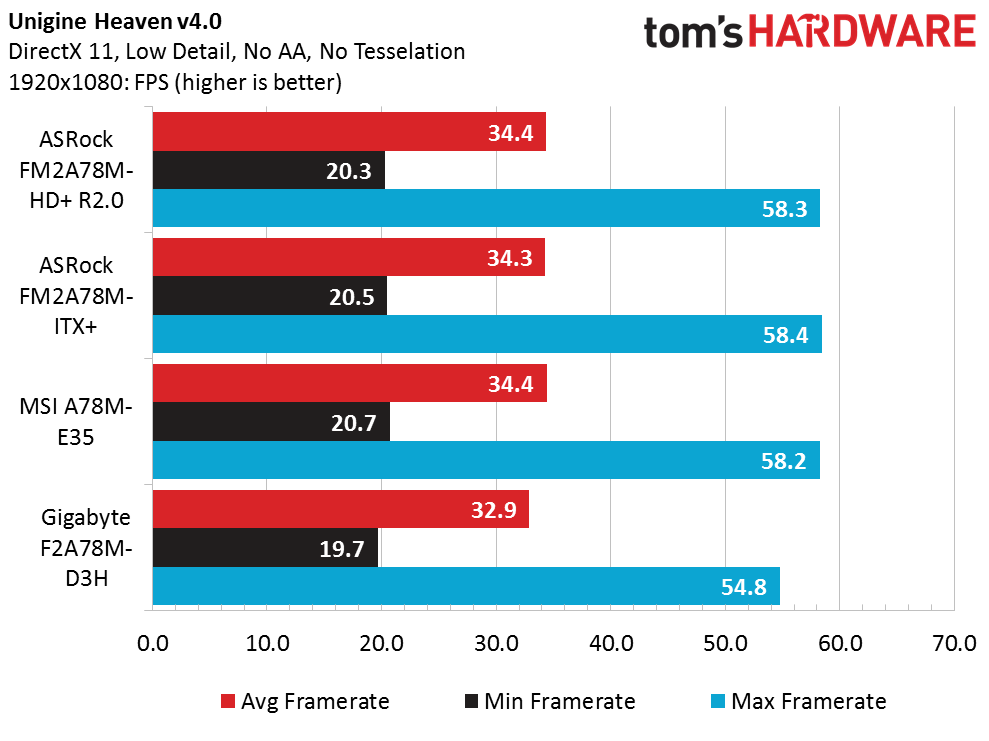
Finally, a workload in which the HD+ is playing above the curve! For both average and max frame rates, the HD+ comes out ahead of our previous top performer (Gigabyte) and also edges out the ITX+ in the Valley benchmark. Even at these frame rates, the HD+ can take the win to the bank!
Power
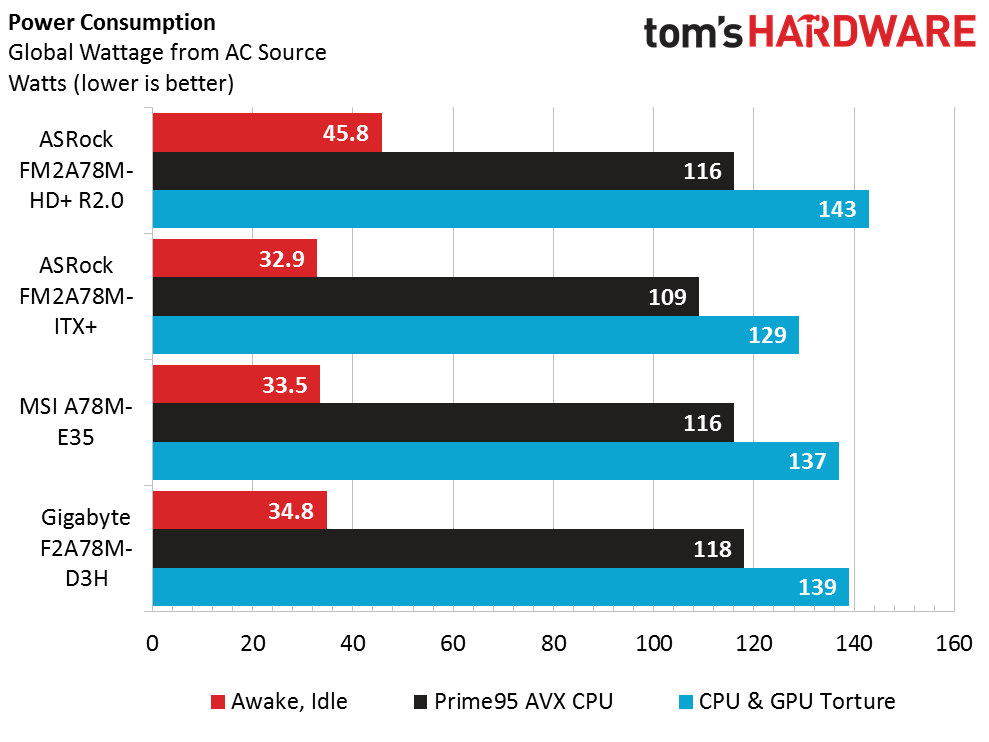
At idle, it's clear that the HD+ burns a significant amount of power, nearly 25 percent above the average. However, as we increase the load, the system appears to be running within 5W of the average, which is completely acceptable for a desktop system. The ITX+, though, is our efficiency king, running 5W below the average while operating Prime95, and 8W below full-system load. For an HTPC, this will be crucial for keeping the system running with maximum stability.
Temperature
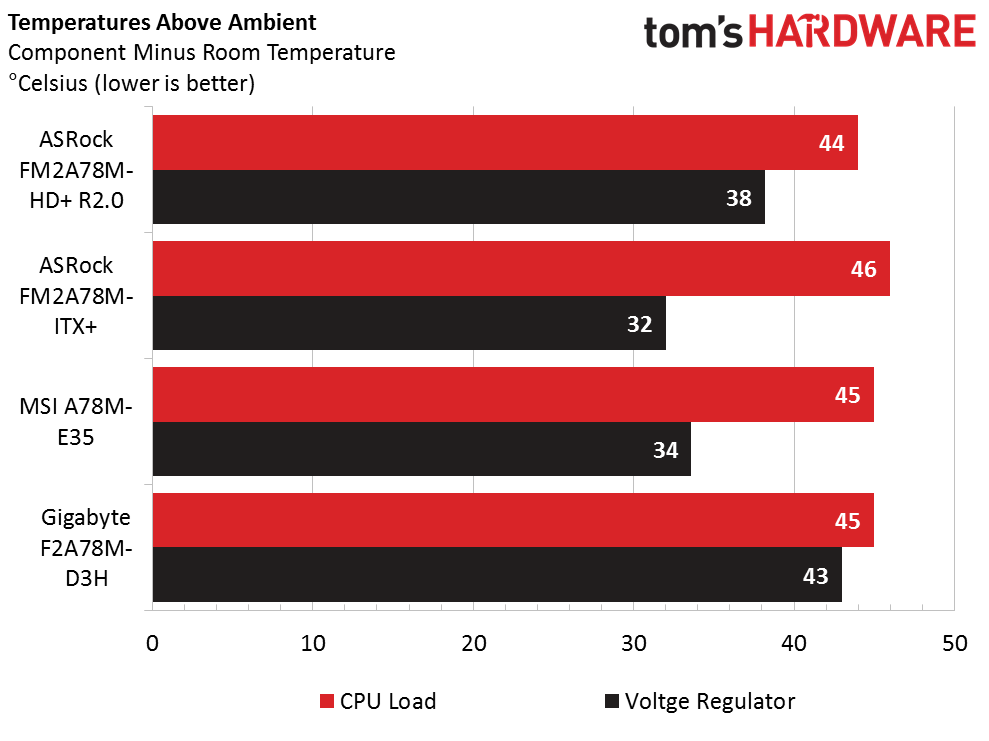
Looking at the chart, we see two trends: the HD+ and Gigabyte appear to be running hotter at the regulators when running full load, while the ITX+ and MSI boards appear to be running cooler. Given the target applications for all boards, these results are exactly what I want to see for larger and smaller cases, respectively. A word of caution: the regulators on the ITX+ board are directly below my heat sink, so if a fan is used to blow down across the heat sink, I would expect to see lower temperatures on the regulators.
Overclocking
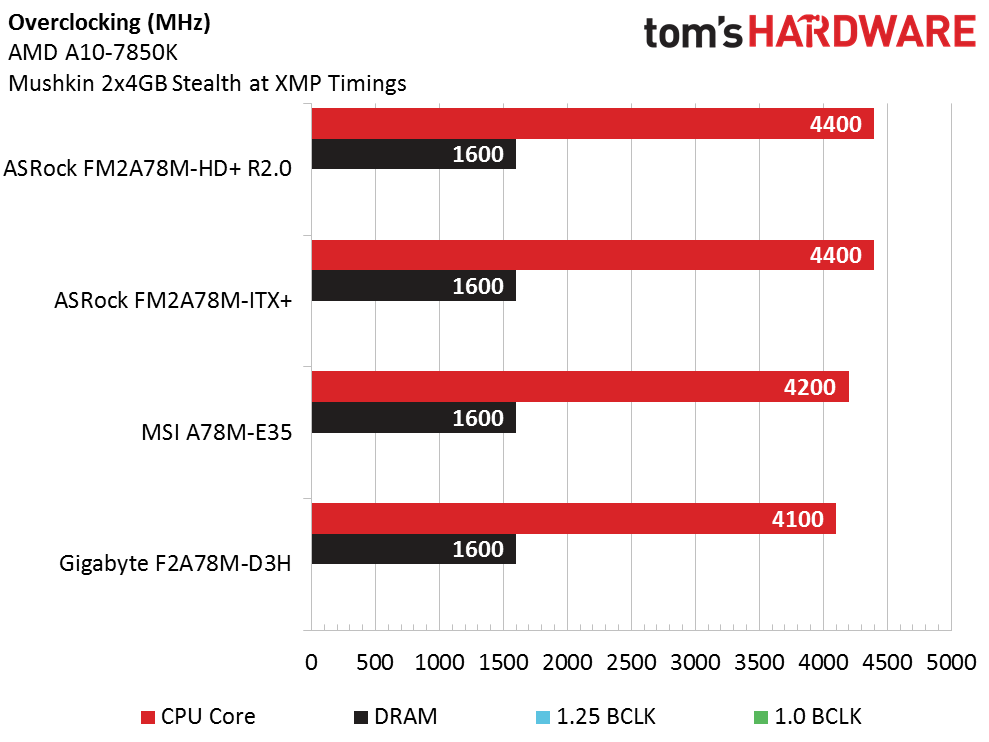
Since I didn't perform a full overclock test on the MSI and Gigabyte boards last time, let's look only at the two ASRock systems. At first glance, both boards hit the 4400MHz overclock, but it's important to note how I got there. With the HD+ board, I was able to hit the 44x multiplier with a lower voltage of 1.4125V. While running Prime95 for 8 hours, I measured regulator temps of 91 degrees Celsius and system power of 158W at the plug. For the ITX+, it took an additional 12.5mV of voltage to hit the same multiplier, measuring in at 70C and 148W. Overall, I was satisfied with both samples' ability to achieve this multiplier, but they also both sacrifice crucial factors compared to their target system. The HD+'s additional power is not a desirable side effect, but the ITX+'s 40C jump in regulator temperatures is clearly more than I would like to allow.
Current page: How We Test, Results, Power, Temperature & Overclocking
Prev Page FM2A78M-HD+ & FM2A78M-ITX+ Layout Next Page Value & Conclusion-
FCsean At the time of this writing, three of the four boards retail for an average of $60. However, the ITX+ board is retailing for nearly 60 percent more at $84.99!Reply
Not sure how 84.99 is 60% more than 60. maybe 40%. -
ktolo I still don't know why i keep seeing APU's tested with 1600 memory.. when the world and his dog knows that when you pair these chips with faster memory it unlocks a fair bit more performance. 2133MHz minimum for these APU's - the 7850K can work with 2400MHzReply -
Onus ktolo, you have a point for actual use, however he did mention in the beginning we're all using the same RAM which can allow some direct comparison across all our motherboard review articles.Reply
For my part, as I test a variety of systems, despite sometimes notable benchmark differences, there is little practical difference in the end-user experience. In the bad old days of single and dual-core CPUs, everything mattered at the margin; now I think that is less true. This may be why AMD still manages to sell CPUs, as long as the price is right. Intel may indeed run rings around them, but in actual use the difference doesn't feel that great. -
TheTerk ReplyAt the time of this writing, three of the four boards retail for an average of $60. However, the ITX+ board is retailing for nearly 60 percent more at $84.99!
The ITX+ retails on Newegg for $95 bucks. It is currently on sale for $84 and it looks like the rebate is still available until the end of January.
Not sure how 84.99 is 60% more than 60. maybe 40%. -
Crashman We love the Terk. Unfortunately, motherboard companies aren't loving AMD at the moment: Getting samples has been a problem. So if anyone knows about something released in the past year that we should have tested, speak up and we'll pester those companies.Reply -
damric I have been known to crossfire on the A88X platform. The platform has numerous advantages over AM3+, including PCIE 3.0, CPU on-die northbridge, and lack of Hyper Transport bottleneck. Also Steamroller cores have more IPC and twice as many decoders per module as Piledriver cores. I'm not sure why anyone would purchase an AM3+ platform at this point actually, unless getting one very cheap second hand.Reply -
RedJaron Jake, as you say, A88X boards tend to have somewhat better components than A78 boards. To the APU tweaker and tuner, the higher quality board would be appreciated in OCing. The value of FM2 and APU OCing is of course a whole 'nother topic, but if you're going to do it, I would generally prefer an A88X board.Reply
You are quite right that a media and HTPC can do well on the cheaper A78, just like I'd go with a B85 or H81 on the Intel side for such a machine. -
logainofhades The newegg link, for the M-ITX board, on the last page, takes you to the M-ATX one, for some reason.Reply -
Rexolaboy DDR3 1600mhz with an APU? At least see how adding the 2133mhz ram improves performance. We see overclocked GPU's in reviews, you even oced the CPU in this review, but 1600mhz ram is almost pointless in an APU platform, especially when the price difference is maybe $10-$15 for 2x4 gb. I would have liked seeing a current review of AMD Dual Graphics with the motherboard and new Crimson Drivers. Guess I'll have to watch more foreign youtube videos.... :(Reply
