Asus PQ321Q 4K Monitor Review: Top-Shelf Ultra HD For $3500
We recently got our hands on Asus’ highest-end Ultra HD-capable screen. The PQ321Q offers a native resolution of 3840x2160; and those 8.3 million pixels don’t come cheap. Our real-world and lab testing will tell you if this 4K display is worth $3500.
Results: Grayscale Tracking And Gamma Response
The majority of monitors, especially newer models, display excellent grayscale tracking (even at stock settings). It’s important that the color of white be consistently neutral at all light levels from darkest to brightest. Grayscale performance impacts color accuracy with regard to the secondary colors: cyan, magenta, and yellow. Since computer monitors typically have no color or tint adjustment, accurate grayscale is key.
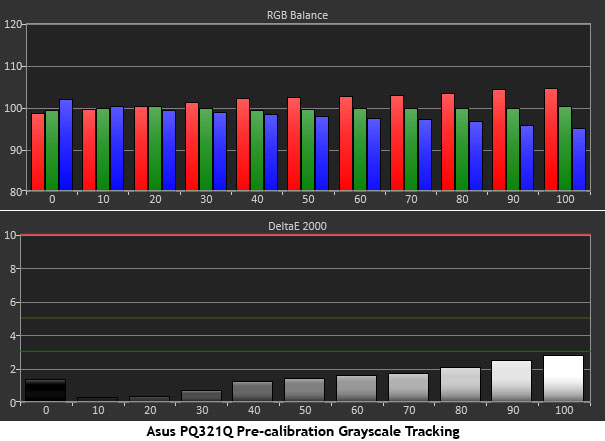
This is the PQ321Q’s Standard color mode with the grayscale preset at 6500K. The graph shows a slightly warm result, where red rises slightly with brightness. If you look at the Delta E errors, however, they are all under three, which means they’re invisible. We were perfectly happy to use Asus' display in an uncalibrated state.
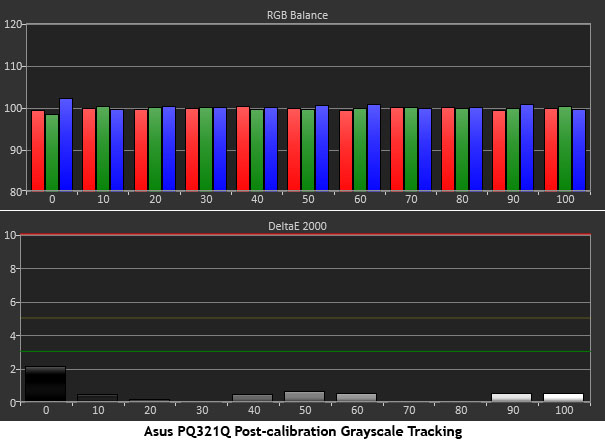
Since our goal is always perfection, we used all of the available controls to try improving the grayscale result.
This is a near-perfect chart. The Delta E errors at 30, 70, and 80 percent are only .07! And every other level is well below one, except zero percent. We’ve never seen any display, of any type, turn in such strong results. We attribute the performance to Asus' high and low RGB sliders and the extremely precise resolution they enable.
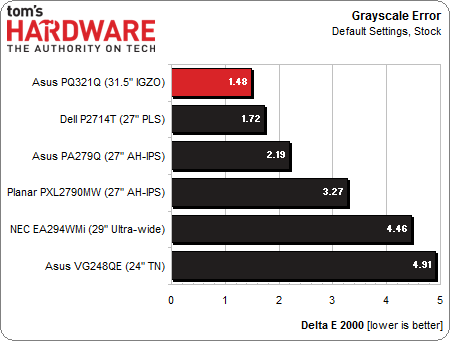
Here’s our comparison group of the last six desktop monitors reviewed at Tom’s Hardware.
We said in our review of the Dell P2714T that it was a display that didn’t need calibration. Now we’re adding the Asus PQ321Q to the same list. An average Delta E error of 1.48 is pretty much negligible. You won’t be able to see it with a naked eye. Only our i1Pro knows the difference.
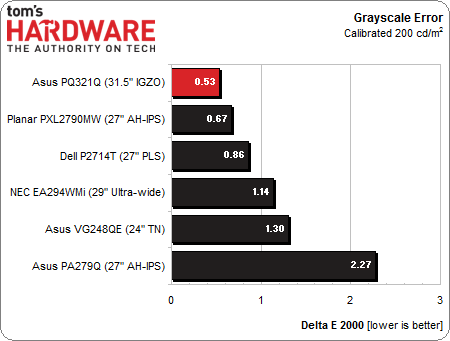
The calibrated result is even more impressive.
Get Tom's Hardware's best news and in-depth reviews, straight to your inbox.
Considering the error at zero percent is 2.16 Delta E, the average figure of .53 is almost unbelievable. If you take that brightness level out of the equation, the average drops to an incredible .37!
Gamma Response
Gamma is the measurement of luminance levels at every step in the brightness range from 0 to 100 percent. This is important because poor gamma can either crush detail at various points or wash it out, making the entire picture appear flat and dull. Correct gamma produces a more three-dimensional image, with a greater sense of depth and realism. Meanwhile, incorrect gamma can negatively affect image quality, even in monitors with high contrast ratios.
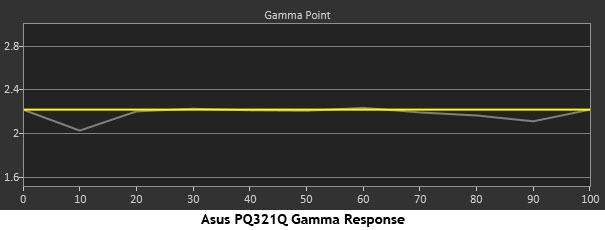
In the gamma charts below, the yellow line represents 2.2, which is the most widely accepted standard for television, film, and computer graphics production. The closer the white measurement trace comes to 2.2, the better.
The PQ321Q’s gamma tracking is almost perfect except for 10 and 90 percent, which are just a bit too bright. The error at 10 percent represents only .72 cd/m2 and the 90 percent error is 1.85 cd/m2. That's too tiny to see without the aid of instruments.
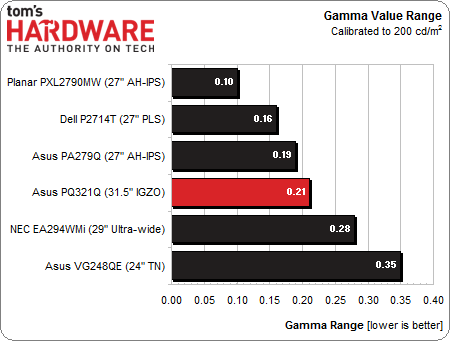
Here’s our test group again for the gamma comparisons.
A variance of .21 indicates very tight gamma tracking. You can see from the graph above that the PQ321Q’s gamma is extremely accurate. You’ll need to change the gamma preset from Standard to 2.2 to accomplish this. This really helps improve image quality, even though the measured contrast is on the low side.
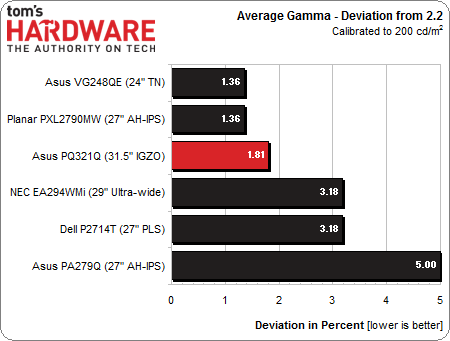
We calculate gamma deviation by simply expressing the difference from 2.2 as a percentage.
The PQ321Q is only 1.81 percent off the target value of 2.2, matching the very best displays we’ve tested. Along with grayscale, this is an area where we’re seeing consistent improvement in newer screens.
Current page: Results: Grayscale Tracking And Gamma Response
Prev Page Results: Brightness And Contrast Next Page Results: Color Gamut And Performance
Christian Eberle is a Contributing Editor for Tom's Hardware US. He's a veteran reviewer of A/V equipment, specializing in monitors. Christian began his obsession with tech when he built his first PC in 1991, a 286 running DOS 3.0 at a blazing 12MHz. In 2006, he undertook training from the Imaging Science Foundation in video calibration and testing and thus started a passion for precise imaging that persists to this day. He is also a professional musician with a degree from the New England Conservatory as a classical bassoonist which he used to good effect as a performer with the West Point Army Band from 1987 to 2013. He enjoys watching movies and listening to high-end audio in his custom-built home theater and can be seen riding trails near his home on a race-ready ICE VTX recumbent trike. Christian enjoys the endless summer in Florida where he lives with his wife and Chihuahua and plays with orchestras around the state.
-
cynic77 "We’re sure it’s only a matter of time before an Ultra HD panel becomes available in wide-gamut form."That time is now. The Dell 24" UP2414Q and 32" UP3214Q are Ultra HD monitors that cover 100% sRGB and 99% AdobeRBG. This Asus you've reviewed has already been outclassed.Reply -
cynic77 "We’re sure it’s only a matter of time before an Ultra HD panel becomes available in wide-gamut form."That time is now. The Dell 24" UP2414Q and 32" UP3214Q are Ultra HD monitors that cover 100% sRGB and 99% AdobeRBG. This Asus you've reviewed has already been outclassed.Reply -
cats_Paw Dat Price...Good thing is you need a crazy GPU to use that resolution anyway so by the time the 4k Monitors and tvs drop down in price we might have gpus that manage them in the upper midrange of the GPU segment.Reply -
Shneiky In the last chapter of the article, last paragraph:" crop of TN-based panels were announced at CES for sub-$1000 prices, and as those become available to test, you can be we'll review them. "Shouldn't that "be" be "bet"?Reply -
lockhrt999 If they are putting that much resolution on this screen then why not make it 3D too (polarized)? I think it's perfectly doable and won't exceed budget.I'm talking from professional point of view. I bored of using anaglyph 3D for content creation.Reply -
panzerknacker For me this is just a gimmick that can't be taken seriously. The way they had to logically divide the screen in 2 because there are no scalars yet simply screams 'niche product that you pay way too much for only to be the first person on earth using it'. Also for gaming this screen is completely useless to me with a input lag of 80ms, you take this to a LAN party and get crapped upon by those using a $100 tn panel. In the end I think this screen is a step in the right direction but for me personally they could rather revert to producing crt's again.Reply -
zodiacfml Good job but too pricey. The backlight used is for cheap TN screens. There still is no single port/cable in the market. The cutting edge is too inconvenient.Reply
