Do It Like Tom's: Calibrating Your Monitor With CalMAN RGB
A while back, we introduced you to display calibration with Datacolor's Sypder4Elite. Today we look at CalMAN RGB, which is the other major calibration solution. With extensive meter and pattern source support, it’s positioned as a professional’s tool.
CalMAN RGB How-To: Advanced Calibration, Part 3
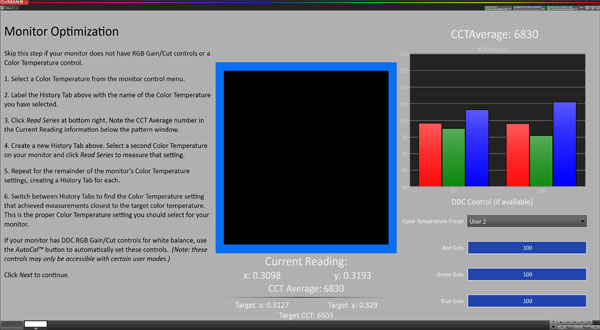
Grayscale calibration is handled in two phases: a two-point followed by a 17-point adjustment. For the two-point portion, your monitor’s RGB sliders and color temp modes are accessible via DDC.
Just like we do in our reviews, CalMAN measures 30- and 80-percent brightness patterns. The results are shown in the bar graphs on the right. You also get the x and y coordinates (.313 and .329 is the goal for D65) and the color temperature in Kelvins. You can try your monitor’s different picture modes to see which is closest and/or tweak the sliders to zero-in on the correct values. Or you can use the AutoCal button to let CalMAN do the work for you.
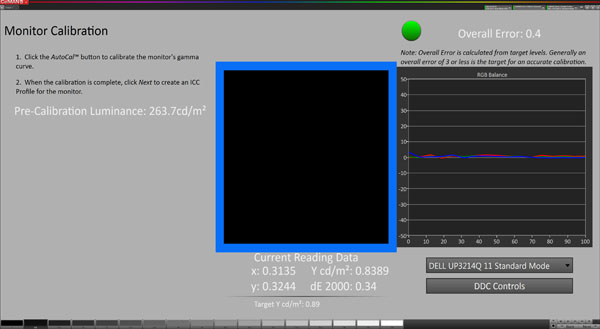
Now it’s time to fine-tune.
CalMAN can perform a 17-point grayscale calibration on this screen using the AutoCal feature. If you only want to take a measurement run, click Read Series at the lower-right. In our tests, AutoCal of the UP3214Q took about two minutes. And our result was well under one Delta E average, which is fantastic performance. Integrated into this step is a gamma calibration. Since CalMAN is creating a look-up table, gamma can be adjusted at the same 17 points as grayscale, yielding a much better gamma result than what is otherwise possible with presets in the OSD.
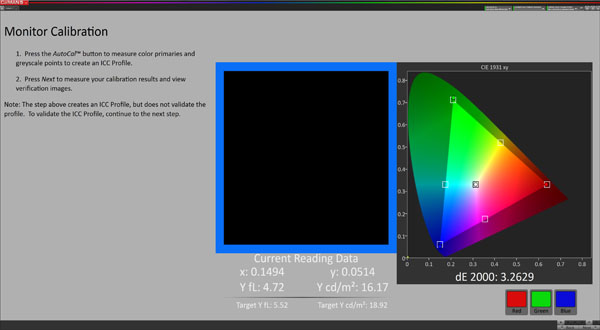
The final step is to create an ICC profile.
The only option is to click the AutoCal button. CalMAN measures the primary colors and white point, then generates a profile. You can manage these profiles in your graphics and photo applications.
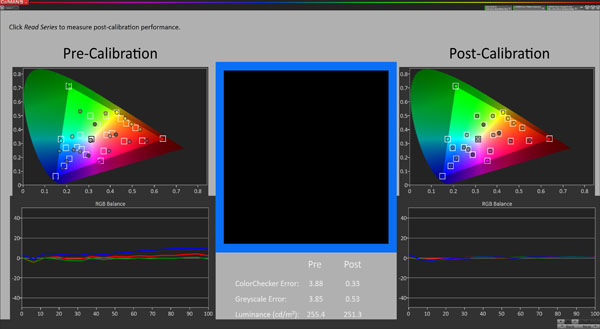
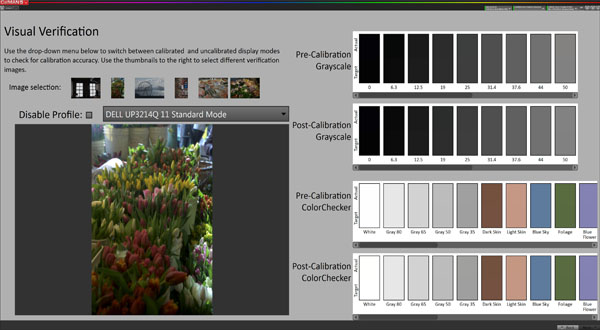
The last two screens show the results.
Get Tom's Hardware's best news and in-depth reviews, straight to your inbox.
In our case, there is visible improvement in both the grayscale and color gamut metrics. Errors are now down to less than one Delta E. Even though our Dell UP3214Q is quite accurate out of the box, 20 minutes spent with CalMAN RGB improves it to near-perfection. This single screen is a great snapshot of display performance and the effect of your calibration.
Here is a more real-world comparison using actual photos.
On the left are six photos you can view with the calibration LUT turned on or off. It switches back and forth quickly, making A/B comparisons easy. On the right are patches for grayscale and color showing before and after results. The colors scroll sideways to show you all 35 measurements from the color checker chart. Once you calibrate your other two profiles, you can compare them to each other with a few mouse clicks.
Current page: CalMAN RGB How-To: Advanced Calibration, Part 3
Prev Page CalMAN RGB How-To: Advanced Calibration, Part 2 Next Page Direct Display Control, AutoCal, And PC Client 3
Christian Eberle is a Contributing Editor for Tom's Hardware US. He's a veteran reviewer of A/V equipment, specializing in monitors. Christian began his obsession with tech when he built his first PC in 1991, a 286 running DOS 3.0 at a blazing 12MHz. In 2006, he undertook training from the Imaging Science Foundation in video calibration and testing and thus started a passion for precise imaging that persists to this day. He is also a professional musician with a degree from the New England Conservatory as a classical bassoonist which he used to good effect as a performer with the West Point Army Band from 1987 to 2013. He enjoys watching movies and listening to high-end audio in his custom-built home theater and can be seen riding trails near his home on a race-ready ICE VTX recumbent trike. Christian enjoys the endless summer in Florida where he lives with his wife and Chihuahua and plays with orchestras around the state.
-
merikafyeah I know it's exaggerated for the purpose of demonstrating differences in calibrated views, but you have got to pick a better "before and after" pic than the one you've been using up to now. They don't even compare the same subject. Half of the image is one thing and the other half is something else entirely. It's impossible to compare something if you're not even certain what exactly it is that you're comparing. I'd argue they don't even depict the kind of differences you'd see in calibrated vs uncalibrated displays, just different preferences in regards to artistic color-grading.Reply -
daglesj Are the Datacolor Spyders now properly calibrated out of the factory? Apparently quality control and specs were not very well handled with the Mk3 and befores. Basically every Spyder 3 would give different results.Reply -
sveinan I would recommend a review on ColorHUG (about $110), open source display colorimeter. It's fast, and worth it's money (http://www.hughski.com/index.html).Reply -
MANOFKRYPTONAK CNET reviews TVs and they post their calibration settings that they use for the best results. Each calibration is set up with professional tools, you can look up each tv by model number. I don't know if it is as good as this but.. its free! And it made a difference for me. But others like colorHUG, displaycalGUI, etc... are good just some different options if anyone is looking.Reply -
cangelini ReplyHate to say it, but this one reads like an infomercial....
This is simply the follow-up to an earlier story we did on Datacolor's solution that was well-received: http://www.tomshardware.com/reviews/spyder4-monitor-calibration-image-quality,3581.html. Both tools are in-use in our labs--I think it's useful to show our readers what we use to review monitors and how they might achieve similar results. At least, that was the intent. -
Evolution2001 I'd really like to calibrate my projector using more than just my eyes for perception. Using either the Spyder or CalMAN solutions, which ones offers me the least expensive path to that goal? Is it better to buy one of their all-inclusive packages, or find a colorimeter and software independently?Reply
