Core i5-3570K, -3550, -3550S, And -3570T: Ivy Bridge Efficiency
After recommending Sandy Bridge last year, we weren't particularly impressed by the new Ivy Bridge-based Core i7-3770K as an upgrade. But are Intel's more mainstream third-gen Core i5 processors any more attractive? We grab four models to find out.
Efficiency
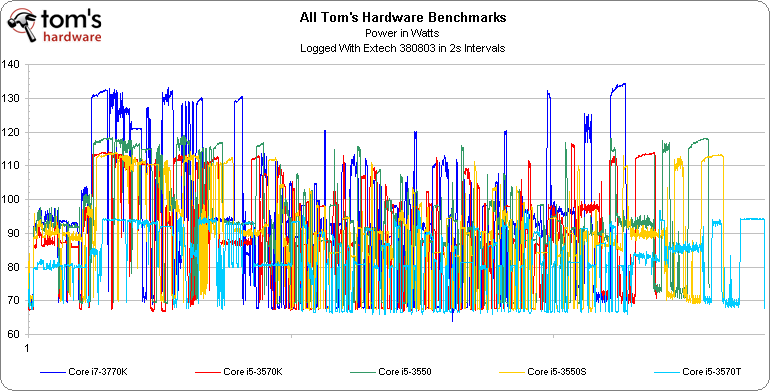
If you’ve already read my launch coverage of Intel’s Ivy Bridge architecture, then you probably also saw that I charted power consumption across all of our benchmarks, facilitating an average, a precise time measurement, and a representation of watt-hours based on the product of those two.
The only hiccup we encountered was that Intel’s older Core i7-2700K wrapped up faster than the Core i7-3770K. This was because the -2700K doesn’t support DirectX 11, and consequently skipped through 3DMark 11. Thus, I’m leaving Sandy Bridge out of this comparison altogether.
It’s typically pretty hard to read these line charts, particularly with more than 30 or 40 minutes worth of data from five different CPUs crammed in. However, the peaks are perhaps most telling. We clearly see that the 77 W Core i7-3770K spikes the highest, followed by the Core i5-3550, the Core i5-3570K and Core i5-3550S fairly close together, and finally the Core i5-3570T.
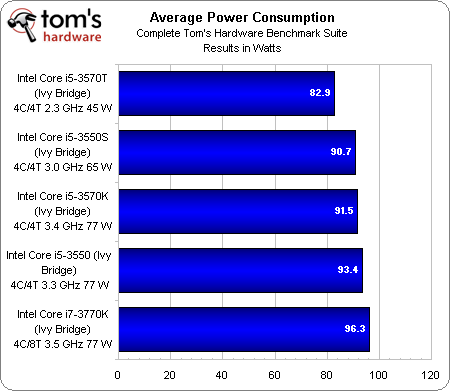
In an effort to make it easier to digest that consumption information, I averaged together the lines for each CPU. The result is surprisingly subtle.
As we’d expect, the Core i7-3770K uses the most power. The other two 77 W models follow behind closely. Interestingly, the 65 W Core i5-3550S ends up less than 1 W behind the Core i5-3570K. The most significant reduction comes from the Core i5-3570T, which drops down to 82.9 W of system power, on average.
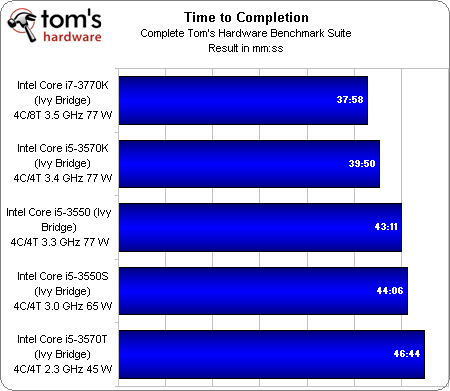
Of course, the compromise you make when you cut power is generally a corresponding loss of performance. We see a gradual scale down from the Core i7-3770K at just under 38 minutes to the Core i5-3570T, which takes almost 47 minutes to finish our benchmark suite.
All of those results trump what we saw in my original review of the Core i7-3770K. In fact, even a Core i7-3960X mated to a GeForce GTX 680 took more than an hour and nine minutes to wrap up. So, what the heck happened? Knowing that the major difference between that platform and these is integrated graphics, that PCMark 7 is able to exploit Quick Sync, and that the results we garnered for PCMark were so much higher than anything seen before, it’s safe to assume that the most significant time-savings comes from Futuremark's synthetic metric.
Get Tom's Hardware's best news and in-depth reviews, straight to your inbox.
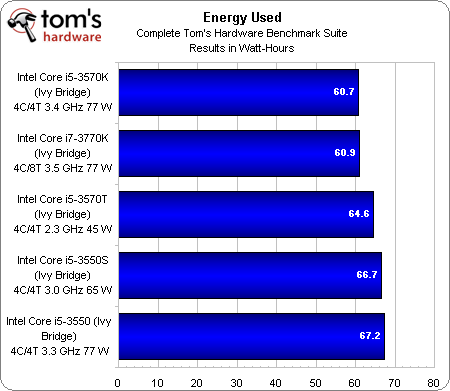
We can take those average power consumption numbers and multiply them by the fraction of an hour taken to complete our in-house suite to come up with energy used in watt-hours.
What we find is that the two fastest processors—both K-series SKUs—use their superior performance to finish up workloads faster. The fact that they use slightly more power, on average, than the purported low-power parts is completely counteracted by their ability to drop back to idle sooner.
Although Core i5-3550 is the least-efficient model in our comparison, the –T and –S parts fail to impress. There’s really only one reason to buy either SKU, and I’ll get into that as we wrap up.
Current page: Efficiency
Prev Page Power Consumption And Max. Temperature Next Page Low-Power CPUs: Specific Applications Only-
erraticfocus nice work in sorting out the facts and reminding us about the history and change from the lower power offerings in the intel stable..Reply
-
amdfangirl Does Intel allow underclocking and undervolting on H-series boards? If so, S and T series are pretty redundant.Reply -
Onikage 2700K looks a clear Winner to me ! got one last week from Microcenter at an ironic but sensational price 270$ !!!! hey 3770K try and beat that !Reply -
Outlander_04 In the real world gaming section you got a great big graph for the 3770k by adding a discreet graphics card . Why didn't you try a Llano system with an identical graphics card? Afraid the second tier AMD product would kick sand in intels face?Reply -
cangelini Outlander_04In the real world gaming section you got a great big graph for the 3770k by adding a discreet graphics card . Why didn't you try a Llano system with an identical graphics card? Afraid the second tier AMD product would kick sand in intels face?Because this is a story about the Intel chips. To the contrary, though, the AMD-based platform is more likely to bottleneck a discrete graphics card than the Intel one. AMD's strength is in the integrated graphics right now.Reply -
Outlander_04 The performance of a Llano chip is included in the article to compare its performance so it not just about intel cpu's . The intels were not as good in gaming in the integrated graphics so a graphics card was added so they'd look better there too . Its an unfair comparison and shows intel bias IMOReply -
jimmysmitty Outlander_04The performance of a Llano chip is included in the article to compare its performance so it not just about intel cpu's . The intels were not as good in gaming in the integrated graphics so a graphics card was added so they'd look better there too . Its an unfair comparison and shows intel bias IMOReply
Actually a lot of sites have shown just what Chris is talking about. Even a dual core Pentium with a HD6670 beats the top end Llano piece (a quad core) even with CFX of the IGP with a HD6570. Llano is great for some things but overall in DT its only a low end entry level product and is much weaker per core and per clock than Intels CPUs.
What Chris did was pulled the same charts from his first IB review and added in the HD2500 (the new low end Intel IGP) for comparison.
If someone cannot take this information and realize that its just for comparison and that its not to show anything better, then thats their problem. If this was a Llano article, or the Trinity article when it comes out, you better believe Chris will do everything to check ever performance aspect. But its not. Its an article to see if the T and S models are worth it.
Overll, llano is overrate in my book. We have barley sold any at my work place. Just doesn't have the pulling power like a CPU and discrete GPU does. -
Outlander_04 If you are going to show the performance of an intel cpu with a graphics card then any reasonable comparison would also show the AMD cpu with the same graphics card .Reply


