2011 Flash Memory Summit Recap: Tom's Hardware Represents
The Dirty Secrets Of SSD Benchmarking
Where is Steady State?
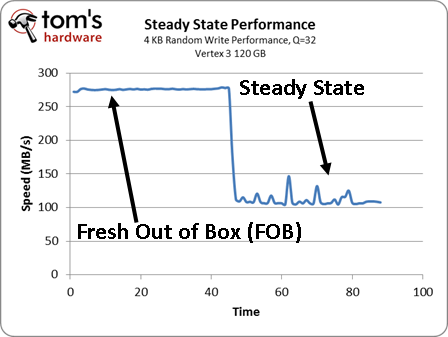
There are a couple of dirty secrets that most Tom's Hardware readers know, but few mainstream buyers would have ever had occasion to hear. The first has to do with performance fresh out of the box versus steady-state performance. SSD manufacturers prefer that we benchmark drives the way they behave as soon as you buy them because solid-state drives slow down once you start using them. If you give an SSD enough time, though, it reaches a steady-state level. At that point, its benchmark results reflect more consistent long-term use. In general, reads are a little faster, writes are slower, and erase cycles take place as slowly as you'll ever see from the drive.
There’s been a movement within the flash storage community to standardize performance analysis to focus on steady-state. A lot of conference presenters kept stressing this point. However, they left out one important detail: there isn’t one single steady state. Instead, you might see 4 KB random writes stabilize at one point, and 128 KB sequential writes stabilize somewhere else. You can even get more granular and figure out where 128 KB sequential writes hit their steady-state level in bursty and sustained transfers.
The main takeaway was that there isn't one moment in time where we can declare, "this drive just reached its steady-state performance level; we're ready to test it." You could benchmark a single SSD for an entire month and still not have its complete performance profile worked out. What you write, how fast you write it, how much you write, the I/O workload from the previous days and weeks and so on all change how the SSD performs.
We prefer to focus on the overall picture, including the main points that help you make an informed purchase. It’s not that other benchmarks don’t matter, but we’re trying to present SSD performance in manageable bites that don’t overwhelm. That’s why we focus on a consumer-oriented steady state reached within a reasonable period, which you can read more about on page four of Second-Gen SandForce: Seven 120 GB SSDs Rounded Up.
Consumer vs. Enterprise Benchmarking
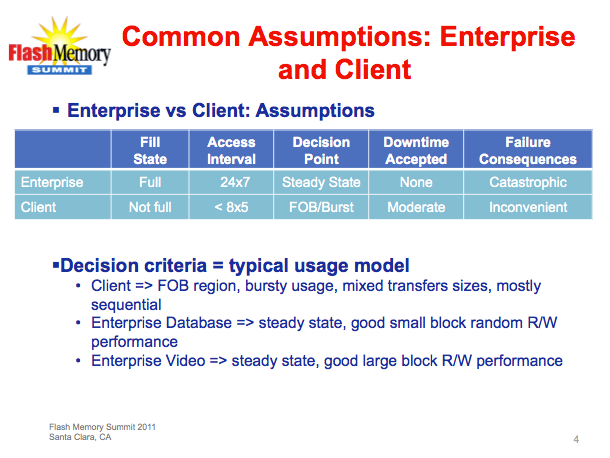
Almost every SSD's specification sheet cites performance based on when the drive is brand new, which we've already established is only representative of what you get for a brief period. However, manufacturers blur the performance picture even more by generating all of their data using high queue depths. We don't really take issue with that in the enterprise space, because SSDs may very well encounter high queue depths when they're getting hammered by online transaction processing or some other, similar workload. Solid-state drives on the desktop simply don't encounter those same queue depths, though. As a result, most performance guidance is overstated.
Get Tom's Hardware's best news and in-depth reviews, straight to your inbox.
We can't blame the SSD industry for representing performance this way. After all, vendors are responsible for shining the best possible light on their products, and high queue depths are, in fact, the best way to saturate the multi-channel architectures employed by SSD controllers, yielding the best performance. More important is that end-users realize they won't see those same aggressive figures on their own desktops.
This is something we’ve tried to emphasize as of late, giving you a more realistic perspective of everyday performance. And we can promise you that there are more than a couple of SSD vendors unhappy with us for running our tests using queue depths derived from real-world traces. But we answer to you, not them. And so, the differences between SSDs are fewer in our results than you might otherwise expect from comparing spec sheets. The benefit is that you don't actually have to buy the latest or most expensive SSD in order to enjoy a substantial performance boost.
Current page: The Dirty Secrets Of SSD Benchmarking
Prev Page Our Take On SSD Benchmarking Next Page SSD Performance: One Cog In The Wheel-
compton Is there a way for a user to record their own week of disk access, and in so doing make their own Storage Bench (with the assistance of some other software)?Reply -
Still very surprised hybrid hard disks like the Momentus XT aren't getting more R&D. If they included even half the capacity of a mainstream HD and a quarter the capacity of a mainstream SSD, they'd have an amazing product. Just think: a 500GB platter paired with 32GB SSD for, what, $150? I'd buy that in a jiffy.Reply
-
chovav caywen - I don't think I agree. This approach means you will lose both SSD and hard drive if one fails. Second, a small SSD like that will only be useful for caching, which we all saw until now isn't worth much.Reply
lastly, wanting to upgrade will mean having to upgrade both, instead of one. I think this is one of the reasons why the XT was never so popular...
O.T - nice read. It did feel a bit as though it was stopped in the middle.. -
mkrijt chovavIt did feel a bit as though it was stopped in the middle..Reply
That was exactly what I was thinking. I was looking for the "next page" button but couldn't find it. I was like wtf? went back to the first page to look at the index finding it really ended there :( -
cknobman mkrijtThat was exactly what I was thinking. I was looking for the "next page" button but couldn't find it. I was like wtf? went back to the first page to look at the index finding it really ended thereReply
LOL me too!!!
For me personally I am willing to drop up to $120 on a SSD but that is the breaking poing for me and I am not willing to settle for anything less than 120GB due to the performance drop in smaller SSD's and also how much space I need for my OS and other apps (and no I am not counting data like movies or pics).
The main thing holding me off on purchasing a SSD right now is the lack of confidence in reliability. The bugs in Intel, Sandforce, and whatever controller crucial uses in the m4 makes me worried. Just looking at articles here and user reviews on NewEgg was enough for me to get gun shy and wait. There are few things I hate more than having to setup my system and even though I can ghost my boot drive there will always be some loss in a drive failure and that is just something I want to avoid if I can. Unfortunately it just seems like owning a SSD right now leaves too high a risk of drive failure. Plus it does not help reading how manufacturers refuse to comment or give any real hard data on reliability. -
nforce4max What about page file related write attributed to normal use? It is very easy to see more than 10gb a day worth of writes depending on the apps used.Reply -
razvanz nforce4max I agree with you. I haven't seen any SSD tests using bittorent. How does a SSD fare against a HDD in bittorent usage. I think bittorent will easily overwhelm the read/write cycles of a SSD.Reply -
JamesAbel On the surveys on "willingless to pay for SSDs" - has this ever been done on someone that has TRIED an SSD? Reading about a benchmark is different than experiencing it. On my SSDs, I see huge benefits in things like app load time vs. an HDD. Also, SSDs are much faster vs. HDDs when multiple apps are running and causing lots of head seeks (drive thrash). Give someone an SSD for a month and then give them back an HDD - I think many won't be so willing to switch back (and be willing to pay from there on out).Reply -
Mark_Alberta I have been testing various SATA SSD's for recording CCTV footage for several months now. The results have been disappointing when compared to mechanical hard drives. First off, unless I set the maximum file size to 85% or less of the drive's capacity, instead of 95% with say, a WD Caviar Black, the drive would over write the data 3-4 times and then suddenly become undetectable on the system until I reboot it. Not a good thing when considering the purpose of the unit. This has occurred on three different manufacturer's drives, so it's obviously not a one-off issue. Another interesting problem that can up was on the 40GB OS drive, the detected volume dropped from 37GB to roughly 24GB. I reformatted the drive, re-installed the OS and everything returned to normal. I am going to continue to try and perfect a system using SSD's, but it is a lot more of a headache that the simplicity of plugging in a 3.5" mechanical drive and moving on.Reply -
drwho1 I would be willing to pay from $150 to @200 top for a 500GB SSD.Reply
When prices and size ratio meet this price standards then I would take a serious look into SSD's.
Have in mind that current 2TB hard drives are under $100 dollars (true they are green drives). But when a SSD per GB cost 10 to 20 times as much a hard drive is just not right to me.

