Roundup: Nine GeForce GTX 460 1 GB Boards Benchmarked
Happy with Nvidia's GeForce GTX 460, we invited a dozen of the industry's top graphics companies to show off their unique interpretations of the card. Nine responded with what they feel are exceptional products. Can they get any better than reference?
Average Performance, Power, And Heat
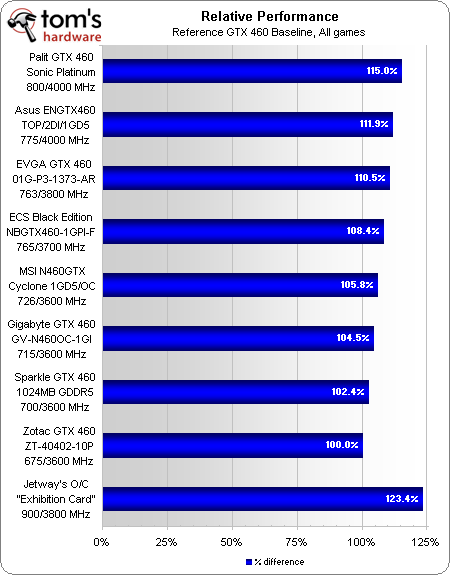
We’ll need to consider our average performance difference to calculate any efficiency differences, so we begin with a cumulative chart:
A 19% GPU overclock and 11% DRAM overclock allows Palit’s Sonic Platinum Overclocking Edition to show a 15% overall lead compared to the reference-clocked Zotac card.
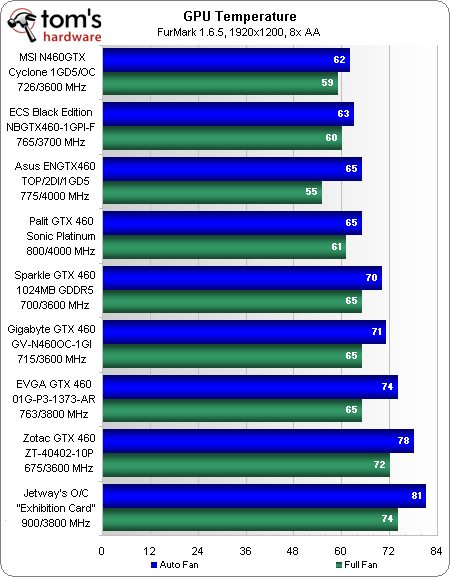
MSI has the coolest-running card, likely due to its huge GPU cooler. Yet its full-fan tests weren’t as spectacular. Asus’ fan supports higher-speed operation, resulting in a relatively chilly GPU temperature that’s available to anyone who can tolerate its higher full-speed noise. ECS’ even larger cooling solution sits in the middle.
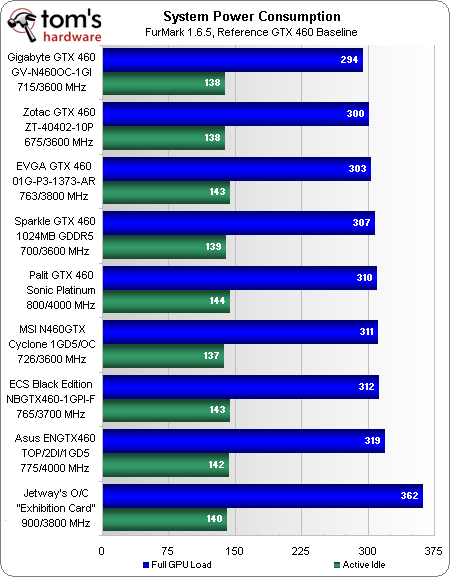
Gigabyte constantly claims that its Ultra Durable components save power, but today’s power test is one of those rare occasions where we actually see the difference.
A huge power consumption increase points towards likely voltage mods in Jetway’s non-retail card, possibly putting a wrench in the plans of overclockers who would like to repeat Jetway’s efforts.
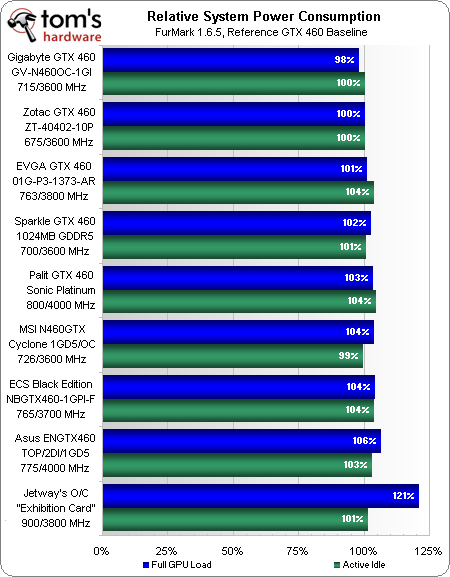
Putting power consumption on a percent scale will allow us to gauge efficiency on the next page. The word “relative” refers to a comparison to the baseline, which in this case is Zotac’s reference-speed model.
Get Tom's Hardware's best news and in-depth reviews, straight to your inbox.
Current page: Average Performance, Power, And Heat
Prev Page Benchmark Results: S.T.A.L.K.E.R.: Call Of Pripyat Next Page Efficiency, Price, And Performance Value-
TheStealthyOne I really am a fan of ASUS' DirectCu/TOP cards.Reply
I can't decide between the 460 and 5850 versions :P -
beans4you just installed two gigabyte 460 cards in my brothers new setup, they are pretty nice! can't hear them even with the 2 fans on each and they run around 25/29 C idle, this is as far as I've gotten with tests :pReply -
falchard thestealthyoneI really am a fan of ASUS' DirectCu/TOP cards.I can't decide between the 460 and 5850 versionsThats a contemplative choice? Considering its not the 5830, the clear choice is the 5850.Reply -
Lmeow Wow. Jetway's 33 % overclock is nSane... especially on what seems to be nVidia's reference cooler.Reply
I wonder how many cards can reach that 900 MHz with acceptable noise and voltage levels. -
El_Capitan This review is trying to tell us what? Higher overclocked cards give better performance? Duh?Reply
It would have been better to see each card overclocked to it's most stable overclock first, then test the cards with all the benchmarks.
I read CPU magazine's article comparing the GTX 460's, and same conclusion. Palit is the fastest, but MSI's is the quietest and coolest.
I've been looking into getting a pair for SLI. Those that don't have extra space between their PCI Express 2.0 slots should go for the EVGA Superclocked because of the external exhaust. Those that do have space like me and prefer low noise would be better off the MSI's. Performance-wise, they're all great overclockers (every card in this review can overclock higher than Palit's factory overclock). Honestly, you really can't go wrong with any of these cards. -
void I have one gigabyte card and very happy with it. Almost complete silent at idle. and not much noise at 100% fan speed. 50% fan speed is enough to keep it around 60c in gamesReply -
amgsoft If you are going to use the cards in PC in your home, the less noisy and the coolest is often the best choice.Reply


