Meet The 2012 Graphics Charts: How We're Testing This Year
It's time to revamp the Graphics Charts section! For 2012, we're increasing the number of games and resolutions, dividing the results into three segments. But that's not all. We also include GPGPU benchmarking, power consumption, temperature, and noise.
Selecting A Monitor And Choosing Resolutions
Selecting a Monitor
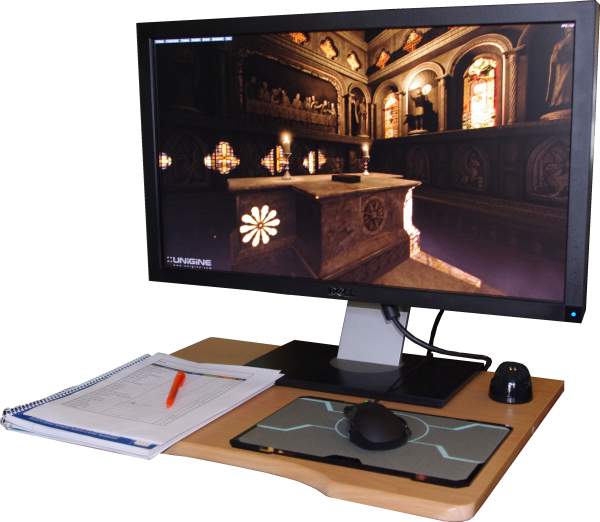
Based on usage statistics, we standardized on a 16:9 aspect ratio for the charts (don't worry, you'll still see 2560x1600 in our reviews). We also expanded the number of screen resolutions that get benchmarked, testing at 1280x720, 1920x1080, and 2560x1440. At each resolution, we use a suitable combination of quality settings for entry-level, performance, and extreme usage scenarios. Those all get explained on the next page. In order to objectively assess image quality, we switched to a fast H-IPS panel, which achieves a broader color range than common TN-based panels, along with a larger viewing angle and higher brightness.
After careful analysis, we chose Dell's U2711 as the basis for our test platform.
| Technical Data | |
|---|---|
| Make / Model | Dell U2711 |
| Pixel Size (mm) | 0.233 |
| Default Resolution: | 2560x1440 (16:9) |
| Actual Screen Size/ Diagonal (inches) | 23.5x13.2 / 27.0 |
| FPS (Hz) | 56-75 (HDMI: 24 / 48 / 50 / 60) |
| Max. Line Frequency / Video Bandwidth (kHz/MHz) | 30-89 / 165 |
| Color Spaces Preset/User: | 7/1 and 4/1 |
Due to the noticeably increased performance of current and to-be-released high-end graphics cards, testing at 2560x1440 becomes more important. The ubiquitous 1080p resolution with 1920x1080 pixels, typically offered by LCD monitors in the 22” to 24” range, is the new mid-range charts setting. At the low end, we also test with the relatively smaller 720p resolution with 1280x720 pixels. Obviously, we can't test with all possible resolutions, but feel free to interpolate test results using this handy resolution table:
| Designation | Width in Pixels | Height in Pixels | Total Pixels | Aspect Ratio |
|---|---|---|---|---|
| SVGA | 800 | 600 | 480 000 | 4:3 |
| XGA | 1024 | 768 | 786 432 | 4:3 |
| XGA+ | 1152 | 768 | 884 736 | 3:2 |
| HD720 | 1280 | 720 | 921 600 | 16:9 |
| WXGA | 1280 | 768 | 983 040 | 16:9 |
| 1280 | 800 | 1 024 000 | 16:10 | |
| 1366 | 768 | 1 049 088 | 16:9 | |
| SXGA | 1280 | 1024 | 1 310 720 | 5:4 |
| WSXGA | 1440 | 960 | 1 382 400 | 3:2 |
| SXGA+ | 1440 | 1050 | 1 512 000 | 4:3 |
| WSXGA+ | 1680 | 1050 | 1 764 000 | 16:10 |
| UXGA | 1600 | 1200 | 1 920 000 | 4:3 |
| HD1080 | 1920 | 1080 | 2 073 600 | 16:9 |
| WUXGA | 1920 | 1200 | 2 304 000 | 16:10 |
| HD1440 | 2560 | 1440 | 3 686 400 | 16:9 |
| WQXGA | 2560 | 1600 | 4 096 000 | 16:10 |
With our monitor choice established, let's have a look at the three different preset levels that we use to benchmark entry-level, mid-range, and high-end graphics cards.
Get Tom's Hardware's best news and in-depth reviews, straight to your inbox.
Current page: Selecting A Monitor And Choosing Resolutions
Prev Page Meet Our 2012 Graphics Charts Next Page Preset Levels: Entry-Level, Performance, And Extreme
Igor Wallossek wrote a wide variety of hardware articles for Tom's Hardware, with a strong focus on technical analysis and in-depth reviews. His contributions have spanned a broad spectrum of PC components, including GPUs, CPUs, workstations, and PC builds. His insightful articles provide readers with detailed knowledge to make informed decisions in the ever-evolving tech landscape
-
johnny_utah While I love the new techniques, using BITCOIN to bench GPUGPU performance instead of Folding @ Home? Um, okay.Reply -
Still with the bar charts? Would *love* to see scatter plots with price/score on the axes... So much more useful in picking out a card.Reply
-
AznCracker Man the charts are dying to be updated. Too bad it isn't done more often since it takes a lot of work.Reply -
pharoahhalfdead johnny_utahWhile I love the new techniques, using BITCOIN to bench GPUGPU performance instead of Folding @ Home? Um, okay.Reply
I agree. I know Tom's spends a lot of time benchmarking, but Folding@home is something that is a bit more common. I would love to see F@H in some articles.
BTW, I appreciate all the work you guys do. -
randomkid Where's the 5760x1080? In the area where I come from, 3x 1920x1080p 22" monitor cost around the same or even less than a single 2560x1440/1600 27" monitor so this is a more likely configuration among gamers.Reply
The 5760x1080 resolution will also push the GPU's harder than a 2560x1440/1600 could so why limit the resolution there? -
Reply
We'll add up to 20 new boards each month until the lower end of the performance range is filled out, too.
How far back in GPU generations are you going to test, if at all? I saw the power consumption charts and could only see GTX 500, 600 and Radeon 6000, 7000 series. I have an EVGA GTX 480 SC for two years and do like to know how it compares to the newer series of GPUs. Much appreciated. -
Yargnit MMO FanYup no surprise here typical Nvidia benchmark suite fuck sakes.Reply
So what would YOU like to see used then? If they were trying to push Nvidia wouldn't Hawx 2 be in the suite? -
shinym For Starcraft II you say "This game doesn't stress the CPU, and is thus well-suited for GPU benchmarking." Looks like you got CPU and GPU mixed up there.Reply
