Meet The 2012 Graphics Charts: How We're Testing This Year
It's time to revamp the Graphics Charts section! For 2012, we're increasing the number of games and resolutions, dividing the results into three segments. But that's not all. We also include GPGPU benchmarking, power consumption, temperature, and noise.
Measuring Noise Level
Decibels or Sone?
Decibels and sone as measures of noise level both have advantages and disadvantages. Physical sound pressure is measured in decibel. It's easy to measure, and people are generally familiar with it. However, it doesn't relate to human perception of sound very well. So, even though the sound pressure in decibel might have doubled, that doesn't mean that we actually perceive it to have doubled.
The definition of perceived loudness in sone is based on the sound level. A sine wave audio signal at 1 kHz and 40 dB is equivalent to 40 phons, which, in turn, is defined as one sone. When a person perceives a sound wave as being twice as loud, this is called two sone; half as loud is called 0.5 sone. Although this seems practical, logical, and convenient to use, there are some traps and pitfalls when using sone, which ultimately sway us toward using decibel.
First, sone doesn't scale well below one sone. Even though a sound level increase of 10 phons above one sone is perceived as a doubling of loudness, the situation is more complex below 40 phons, where sound level reductions of less than 10 phons are perceived as halving loudness. Unfortunately, there is no generally-accepted formula for this sound pressure range. As graphics cards at idle typically have sound levels of less than 40 phons, this poses a major problem.
Second, sone is based on a pure sine wave of 1 kHz at 40 dB. Fans, however, generate sounds that are a mix of frequencies, and not a pure sine wave. Different frequencies are perceived to have different loudness at the same sound pressure. What would you rather listen to, a low hum or a high-pitched whine at the same loudness?
In order to emulate, or partially emulate, the sound response of the ear, sound measurements typically use weighted sound power curves, such as the standardized curves specified in EN 61672-1/-2. These curves constitute filters that try to emulate the frequency response of the human ear when conducting a sound level measurement. These curves are, of course, approximations. But, depending on the accuracy of the sound level meter, the resulting data in dB(A) is more relevant than data in sone when we are dealing with sound levels below 40 dB. A dB(A) value has to be accompanied by the distance to the sound source in order to be useful.
Bottom line: We use the so-called A-curve as the filter. In other words, we use dB(A) as the unit for our sound level measurements.
Get Tom's Hardware's best news and in-depth reviews, straight to your inbox.
Noise Level Measurements in the Real World
Since our test rig is mobile, we can measure the sound level in a designated chamber that's devoid of sound sources like computers and air conditioning. The chamber features soundproof windows, a thick carpet, and a fold-up three-sided soundproofing compartment with a lid that has an array of soft foam pyramids.
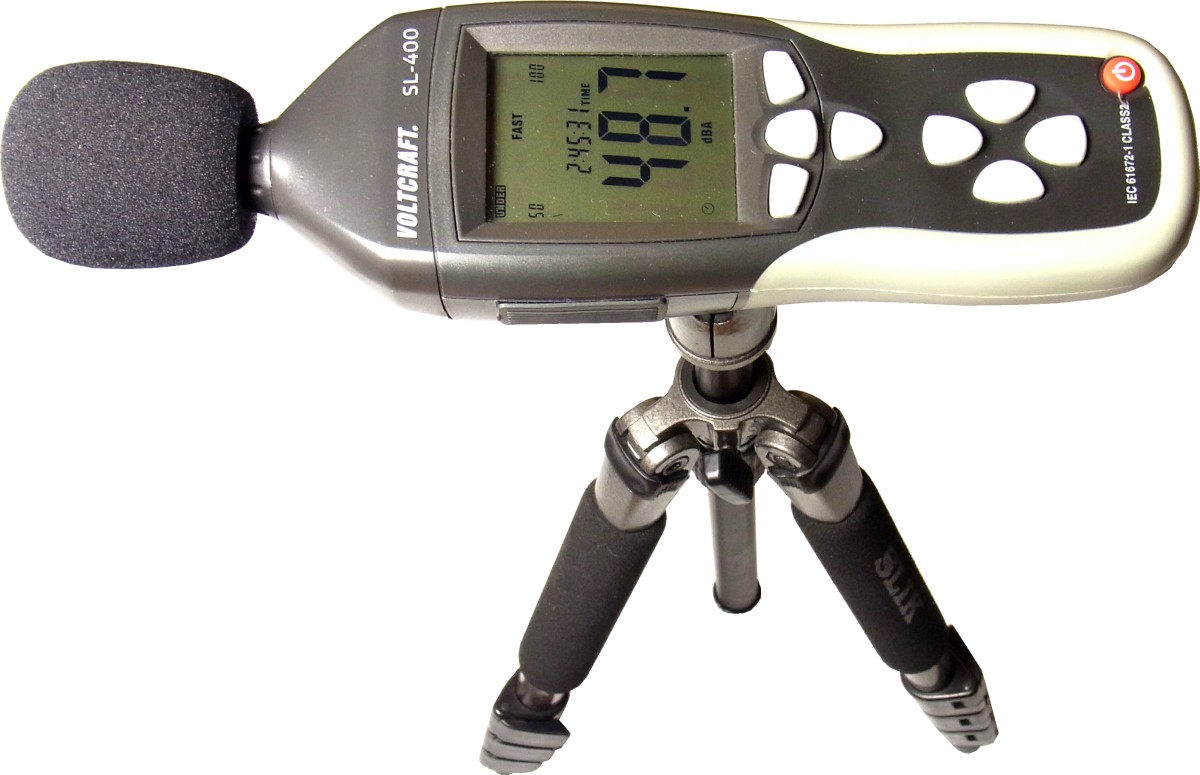
We measure the sound level with a Voltcraft SL 400 sound level meter and log the results with an attached data logger. The instrument is mounted on a tripod, which is placed on a thick felt mat to isolate it from structure-borne sound. The distance to the graphics card is 20” (50 cm), and the microphone is aimed at the fan. If the card has two fans, the microphone is aimed between the two fans. Even though this instrument is certified for measurements down to 30 dB(A), we had it calibrated down to 27 dB(A) with a professional sound level meter; we found only minor discrepancies, all of which may have been random.
Next, we take a look at temperature measurements.

Igor Wallossek wrote a wide variety of hardware articles for Tom's Hardware, with a strong focus on technical analysis and in-depth reviews. His contributions have spanned a broad spectrum of PC components, including GPUs, CPUs, workstations, and PC builds. His insightful articles provide readers with detailed knowledge to make informed decisions in the ever-evolving tech landscape
-
johnny_utah While I love the new techniques, using BITCOIN to bench GPUGPU performance instead of Folding @ Home? Um, okay.Reply -
Still with the bar charts? Would *love* to see scatter plots with price/score on the axes... So much more useful in picking out a card.Reply
-
AznCracker Man the charts are dying to be updated. Too bad it isn't done more often since it takes a lot of work.Reply -
pharoahhalfdead johnny_utahWhile I love the new techniques, using BITCOIN to bench GPUGPU performance instead of Folding @ Home? Um, okay.Reply
I agree. I know Tom's spends a lot of time benchmarking, but Folding@home is something that is a bit more common. I would love to see F@H in some articles.
BTW, I appreciate all the work you guys do. -
randomkid Where's the 5760x1080? In the area where I come from, 3x 1920x1080p 22" monitor cost around the same or even less than a single 2560x1440/1600 27" monitor so this is a more likely configuration among gamers.Reply
The 5760x1080 resolution will also push the GPU's harder than a 2560x1440/1600 could so why limit the resolution there? -
Reply
We'll add up to 20 new boards each month until the lower end of the performance range is filled out, too.
How far back in GPU generations are you going to test, if at all? I saw the power consumption charts and could only see GTX 500, 600 and Radeon 6000, 7000 series. I have an EVGA GTX 480 SC for two years and do like to know how it compares to the newer series of GPUs. Much appreciated. -
Yargnit MMO FanYup no surprise here typical Nvidia benchmark suite fuck sakes.Reply
So what would YOU like to see used then? If they were trying to push Nvidia wouldn't Hawx 2 be in the suite? -
shinym For Starcraft II you say "This game doesn't stress the CPU, and is thus well-suited for GPU benchmarking." Looks like you got CPU and GPU mixed up there.Reply

